Self-Host Dewiride Analytics on Ubuntu Server — Part 5: Read the Dashboard — Humans, Bots and Engagement

Your installation is collecting. This part reads every panel on the dashboard — and starts with the thing that makes this product different: it tells you in plain sentences why it thinks a visit was a person or a machine, states how many readings each figure could actually be taken from, and says "not known" rather than guess.
This is Part 5 of a 6-part series.
- Part 1: Run the Stack with Docker Compose
- Part 2: Close the Ports Docker Opened Behind Your Firewall
- Part 3: Custom Domain and Free HTTPS with Caddy
- Part 4: Claim the Install and Add Your First Website
- Part 5: Read the Dashboard — Humans, Bots and Engagement (you are here)
- Part 6: Backups, Updates and Day-2 Operations
Where These Numbers Came From
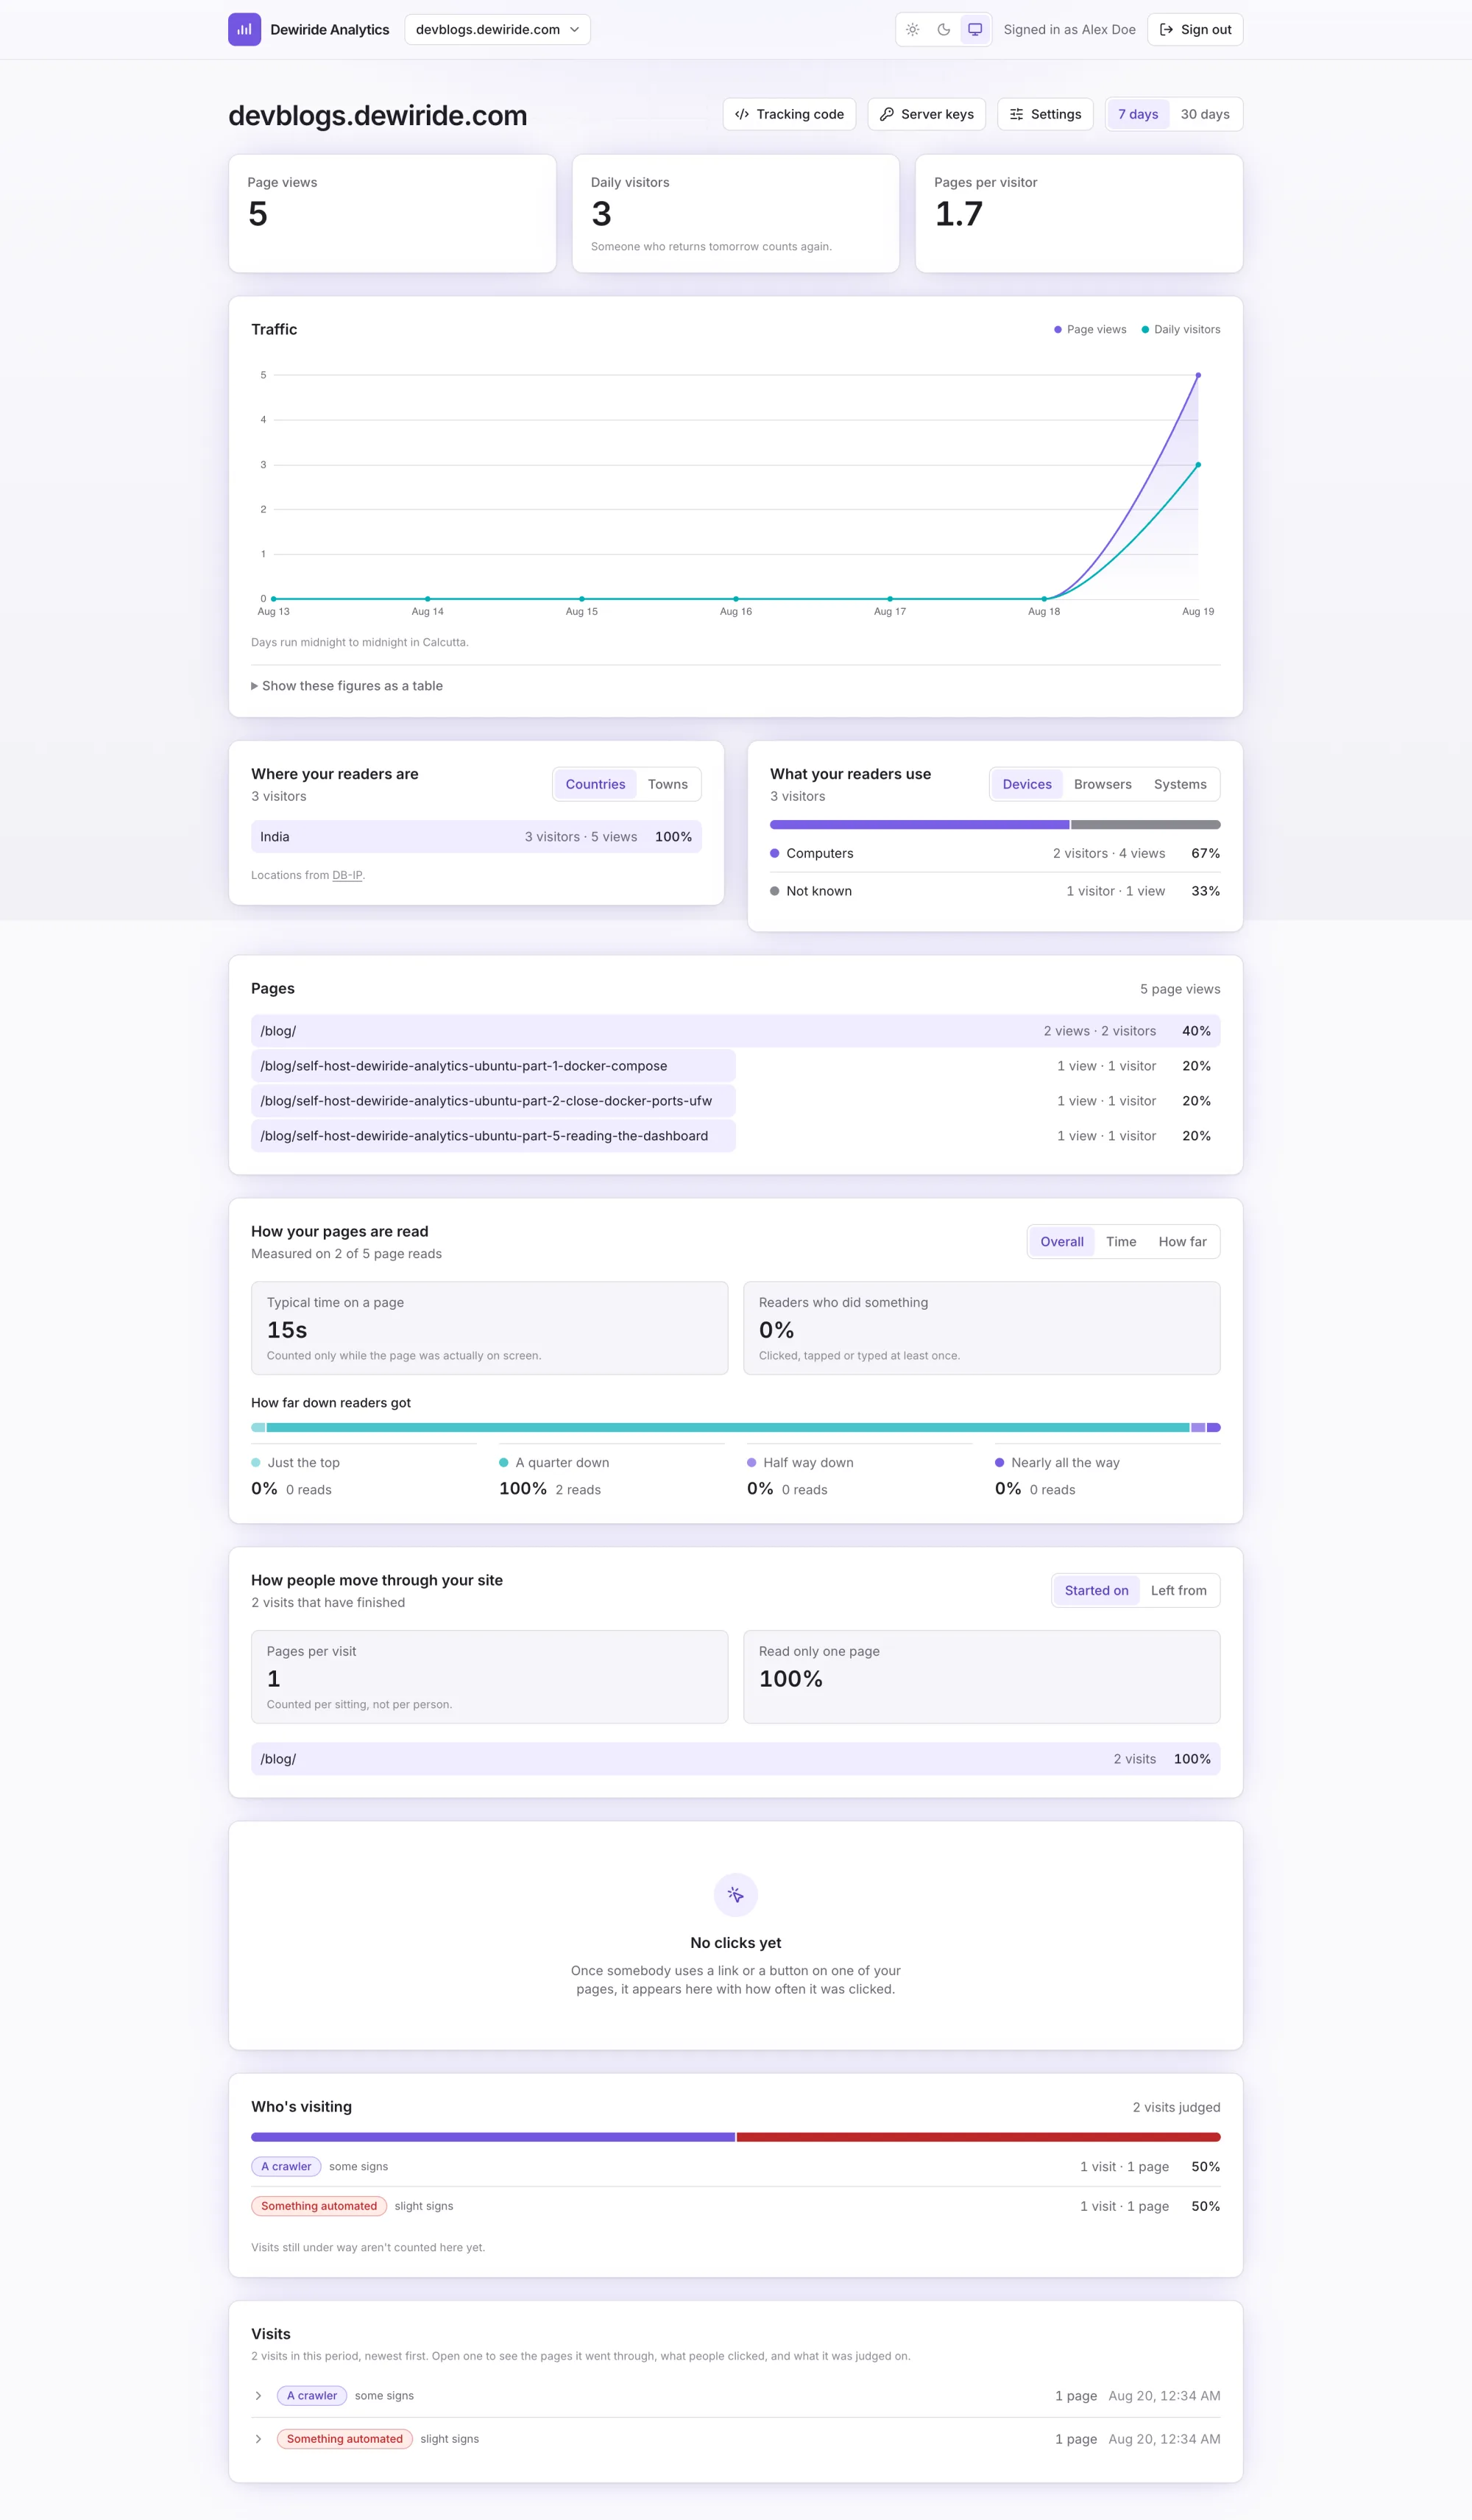
Every screenshot below is from the real installation this series built, measuring this blog. At the moment of capture it held five page views from three visitors, and I know exactly what all five were:
- Two
curlrequests I made while testing the no-JavaScript pixel in Part 4. One announced itself honestly; one wore a fake ChromeUser-Agent. - Three page reads from one real browser — mine, reading three pages of this series on the live site, scrolling but never clicking.
A tiny dataset, and deliberately disclosed. It also happens to contain exactly the mix this product exists to separate: automation that would be counted as visitors anywhere else, sitting next to a genuine read.
The Top Row
| Figure | Value | What it means |
|---|---|---|
| Page views | 5 | Pages delivered. Not requests, not assets |
| Daily visitors | 3 | People-shaped things seen in a day. "Someone who returns tomorrow counts again." |
| Pages per visitor | 1.7 | Page views divided by visitors, for the period |
That sentence under Daily visitors matters more than it looks. It says the metric is daily uniques, so a week's figures are not seven days of unique people — a reader who comes back on Tuesday is counted again. Most products bury that distinction; this one prints it under the number.
There is no "unique visitors this month" here at all, and the omission is deliberate: recognising the same person across weeks needs a durable identifier, and this product rotates its key daily precisely so that it cannot.
Above the graph sits "Days run midnight to midnight in Calcutta." — the reporting time zone chosen in Part 4. That one line pre-empts the classic support question: why does my Monday not match my hosting panel's Monday?
Where Your Readers Are
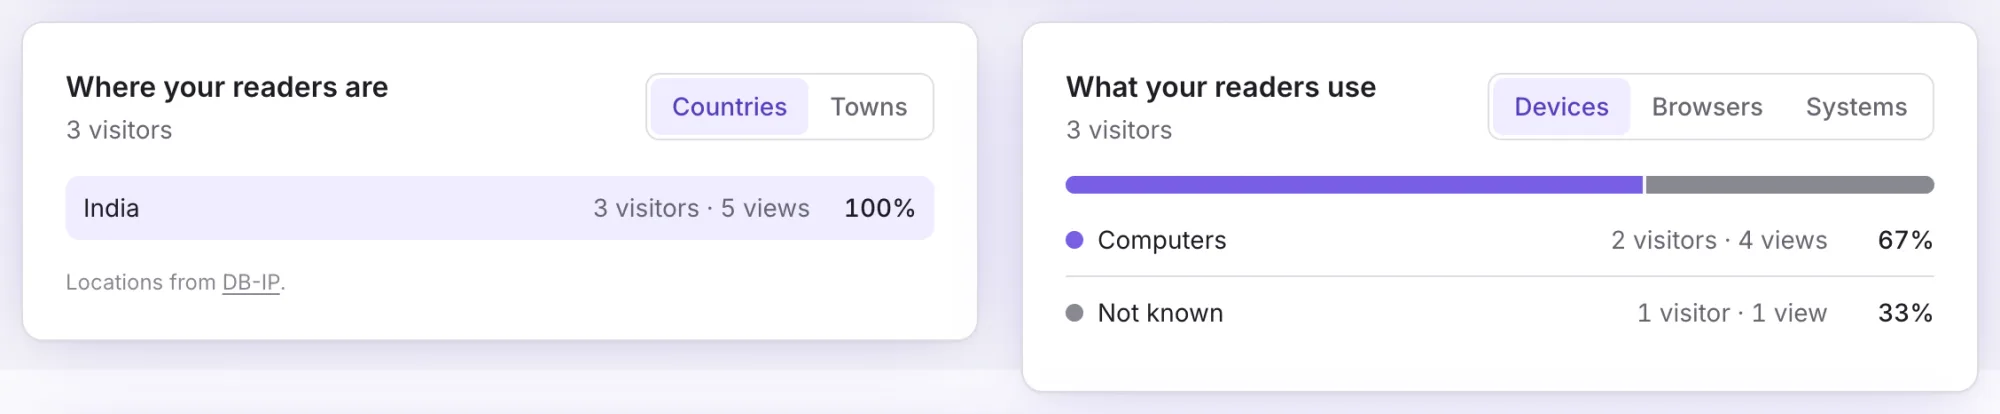
India 3 visitors · 5 views 100%
This panel is your proof that Part 3 was configured correctly, and it is worth checking on day one.
All five requests came from a laptop in India. Each one reached Caddy, which passed it to the dashboard container, which passed it to the engine — three hops, every one of them adding a network address that is not the visitor's. And the engine still reported India.
If your locations panel reads "not known" for everything, one of two things is wrong:
- The reference data has not downloaded —
docker compose logs api | grep -i reference. - Your forwarded headers are not trusted, so every visitor looks like your own proxy. Revisit
TRUSTED_PROXY_NETWORKin Part 3.
Note that the panel ranks by visitors, not views. A single crawler hammering a thousand pages from one country does not make that country your biggest audience, and this ordering refuses to let it look like one. Towns, where shown, are described by the product as an estimate, because that is what they are.
What Your Readers Use
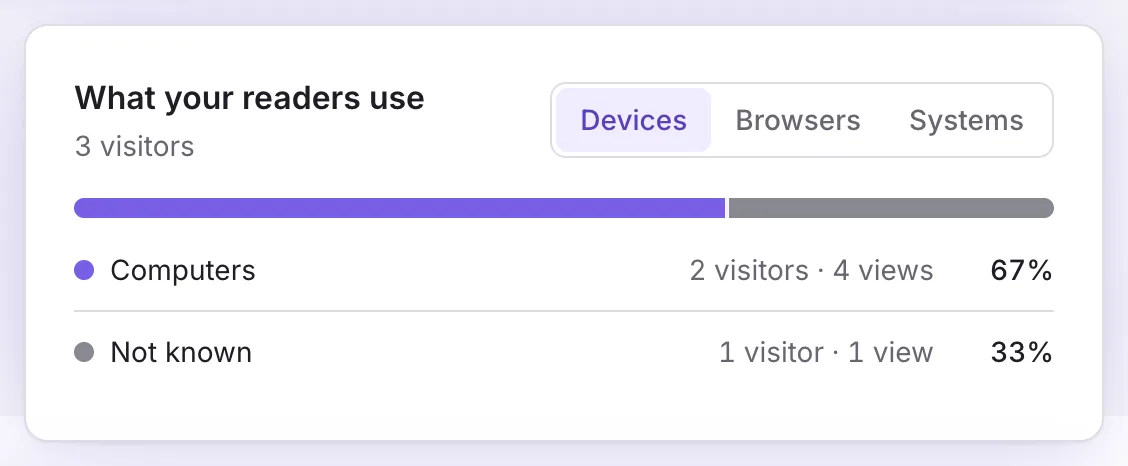
Computers    2 visitors · 4 views    67%
Not known    1 visitor  · 1 view     33%
Line those up against what I know was actually there, because the arithmetic is instructive:
- Computers, 2 visitors, 4 views — my real browser (one visitor, three pages) plus the
curlthat wore a fake ChromeUser-Agent(one visitor, one page). Claiming to be Chrome successfully got it counted as a computer. - Not known, 1 visitor, 1 view — the honest
curl, which said nothing about what it was.
"Not known" is a first-class answer here, not a rounding error. That request volunteered nothing, so it is reported as unknown rather than assigned to the most likely bucket.
That will look wrong the first time you see it, because other analytics products show a tidy pie with no unknown slice. They are not seeing more than this one; they are guessing — and on most sites the visits that volunteer nothing are precisely the visits that were never a person. A large "not known" share is a finding, not a defect.
Note also what the device panel could not do: it took the fake User-Agent at face value. Device detection is built from what a browser volunteers, and a liar can move itself between buckets. That is exactly why the classification panel further down does not rely on it.
Which Pages
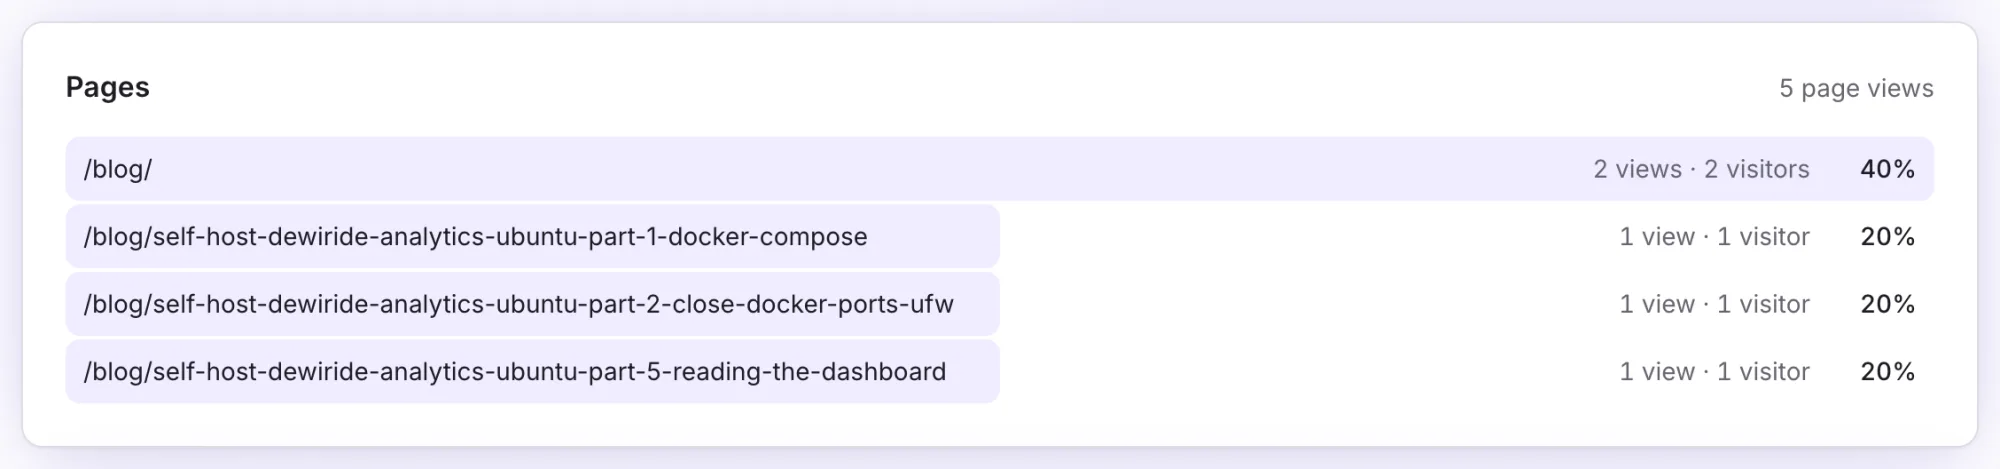
/blog/                                                          2 views · 2 visitors   40%
/blog/self-host-dewiride-analytics-ubuntu-part-1-docker-compose 1 view  · 1 visitor    20%
/blog/self-host-dewiride-analytics-ubuntu-part-2-close-...      1 view  · 1 visitor    20%
/blog/self-host-dewiride-analytics-ubuntu-part-5-reading-...    1 view  · 1 visitor    20%
Both curl requests carried a Referer of /blog/, which is why the listing page has two views from two visitors while each article has one view from one visitor. Paths are recorded, query strings are not kept unless you turn that on, and nothing here identifies who read what.
How Your Pages Are Read
This is the panel that separates this product from a hit counter.
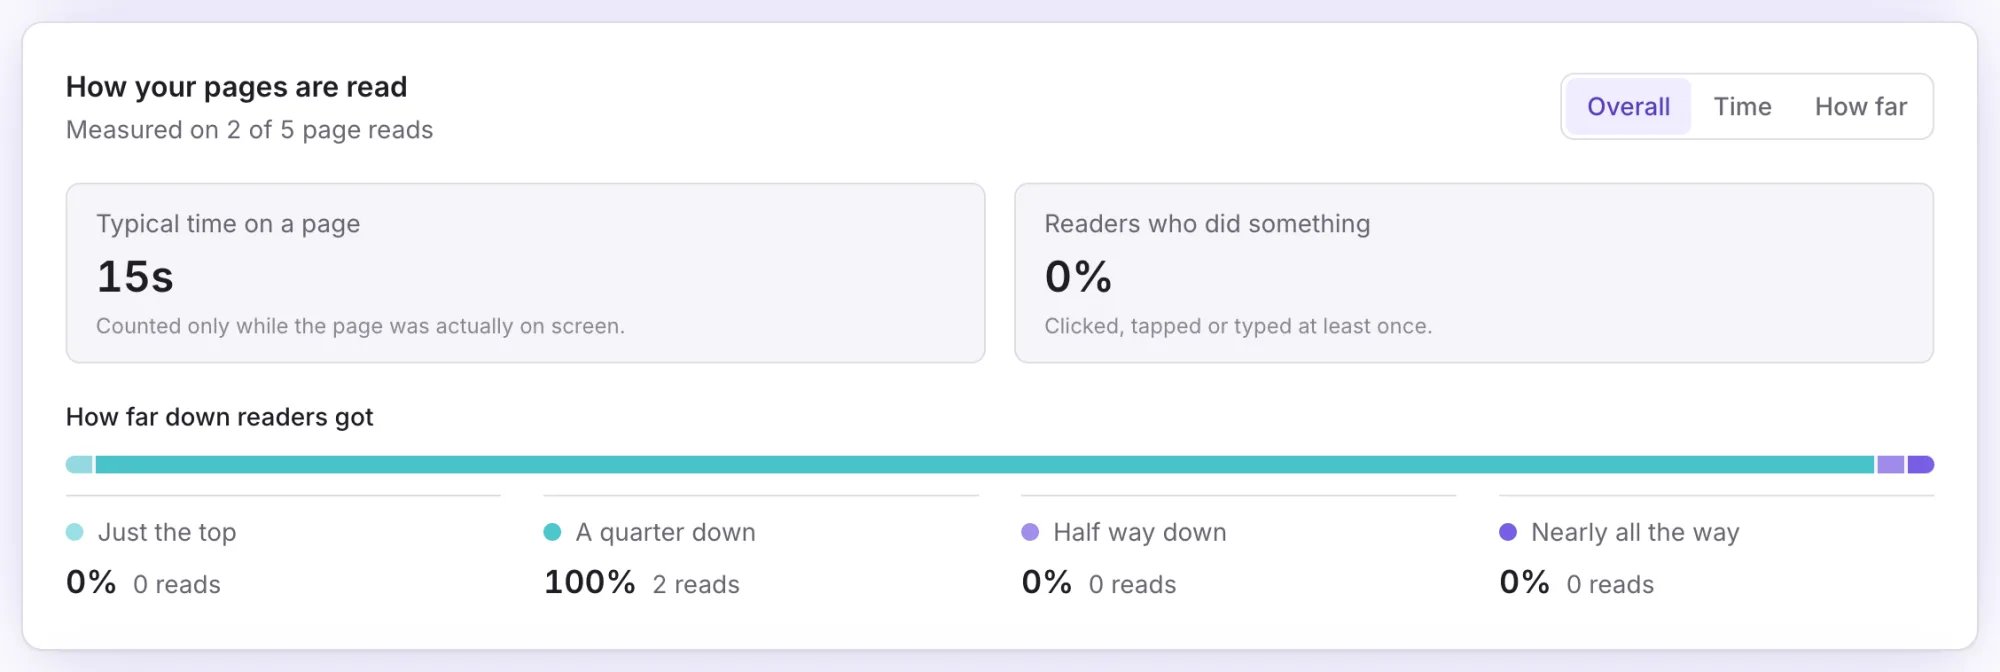
Typical time on a page      15s     Counted only while the page was actually on screen.
Readers who did something   0%      Clicked, tapped or typed at least once.

How far down readers got
  Just the top        0%    0 reads
  A quarter down    100%    2 reads
  Half way down       0%    0 reads
  Nearly all the way  0%    0 reads
"Measured on 2 of 5 page reads" is the most important line on the dashboard. It is the denominator, printed above the figures, and almost nothing else in this industry shows it.
Only a browser running the tracker can see engaged time or scroll depth. curl cannot, and neither can a crawler, a feed reader or an uptime monitor. So three of those five page views are simply not measurable — and rather than averaging them in as zeros, the panel states how many readings each figure was actually taken from.
The difference is not pedantic. A zero would say "they arrived and did nothing", which is a statement about your content. What this says is "nothing here was measurable", which is a statement about your traffic. Conflating the two is exactly how a site full of crawler hits comes to look like a site with a terrible bounce rate.
The other two figures are honest in the same way. Typical time 15s is "counted only while the page was actually on screen" — not wall-clock time on a background tab. Readers who did something: 0% is correct: I scrolled those pages but never clicked anything, and the product declines to call scrolling an interaction.
On a brand-new install, before any browser has run the tracker, this panel says "Nothing here could be measured" instead of showing zeros — and explains that this is normal for crawlers and for anything your own server reported. If you see that, nothing is broken; nothing measurable has arrived yet.

Who's Visiting
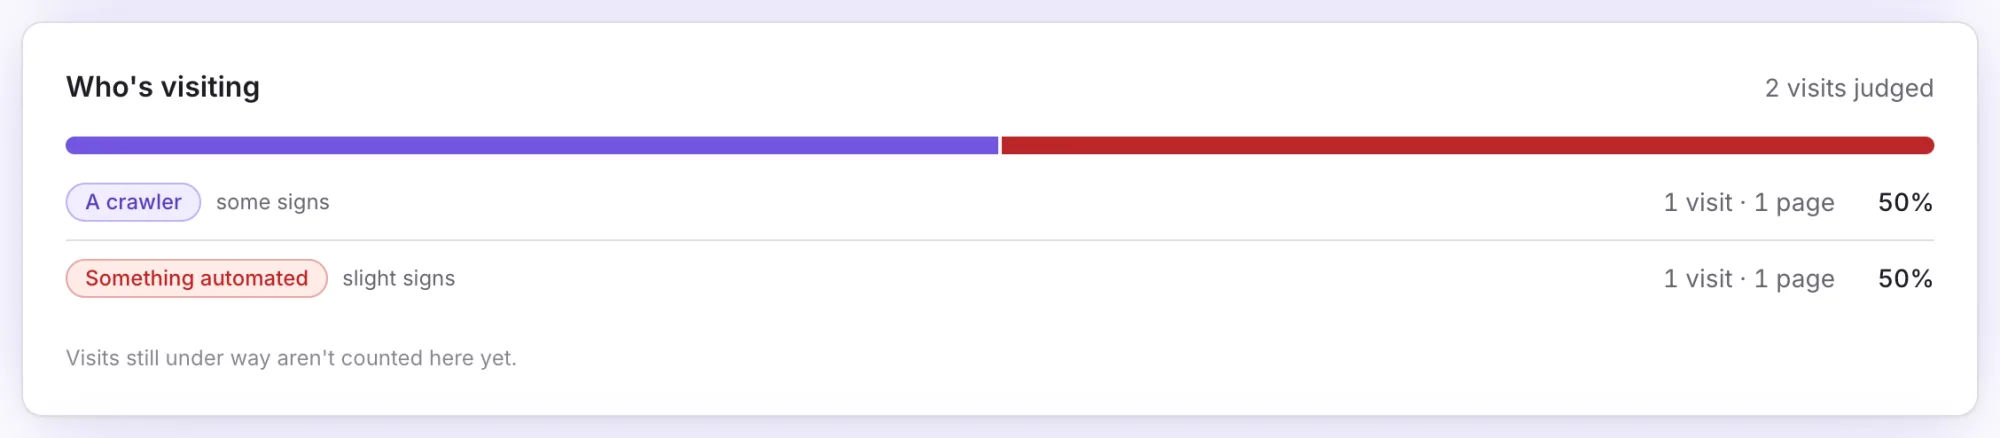
A crawler              some signs      1 visit · 1 page    50%
Something automated    slight signs    1 visit · 1 page    50%

Visits still under way aren't counted here yet.
Two things to notice, and both are deliberate.
There is no confidence percentage. Each verdict carries a strength band — "some signs", "slight signs" — rather than "87% likely a bot". The reason is honest: there is no labelled dataset of real internet traffic to calibrate a percentage against, so a number would look like a measurement while being an opinion. A band admits what it is.
Both curl requests were caught, including the one pretending to be Chrome — the same request the device panel happily filed under "Computers".
Why this panel says 2 while the top of the page says 5
You will notice the totals disagree, and the dashboard tells you why in two places: "Visits still under way aren't counted here yet", and elsewhere, that a visit is judged once it has finished — with the first verdicts appearing about half an hour after a visit ends.
My browser session was minutes old when this was captured, so it had not been judged. The two curl hits, made much earlier, had.
A visit still in progress has not decided how many pages it will read or how long it will stay. Judging it now would mean judging on incomplete evidence and then revising the answer, which is worse than waiting. So: headline totals are live; classification trails by roughly half an hour. An empty "Who's visiting" panel on a fresh install is not a fault.
The same applies to "How people move through your site", which counted "2 visits that have finished" — entry pages, exit pages, pages per visit, and how many visits read one page and left. Its note reads "Counted per sitting, not per person", making the visit-versus-visitor distinction explicit.
Opening a Visit: the Evidence
Click a visit and it opens. This is where the product stops summarising and shows its working.
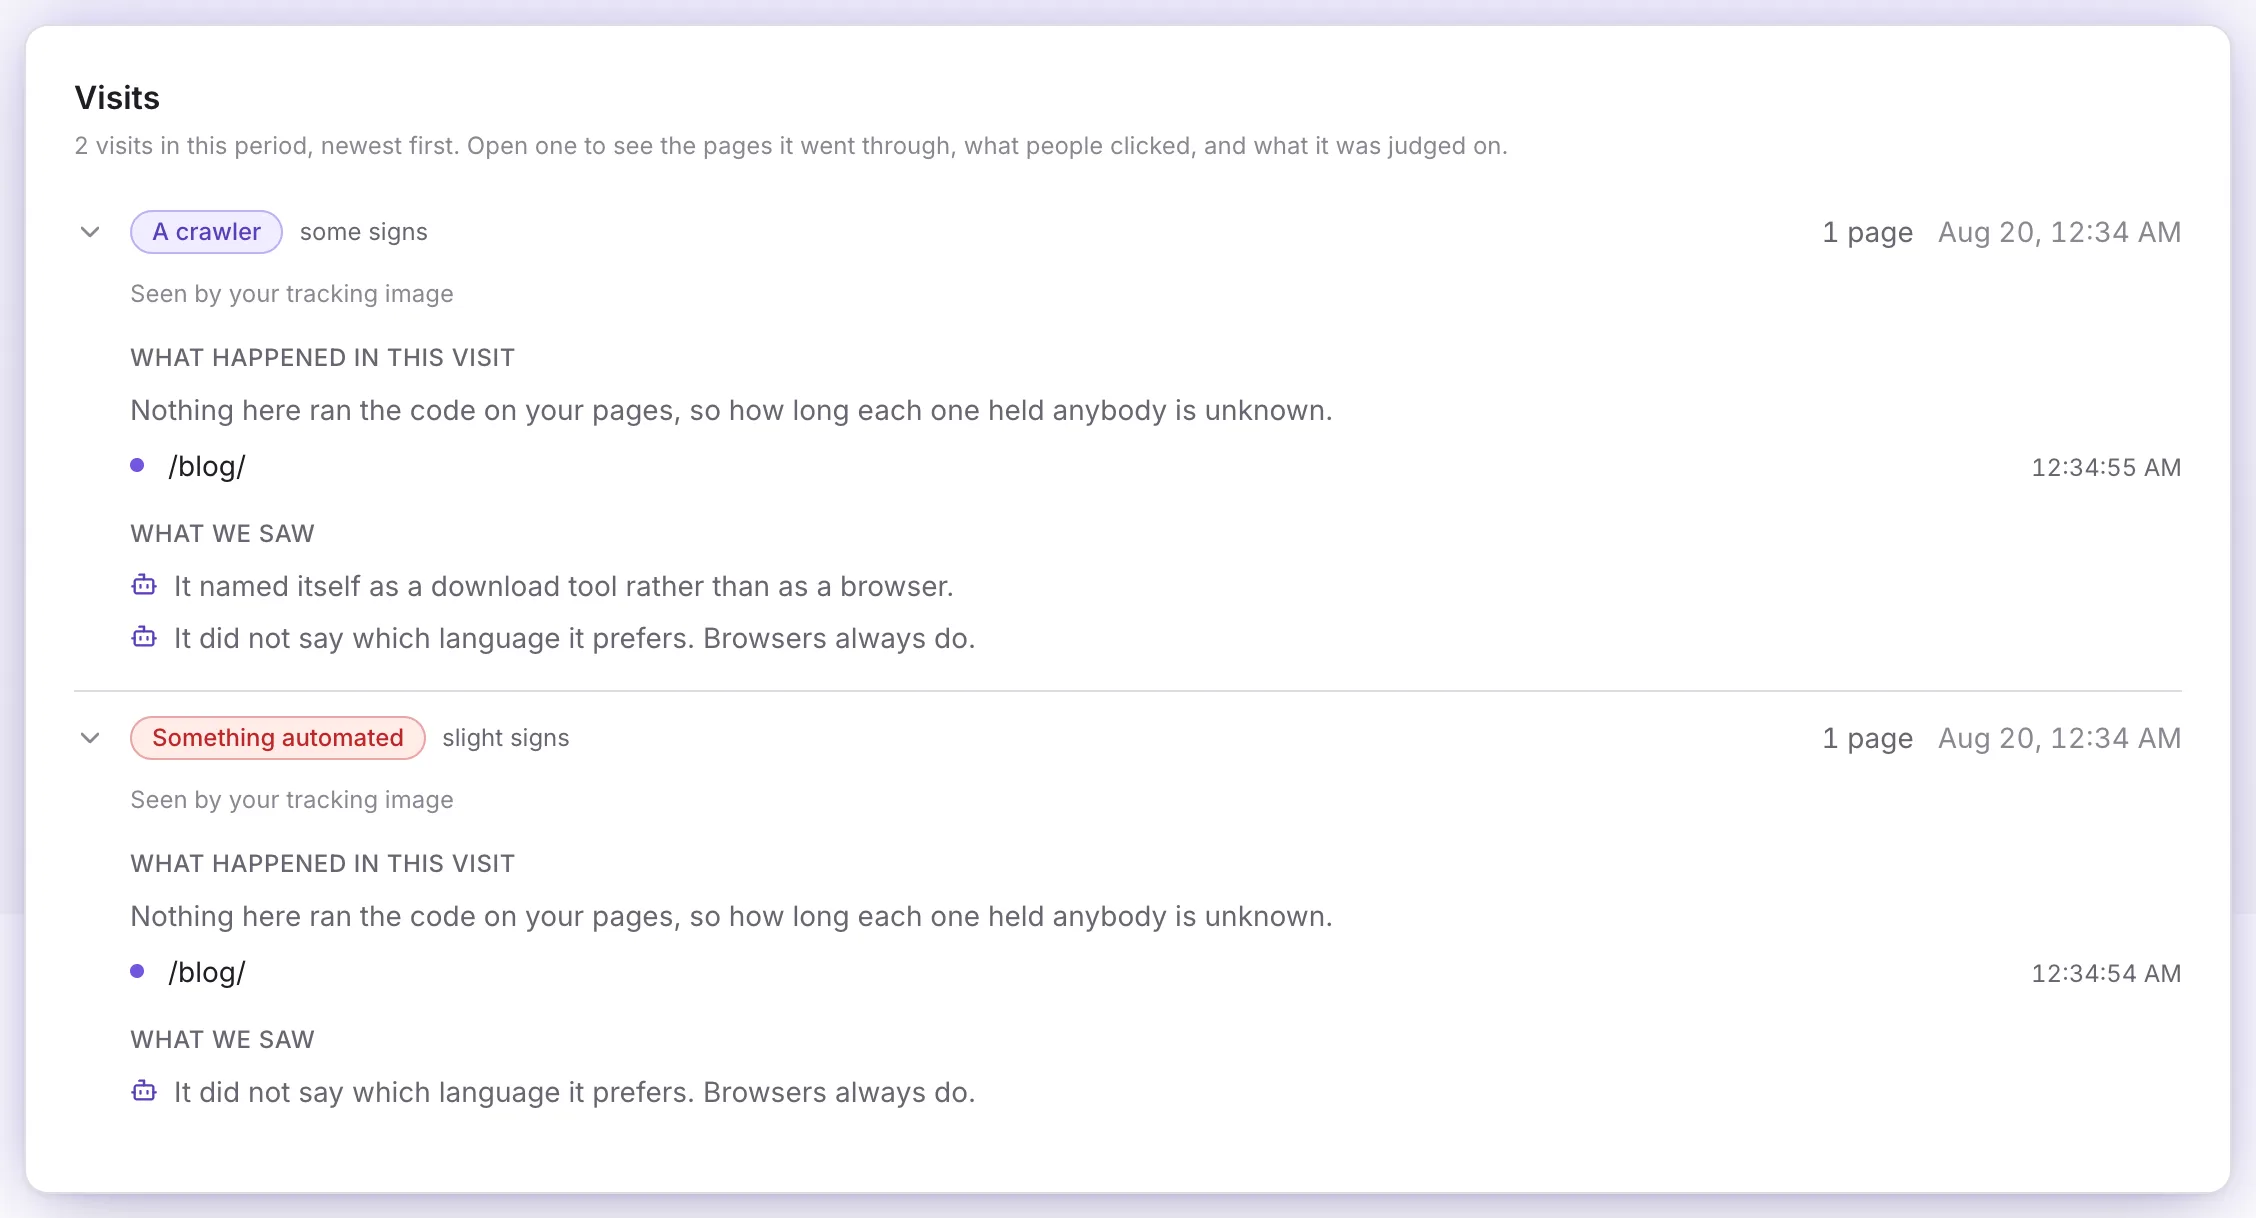
Seen by your tracking image

WHAT HAPPENED IN THIS VISIT
Nothing here ran the code on your pages, so how long each one held anybody is unknown.
  /blog/                                                          12:34:55 AM

WHAT WE SAW
  It named itself as a download tool rather than as a browser.
  It did not say which language it prefers. Browsers always do.
WHAT WE SAW
  It did not say which language it prefers. Browsers always do.
Compare those two, because the difference is the whole point.
The first was plain curl, which announces itself honestly. Two observations applied, and the verdict was the more specific "A crawler" at "some signs".
For the second I sent a fake Chrome User-Agent — the exact string a real browser sends. That removed the first observation entirely; by name alone, it was Chrome.
It was still caught. The second observation held: a real browser always sends an Accept-Language header saying which language it prefers, and curl does not. So the verdict became the vaguer "Something automated" at the weaker "slight signs".
That is precisely the behaviour you want. Lying about your User-Agent degrades the confidence rather than defeating the detection, and the product reports the lower confidence honestly instead of pretending it was equally sure. Compare that with the device panel two sections up, which the same lie fooled completely.
Note also "Seen by your tracking image" — the surface the observation arrived on, the <noscript> pixel from Part 4 rather than the script. Every event records how it was seen, so a verdict can be read against what that surface was capable of seeing.
Every observation is a written sentence, not a rule code. That is a deliberate constraint, and it is what makes a verdict arguable. "Bot score: 0.83" cannot be disagreed with. "It did not say which language it prefers" can be checked — and if it is wrong, you can say so.
What This Dashboard Refuses to Do
| Not there | Why |
|---|---|
| A confidence percentage | No labelled dataset exists to calibrate one, so it would be an opinion dressed as a measurement |
| Unique visitors over a month | Would need a durable identifier; the recognition key is rotated daily on purpose |
| A guess where data is missing | "Not known" is shown as an answer rather than filled in with the likeliest value |
| Averages over unmeasurable reads | The denominator is printed instead — "measured on 2 of 5" |
| A confirmed crawler identity | Until a crawler's address is checked against what its operator publishes, its name is only a claim — so recognised crawlers read as suspected |
That last row is the most interesting, and the project is explicit that the verification is not built yet. A product that wanted to look finished would print "Googlebot" and move on.
Common Mistakes
| Mistake | What happens | Fix |
|---|---|---|
| Reading "not known" as a bug | You hunt a fault that is not there | It means the visit volunteered nothing — usually because it was not a person |
| Expecting classification immediately | The panel looks broken on a new install | Visits are judged after they finish, about half an hour later |
| Trusting the device panel to spot bots | A faked User-Agent lands in "Computers" | That is what the classification panel is for |
| Comparing totals with another product | The numbers will not match | Others count requests; this counts delivered pages and separates automation out |
| Treating daily visitors as monthly uniques | You overstate your audience | A returning reader counts again the next day, as the panel says |
| Panicking at a high bot share | It looks like your traffic collapsed | It did not change; you can now see what it always was |
Troubleshooting
| Symptom | Likely cause | What to do |
|---|---|---|
| Every country reads "not known" | Reference data missing, or forwarded headers untrusted | docker compose logs api | grep -i reference, then check TRUSTED_PROXY_NETWORK |
| Engagement says nothing could be measured | Only the pixel or a server reporter is measuring — no script is running | Confirm dw.js loads on your pages, not just the <noscript> image |
| "Who's visiting" stays empty | No visit has finished yet | Wait about half an hour after a visit ends |
| Measured-on figure much lower than page views | Most of your traffic runs no JavaScript | That is the finding, not the fault |
| Page views climb, visitors do not | One visitor reading many pages, or one crawler | Open the visits list and see what was judged |
| Dashboard panels error | ClickHouse concurrency ceiling | The override in Part 4 |
FAQ
Why are my numbers lower than Google Analytics? Usually because they are more honest, in two ways: automation is separated out rather than counted as visitors, and a page delivered is counted once rather than once per report.
Is a high proportion of bots a problem? It is a fact about the internet, not a problem with your site. Search crawlers and AI agents are a growing share of all traffic. Knowing the split is the point.
Can I exclude my own visits? Not with a setting today. The practical approach on small numbers is to know which visits are yours — as this part does openly.
What is the difference between a visit and a visitor? A visitor is a person-shaped thing seen in a day. A visit is one sitting. One visitor can produce several visits; the journeys panel counts sittings and says so.
Why does a visit show pages but no time on them? Because nothing ran the script on those pages. Time and scroll depth are browser-only measurements, and the panel says "unknown" rather than "0 seconds".
Can I see an individual person's history? No, and not by omission. The recognition key is rotated daily and raw addresses are dropped after 72 hours, so there is nothing to join across days.
How far back does the data go? As far as you have been collecting. There is no retention limit in the self-hosted version — the limit is your disk.
Conclusion
The most valuable line on this dashboard was not a number. It was "Measured on 2 of 5 page reads" — the denominator, printed above the figures, telling you how much of your traffic could be measured at all before it tells you anything about it.
And a request wearing a fake Chrome User-Agent fooled the device panel completely while being caught by the classification engine anyway, on honestly reduced confidence, with the reason written out in a sentence you can argue with.
That is the case for running this yourself: not that the numbers are bigger, but that you can see why they are what they are — and read the code that produced them.
One thing remains: keeping it running, backed up, and updatable.
← Previous: Part 4: Claim the Install and Add Your First Website Next: Part 6: Backups, Updates and Day-2 Operations →
