Self-Host Dewiride Analytics on Ubuntu Server — Part 4: Claim the Install and Add Your First Website

Your installation is running on a real domain with a padlock, and it belongs to nobody. This part claims it with the one-time owner screen, adds your first website, and gets the tracking code onto a real site — plus the origin rule that quietly explains why nothing appears when you test on localhost.
This is Part 4 of a 6-part series.
- Part 1: Run the Stack with Docker Compose
- Part 2: Close the Ports Docker Opened Behind Your Firewall
- Part 3: Custom Domain and Free HTTPS with Caddy
- Part 4: Claim the Install and Add Your First Website (you are here)
- Part 5: Read the Dashboard — Humans, Bots and Engagement
- Part 6: Backups, Updates and Day-2 Operations
Step 1: Claim the Installation
Open your domain in a browser. Because nobody has an account yet, you get a one-time welcome screen instead of a sign-in form.
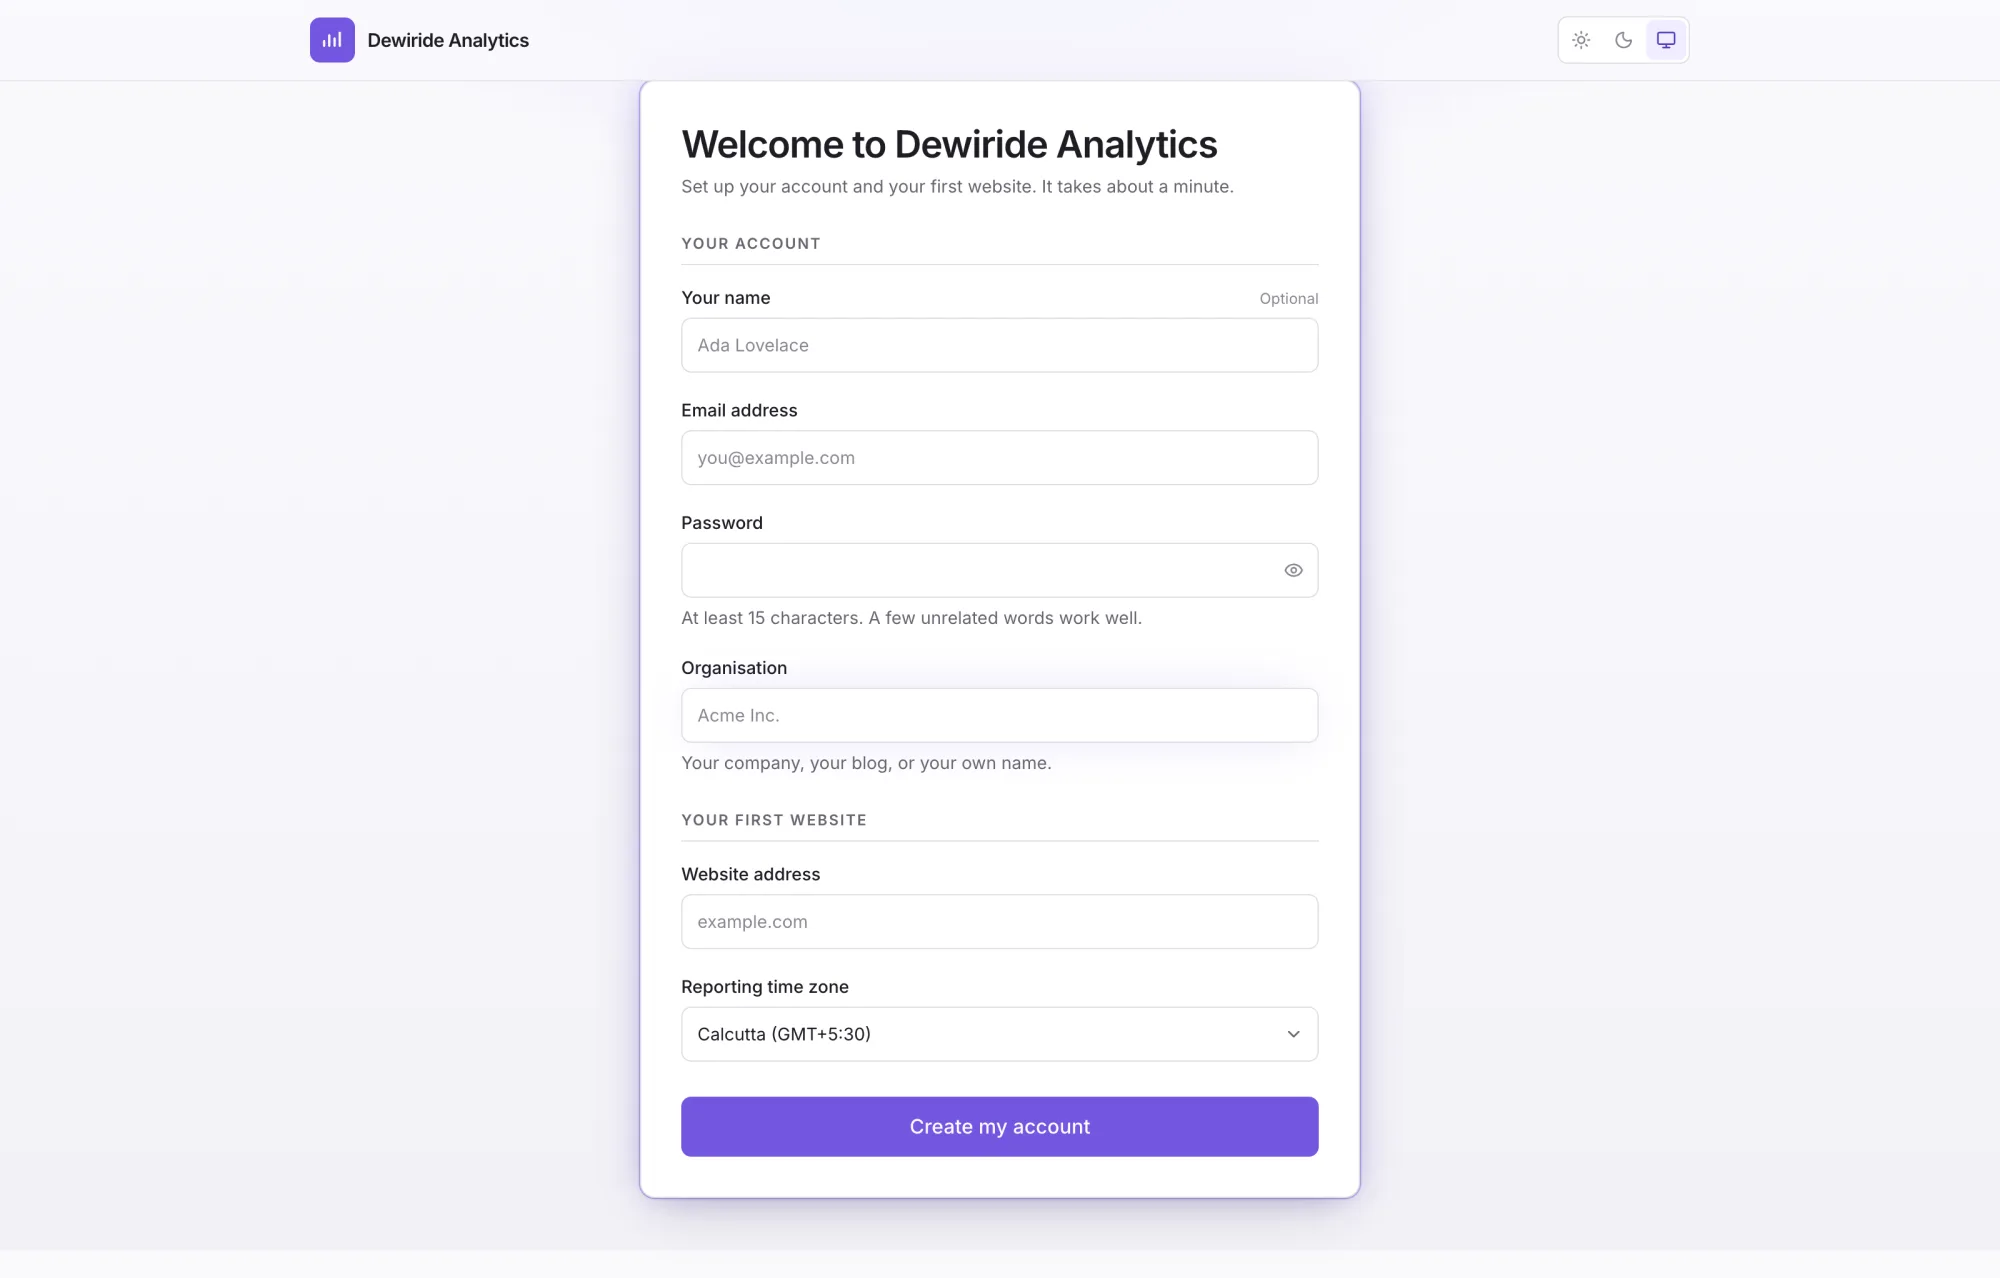
This screen is offered exactly once and can never be used again. The first person to fill it in becomes the owner of the installation. It takes a database lock while it runs, so two people arriving at the same moment cannot both win.
If your installation is reachable on the internet — and after Part 3 it is — then between the moment Caddy got its certificate and the moment you fill this in, anyone who guesses the address can claim your analytics server. Do this now, not tomorrow.
Six fields, and three of them deserve a sentence.
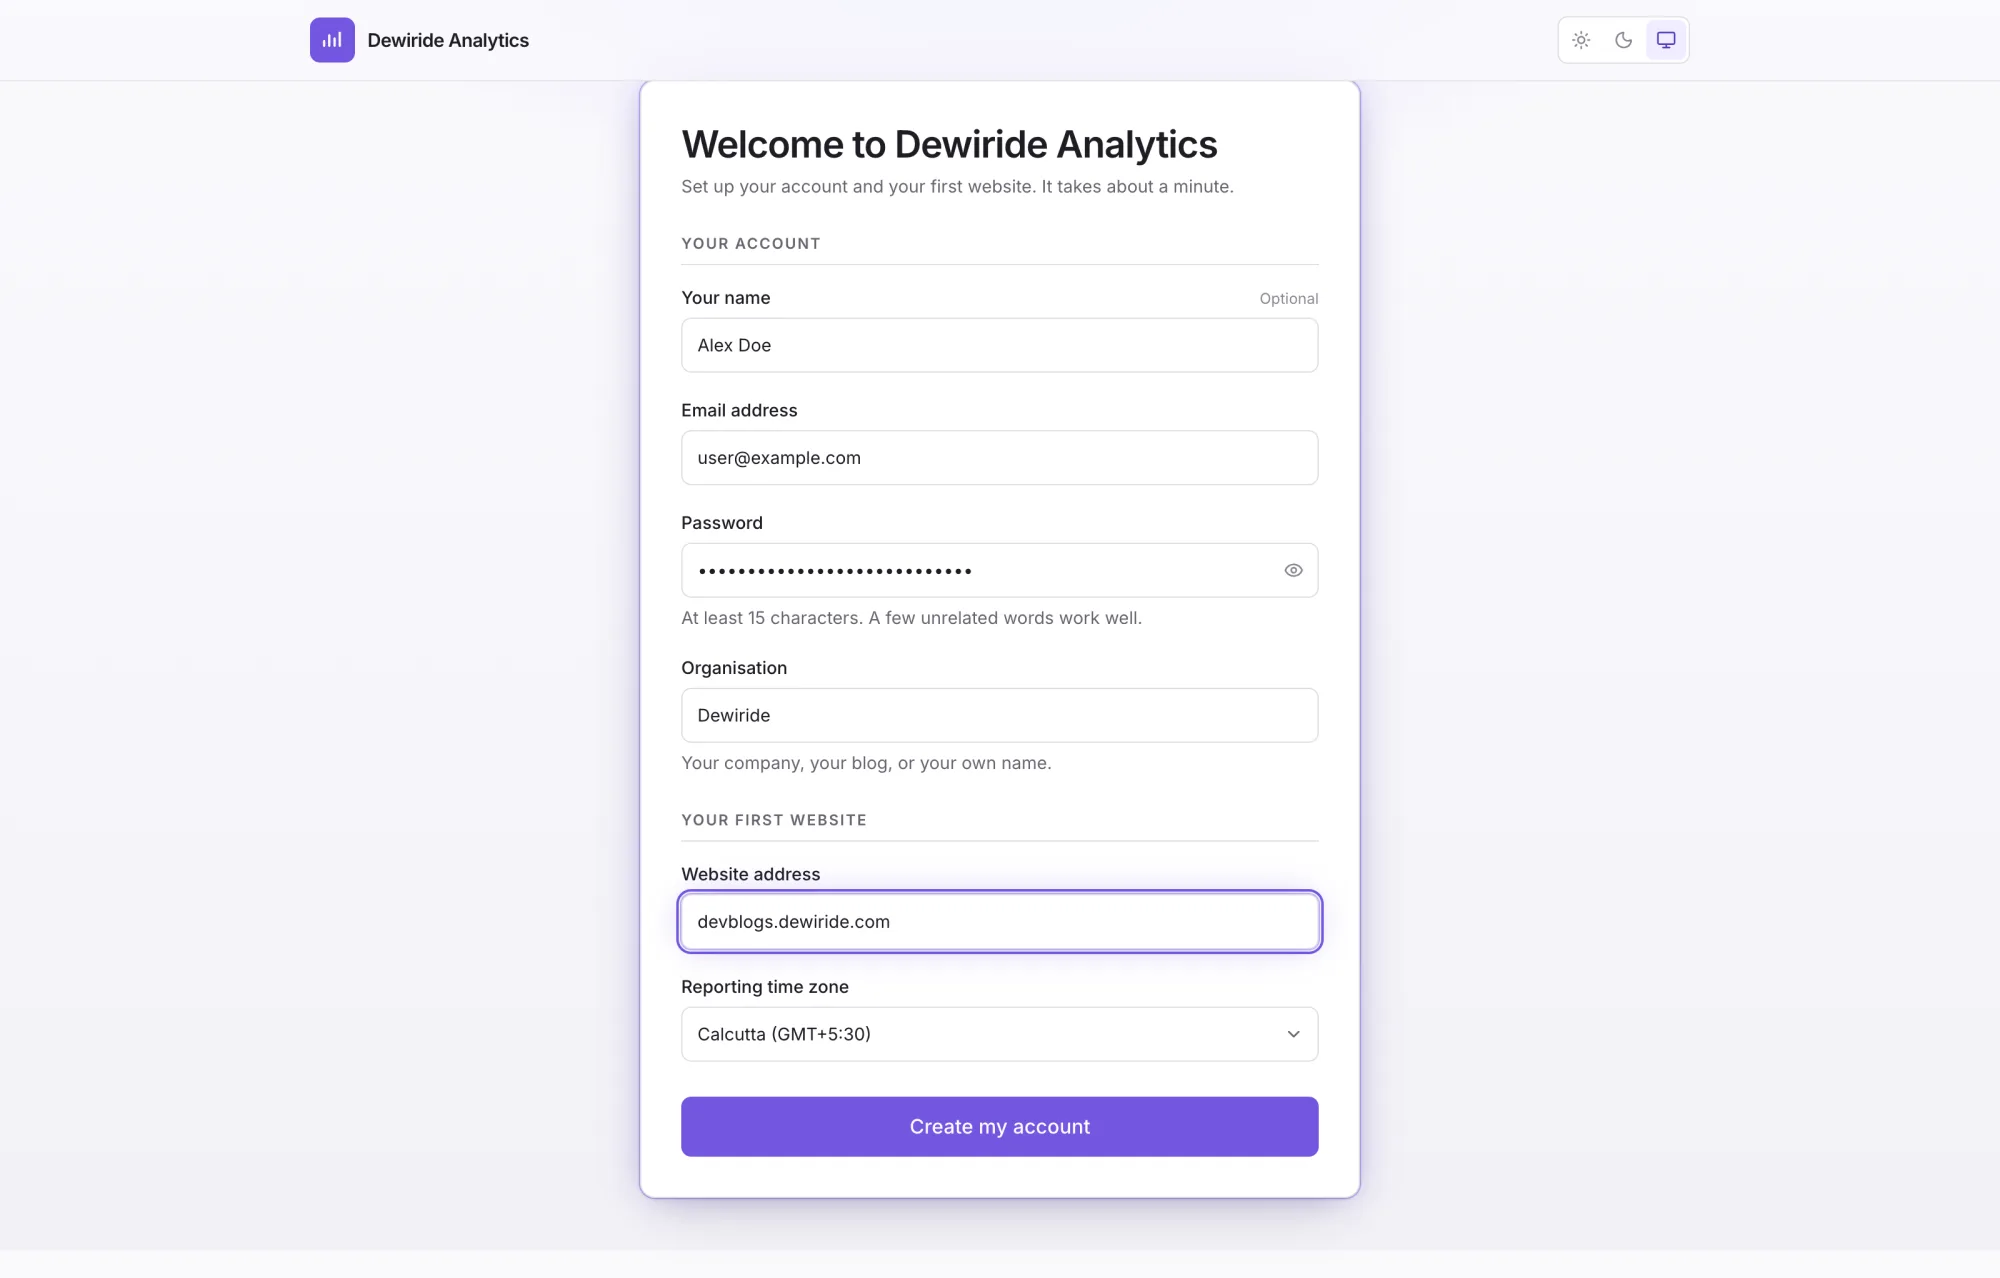
Password — at least 15 characters. The hint suggests "a few unrelated words", and that is genuinely better advice than a short string of symbols. A passphrase of four ordinary words is both easier to remember and harder to attack than P@ssw0rd!. Use a password manager if you have one.
Organisation. Your company, your blog, or your own name. One installation can hold several organisations, and websites belong to an organisation rather than to you personally — which is what makes it possible to hand a site to a colleague later.
Reporting time zone. This decides where a "day" starts for every figure on the dashboard. Pick the zone you read reports in, not the one your server happens to sit in — the server's location is an accident of hosting. Mine ran in Germany and reports in India.
You may notice the list offers Calcutta (GMT+5:30) rather than Kolkata. That is not a typo in the product — it is the name in the IANA time-zone database, where Asia/Calcutta is the original identifier and Asia/Kolkata is an alias. Several other cities appear under older names for the same reason.
Fill it in and press Create my account. You are signed in as the owner, and your first website already exists.
Step 2: Meet the Empty Dashboard
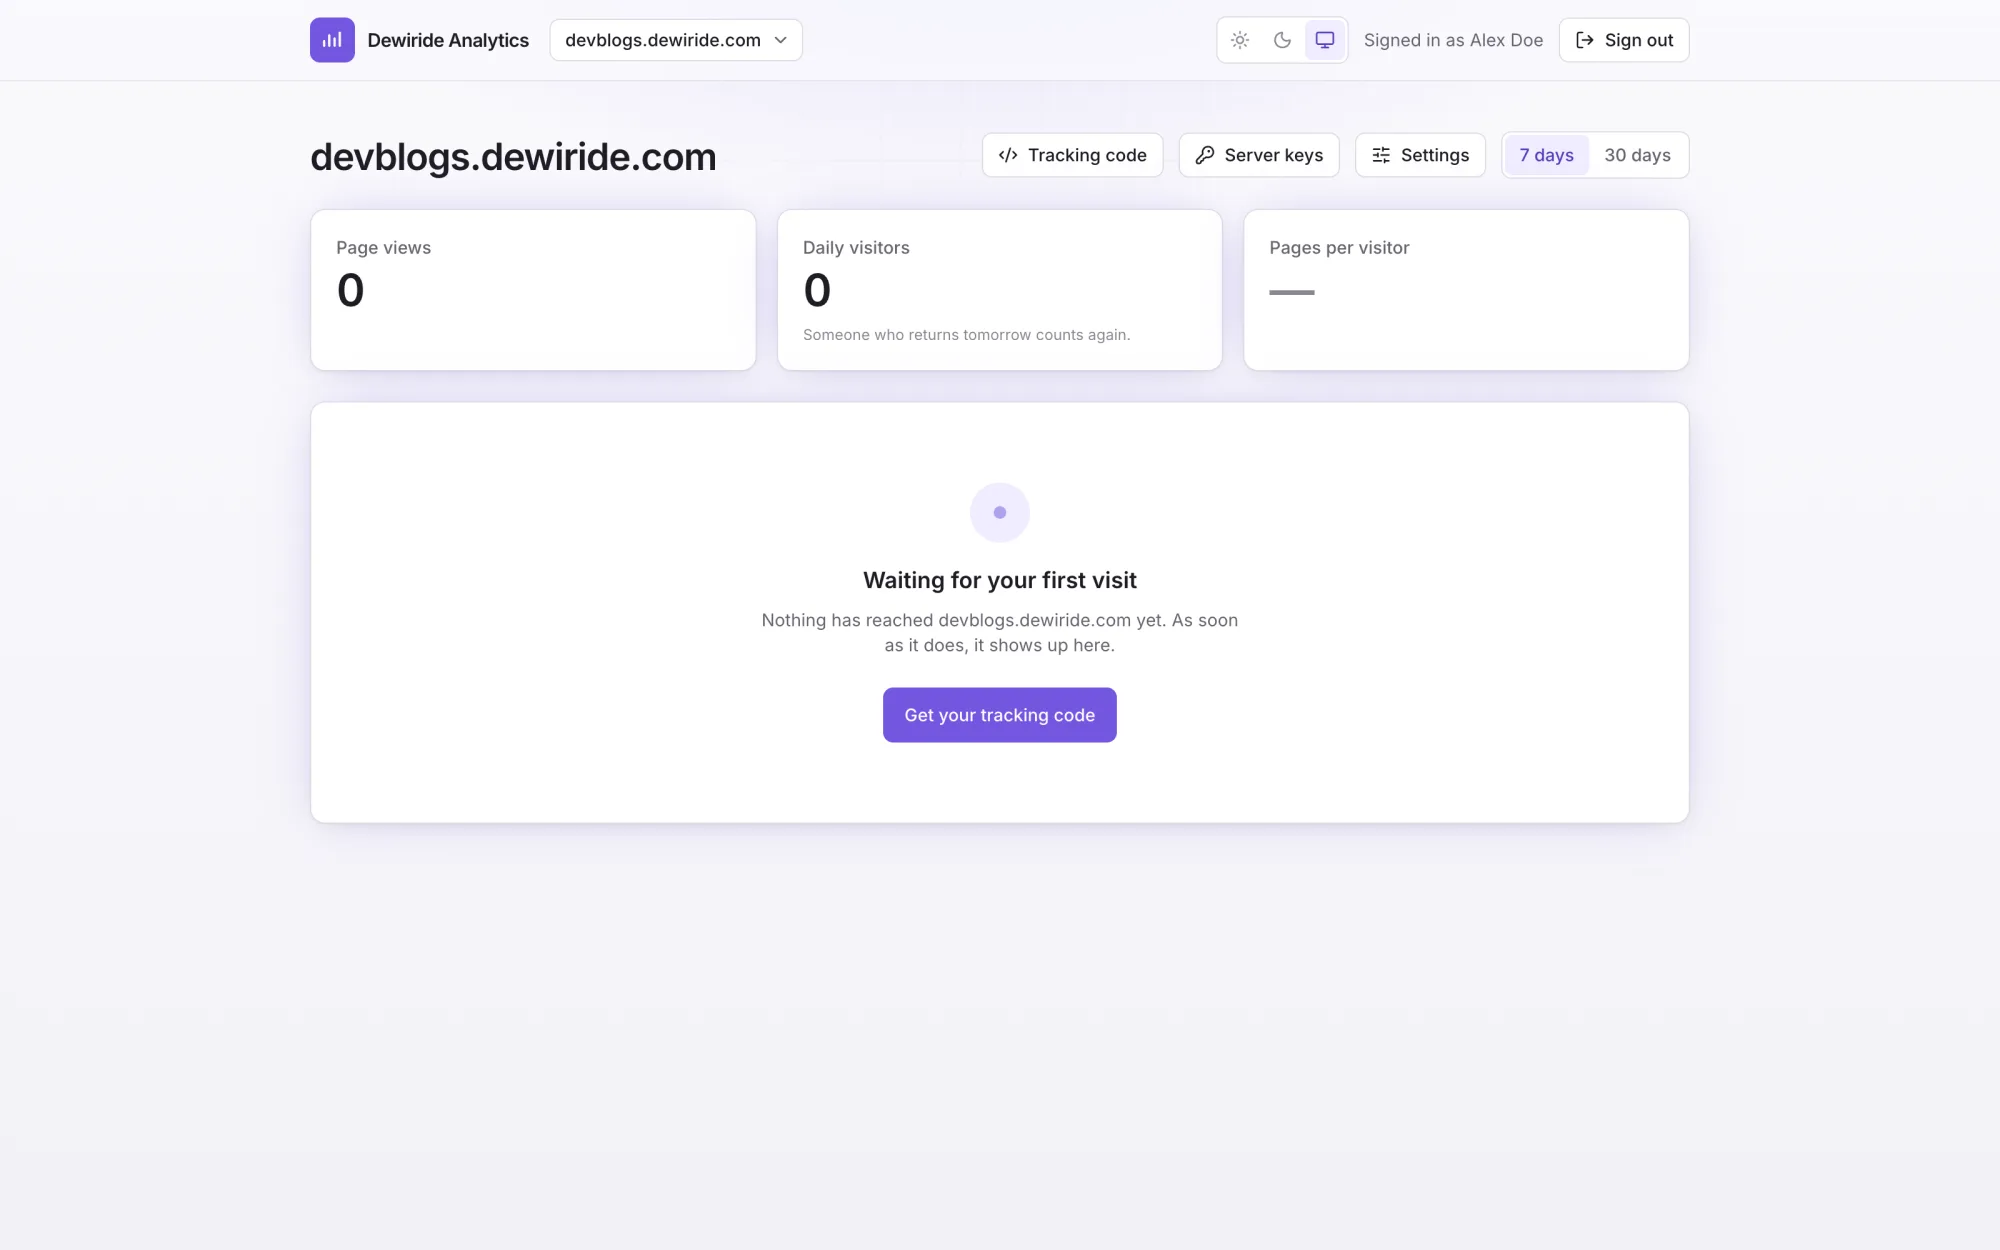
Zeros everywhere, and a panel that says "Nothing has reached your site yet. As soon as it does, it shows up here."
That is the correct state. It is also worth pausing on, because an empty analytics dashboard is the only time you can be certain that what you are about to see is real.
If some panels say "Something went wrong"
On a small server you may find three or four panels showing an error while the rest work. The server is healthy; the panels are being refused.
docker compose logs api | grep -i "TOO_MANY_SIMULTANEOUS"
Code: 202. DB::Exception: Too many simultaneous queries. Maximum: 8. (TOO_MANY_SIMULTANEOUS_QUERIES)
The dashboard draws each panel from its own query and asks for all of them at once — which is more than eight. The tuning the project ships is written for a laptop and caps concurrency at eight, so the surplus is rejected outright.
Raise it with a file of your own rather than editing the shipped tuning:
mkdir -p ~/dewiride-analytics/local
nano ~/dewiride-analytics/local/clickhouse-concurrency.xml
<?xml version="1.0"?>
<clickhouse>
  <max_concurrent_queries>32</max_concurrent_queries>
</clickhouse>
Then mount it by adding a volumes entry to the clickhouse service in the compose.prod.yaml you wrote in Part 2:
  clickhouse:
    ports: !reset []
    # Mounted alongside the shipped tuning rather than replacing it, so a later git pull still
    # brings the rest of it. Compose merges volume lists by target path, so a path the main file
    # does not use keeps both mounts. The zz- prefix makes it merge last.
    volumes:
      - ./local/clickhouse-concurrency.xml:/etc/clickhouse-server/config.d/zz-concurrency.xml:ro
docker compose up -d --wait
Concurrency is not the same as memory here — max_threads is still 2 and max_memory_usage still 1 GB per query, so this permits more small questions at once, not bigger ones. Reload the dashboard and the panels fill in.
Step 3: Get Your Tracking Code
On the dashboard, choose Tracking code.
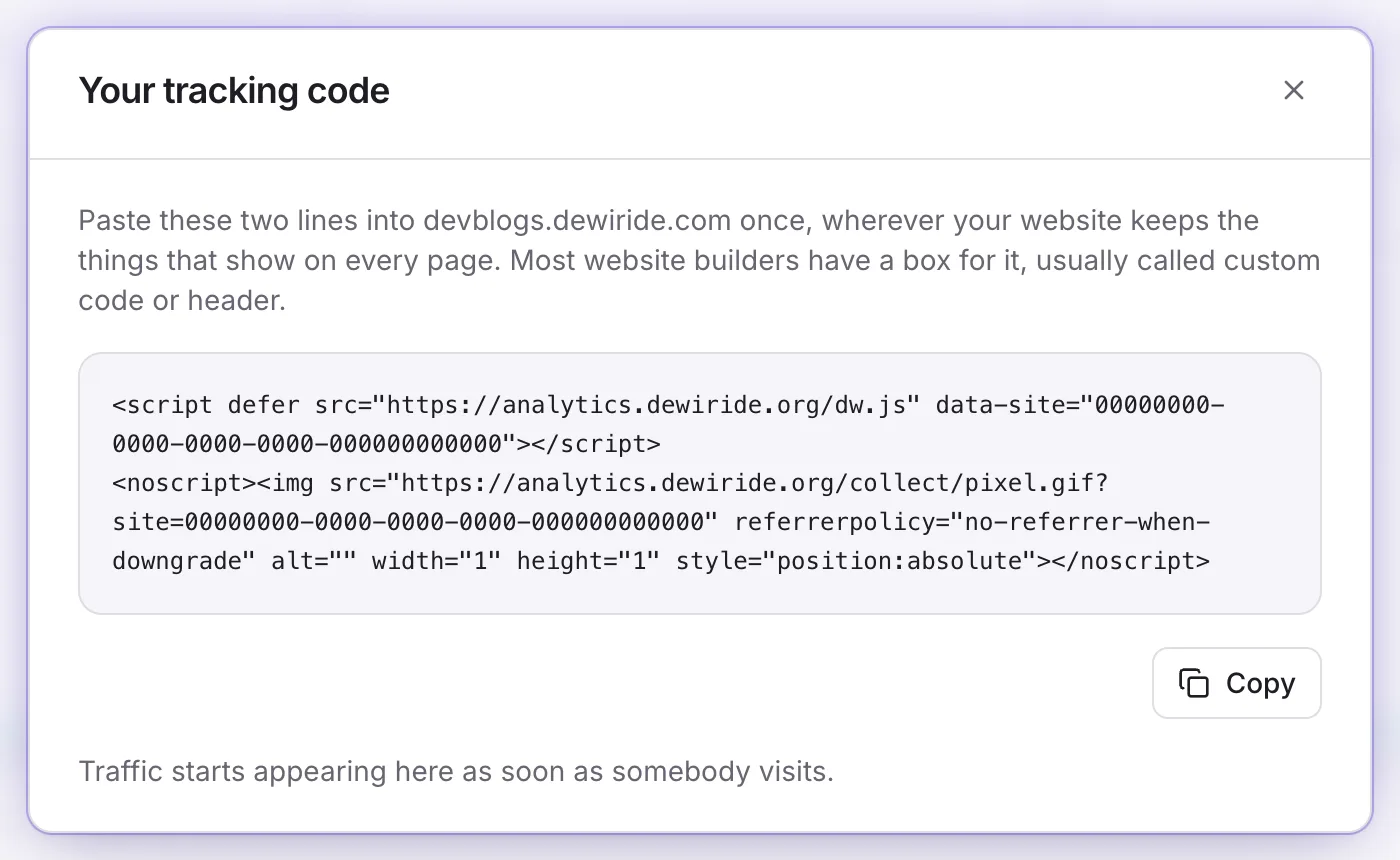
Two lines, with your own address and your own site identifier already filled in:
<script defer src="https://analytics.example.com/dw.js" data-site="YOUR_SITE_ID"></script>
<noscript><img src="https://analytics.example.com/collect/pixel.gif?site=YOUR_SITE_ID" referrerpolicy="no-referrer-when-downgrade" alt="" width="1" height="1" style="position:absolute"></noscript>
Use the identifier your own dashboard shows you, not one copied from a screenshot or a guide. Paste somebody else's and your traffic is filed under their website.
The first line is the tracker. defer means the browser downloads it alongside the page but does not run it until the HTML is parsed, so it never delays anything a reader is waiting for. On the installation described here it is 4,299 bytes — small enough that the argument about analytics slowing pages down does not really apply.
The second line is the fallback for browsers that run no JavaScript at all. An image request needs no script, so a reader with scripting disabled still counts as a page view — though naturally without the things only a script can see, like how far down they scrolled.
referrerpolicy="no-referrer-when-downgrade" lets the page that the image sits on be reported, which is how the fallback knows which page was viewed — while declining to leak it if the connection is ever downgraded to plain HTTP.
The site identifier is not a secret. It is printed in the page source of every page it measures; anybody can read it. What stops a stranger writing traffic into your site is the origin rule further down this page, not the secrecy of an identifier that is by definition public.
Step 4: Put It on Your Website
Most site builders have a box for exactly this, usually called custom code, header scripts, or head HTML. Paste both lines there and you are finished.
If you run a static site generator, it is a configuration change instead. Here is the real one from the site you are reading, which runs on Docusaurus.
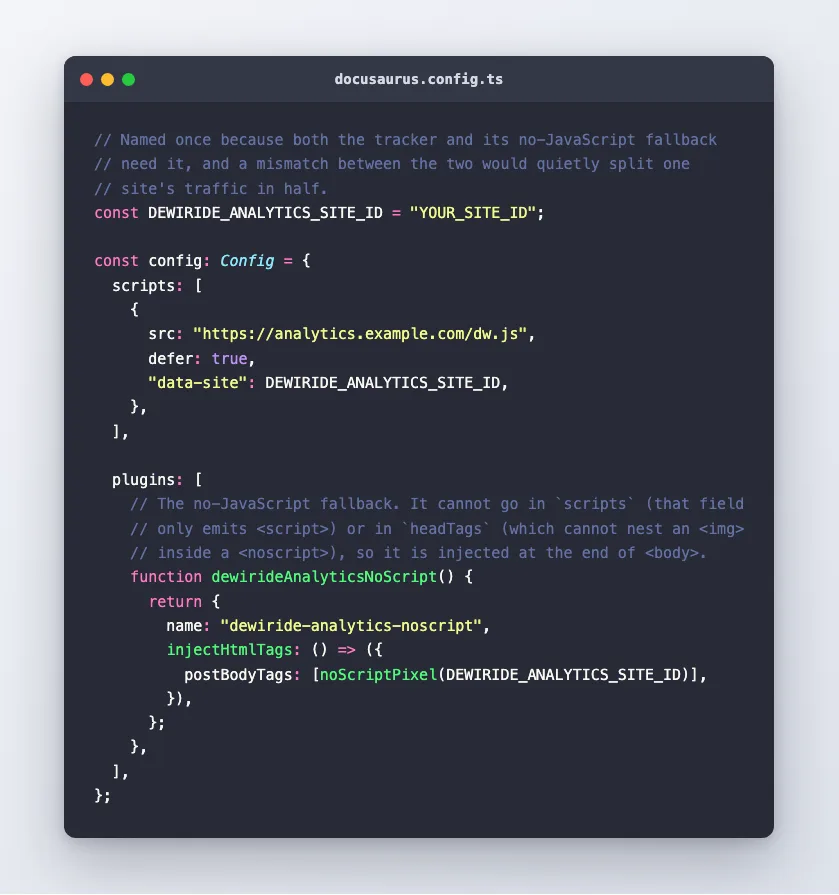
// Named once because both the tracker and its no-JavaScript fallback need it, and a mismatch
// between the two would quietly split one site's traffic in half.
const DEWIRIDE_ANALYTICS_SITE_ID = "YOUR_SITE_ID";

const config: Config = {
  scripts: [
    {
      src: "https://analytics.example.com/dw.js",
      defer: true,
      "data-site": DEWIRIDE_ANALYTICS_SITE_ID,
    },
  ],

  plugins: [
    // The no-JavaScript fallback. It cannot go in `scripts` (that field only emits <script>) or
    // in `headTags` (which takes a single tag with attributes and cannot nest an <img> inside a
    // <noscript>), so it is injected as raw markup at the end of <body>.
    function dewirideAnalyticsNoScript() {
      return {
        name: "dewiride-analytics-noscript",
        injectHtmlTags() {
          return {
            postBodyTags: [
              `<noscript><img src="https://analytics.example.com/collect/pixel.gif?site=${DEWIRIDE_ANALYTICS_SITE_ID}" referrerpolicy="no-referrer-when-downgrade" alt="" width="1" height="1" style="position:absolute"></noscript>`,
            ],
          };
        },
      };
    },
  ],
};
Two details worth stealing regardless of your framework:
- The identifier is a named constant. Both lines need it, and typing it twice is how one site ends up as two half-populated ones.
- The
<noscript>needs a different mechanism from the script. Docusaurus'sscriptsfield only emits<script>elements, andheadTagstakes a single tag with attributes and cannot nest an<img>inside a<noscript>. A four-line inline plugin usinginjectHtmlTagshandles it.
Build, and check that both lines actually made it into the output:
yarn build
grep -c 'dw\.js' build/index.html
grep -rl 'dw\.js' build --include='*.html' | wc -l
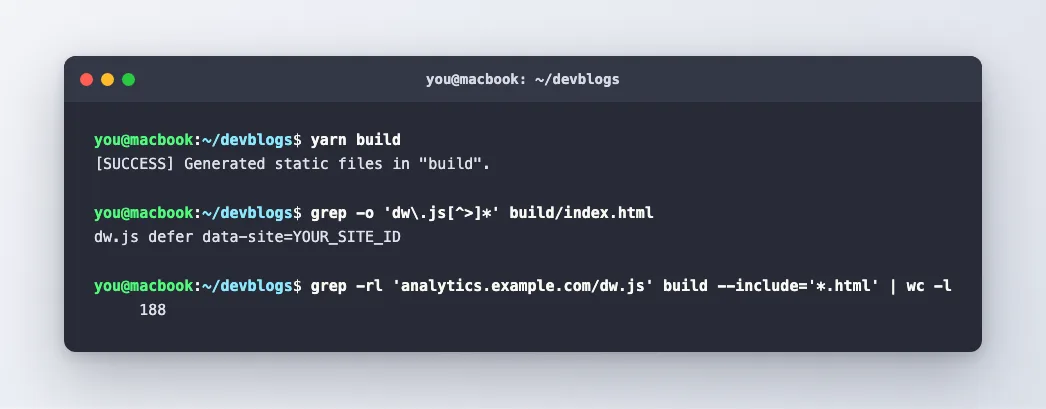
The second number should be the number of pages your site has — 188 in this case. If it is 1, your script is only on the home page and something is injecting it per-page rather than site-wide.
Then deploy however you normally do. Traffic appears on the dashboard within seconds of the first real visit.
Why Nothing Appears When You Test on localhost
This one costs people an hour, so here it is directly.
You add the tracking code, run your site locally, click around, and the dashboard stays at zero. The script is loading — you can see it in the network tab — and the events are being sent. They are simply being thrown away at the other end.
The engine checks where a report came from before accepting it:
var candidate = NormalizeHost(requestOrigin) ?? NormalizeHost(urlHost);

if (site.AllowedOrigins.Length > 0)
{
    return site.AllowedOrigins.Any(allowed => HostMatches(candidate, allowed));
}

return HostMatches(candidate, site.Domain);
Your browser sends Origin: http://localhost:3000, so the candidate is localhost. Your site is registered as example.com. Those do not match, and the event is dropped without ceremony.
That check is the thing protecting you. The site identifier is public, so without it anyone who viewed your page source could write whatever traffic they liked into your account. A site accepts its own hostname and any subdomain of it, and nothing else.
There is an allow-list in the data model for adding extra origins, but at the time of writing nothing in the product sets it — there is no endpoint and no screen for it, so you cannot currently permit localhost this way.
The practical answer is to add a second website whose address is localhost and use that site's identifier while developing. It costs nothing, it keeps your real numbers clean, and you can remove it when you are done.
The same rule explains a subtler case: if you serve your site on both example.com and www.example.com, register the one without www. Subdomains of a registered domain are accepted, so www.example.com matches a site registered as example.com — but not the other way round.
Server Keys: The Traffic a Browser Can Never See
There is a second way to report, and it is the reason this product exists.
A crawler asks for your page, reads the markup, and stops. It never runs the script, so as far as the tracker is concerned it was never there. The same is true of feed readers, uptime monitors, link previewers, AI retrieval agents, and every security scanner probing for /.env.
Anything sitting in the request path does see them. That is what a server key is for.
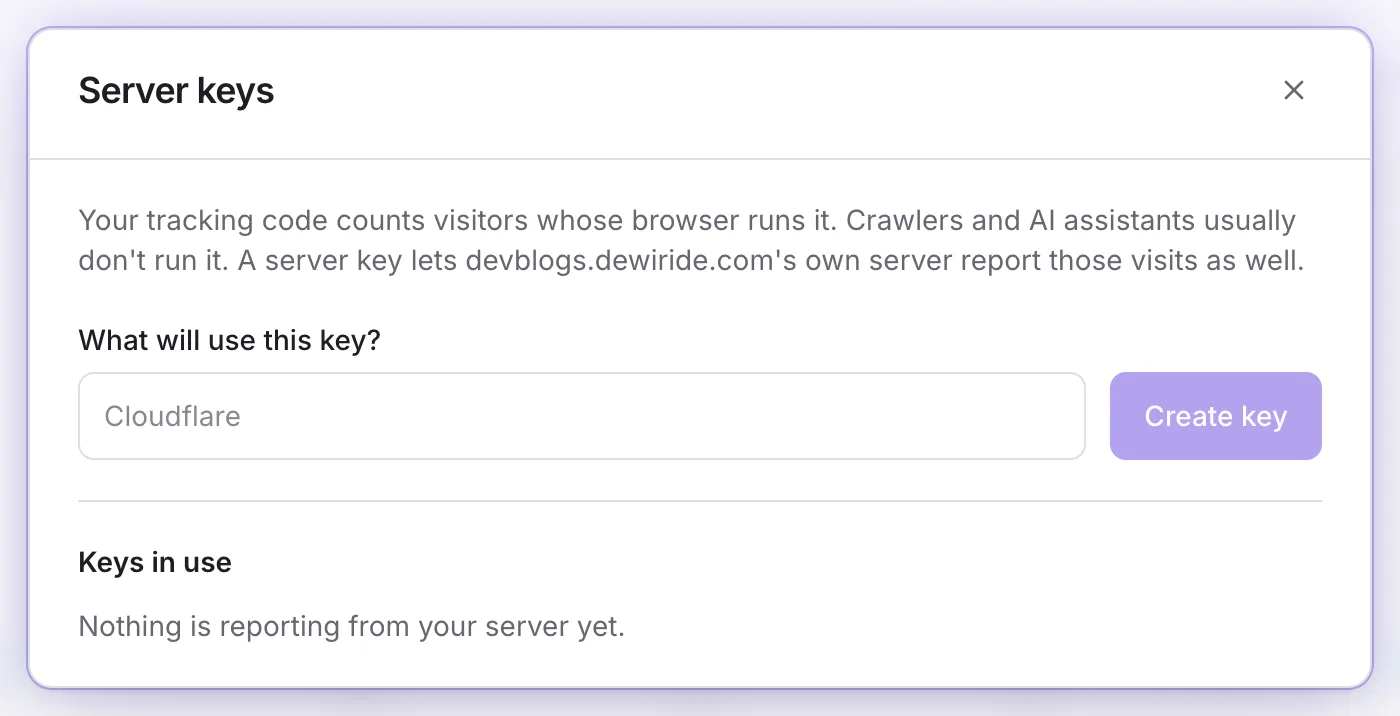
Choose Server keys, name what will use it, and press Create key. The secret is shown once, at the moment it is created — only a hash of it is stored, so it cannot be recovered afterwards. Keep it where the reporter runs and nowhere else. A key is bound to one site and cannot report for any other.
What it can see that a browser cannot:
| Observation | Browser tracker | Server-side reporter |
|---|---|---|
| Requests that never execute script | no | yes |
| HTTP status code | no | yes |
| Requests to paths that do not exist | no | yes |
| Engaged time, scroll depth | yes | no |
| What a visitor operated | yes | no |
Neither replaces the other, and running both on one site is the intended arrangement. A site running both is counted once per page delivered rather than once per report, so doing it properly does not double your numbers.
The honest limitation
You need somewhere in the request path to run code. That rules out more hosts than you might expect.
The site you are reading is a static Docusaurus build on Azure Static Web Apps, and it cannot use a server key. Static Web Apps serves built HTML straight from its edge; its Functions answer /api/* routes only, and staticwebapp.config.json is declarative routing with no way to call out. When a crawler asks for a page, no code of yours runs. That is not a shortcoming of the analytics product — it is what "static web app" means.
Hosts that do have a request-path hook:
- Cloudflare — a Worker in front of the site sees every request.
- WordPress — a plugin runs on every page load.
- Netlify / Vercel — edge middleware.
- Your own server — Nginx, Caddy or your application's own middleware.
The wire format is documented in docs/server-reporting.md: a POST to /collect/server with a Bearer token and up to 100 events per batch. Ready-made reporters for the platforms above are on the project's roadmap rather than in it, so writing one today is a few dozen lines against a documented endpoint.
Common Mistakes
| Mistake | What happens | Fix |
|---|---|---|
| Leaving the install unclaimed after it is public | Anyone who finds the address becomes the owner | Claim it the moment HTTPS works |
| Copying a site identifier from a guide | Your traffic is filed under somebody else's site | Use the one your own dashboard shows |
Testing on localhost | Events are sent and silently dropped | Register a localhost site, or test on the real domain |
Registering www.example.com | The bare domain is then rejected | Register example.com; subdomains are accepted automatically |
| Pasting the script into one page | Only that page is measured | It belongs wherever your site keeps things that appear on every page |
| Choosing the server's time zone | Days break at a boundary that means nothing to you | Pick the zone you read reports in |
| Putting a server key in front-end code | The key is now public and anyone can forge your traffic | Server keys belong only where the reporter runs |
Troubleshooting
| Symptom | Likely cause | What to do |
|---|---|---|
| Panels show "Something went wrong" | ClickHouse concurrency ceiling | Apply the override in Step 2 |
| Script loads, dashboard stays at zero | Origin does not match the registered domain | Check the site's address matches where the page is served from |
curl -I on the pixel returns 401 | The endpoint answers GET, not HEAD | Test with curl -o /dev/null -w '%{http_code}' <url> — it returns 200 |
| Nothing loads and the console shows a CSP error | Your site's Content-Security-Policy blocks the script | Add your analytics domain to script-src and img-src |
| Tracker 404s | Wrong address in the script tag | It must be your dashboard's own address; that is where dw.js is served |
| Traffic appears but every country is unknown | Reference data missing, or forwarded headers not trusted | See Part 3, and docker compose logs api | grep -i reference |
| The welcome screen never appears | The installation is already claimed | Sign in. There is no second chance at the welcome screen |
FAQ
Can I add more than one website? Yes, and there is no limit in the free version. Use + Add a website; each gets its own identifier and its own dashboard.
Does the tracker slow my site down?
It is 4,299 bytes and loaded with defer, so it does not block rendering or delay anything the reader is waiting for.
Does it set cookies? No cookies for tracking. Returning readers are recognised with a key that is rotated daily, and raw addresses are dropped after 72 hours.
What if I lose the owner password? There is no "forgot password" email on a fresh self-hosted install with no mail configured. Keep it in a password manager. Recovering from its loss means database surgery.
Can I remove a website later? Yes, and it is deliberately hard: removing a website deletes everything ever measured for it and nothing brings it back, so it asks you to type the website's address first. Only the owner can do it.
Why is the tracking code two lines instead of one? Because one of them runs JavaScript and the other cannot. Use both, or you lose readers who browse with scripting off.
Can I self-host the tracker file on my own domain?
Not as shipped — dw.js is served by the dashboard, and its address is what the collector expects reports to arrive at. Serving it elsewhere means reverse-proxying /dw.js and /collect to your installation.
Conclusion
The installation has an owner, your first website exists, and the tracking code is on a real page — including the fallback for readers who run no scripts at all.
You also know the rule that explains the most common "it isn't working": the engine only accepts reports from the domain the site is registered under, which is exactly why nothing shows up when you test locally.
Next comes the interesting part — what the dashboard actually tells you once traffic arrives, and how it separates the people from everything else.
← Previous: Part 3: Custom Domain and Free HTTPS with Caddy Next: Part 5: Read the Dashboard — Humans, Bots and Engagement →
