Build an Overtime Timesheet App in Power Apps — Part 15: Build the Power BI Overtime Report

The app's Reports screen answers "how much overtime this month?". Approvers and payroll also want to look across months, by department and by person. This part builds a Power BI report on the app's SharePoint lists, entirely in the browser, with row-level security: each approver sees their own departments, and payroll sees everything.
This is Part 15 of a 21-part series.
- Part 1: Plan the App and Set Up the Demo Organization
- Part 2: Create the SharePoint Site and Lists
- Part 3: Keep Overtime Private with SharePoint Permissions
- Part 4: Create the Solution, Environment Variables and Canvas App
- Part 5: Build the Home Screen
- Part 6: Build the Log Overtime Screen
- Part 7: Build the My Overtime Screen
- Part 8: Build the Approval Flow for Teams and Outlook
- Part 9: Show Approvers What's Waiting
- Part 10: Build the Departments Screen
- Part 11: Build the Reports Screen
- Part 12: Import the Old Excel Timesheet
- Part 13: Create the Monthly Payroll Workbook with Office Scripts
- Part 14: Create the Payroll Workbook from the App
- Part 15: Build the Power BI Overtime Report (you are here)
- Part 16: Share the App and Add It to Microsoft Teams
- Part 17: Test Every Role and Department (coming soon)
- Part 18: Build a Setup Flow That Creates the Lists (coming soon)
- Part 19: Run the Solution Checker and Export the Solutions (coming soon)
- Part 20: Install the App in a New Environment (coming soon)
- Part 21: Recap, Production Checklist and Next Steps (coming soon)
Part 11 gave approvers and payroll a Reports screen in the app, one month at a time. This part builds the same figures in Power BI, in a workspace called Overtime Timesheet: a semantic model of the OvertimeEntries and Departments lists, and a report with cards, a month slicer, two charts and a table. Everything is done in the Power BI service, in the browser, so it works on a Mac too. Each generic task has its own guide; this part gives the values for this app, and why.
What You'll Build
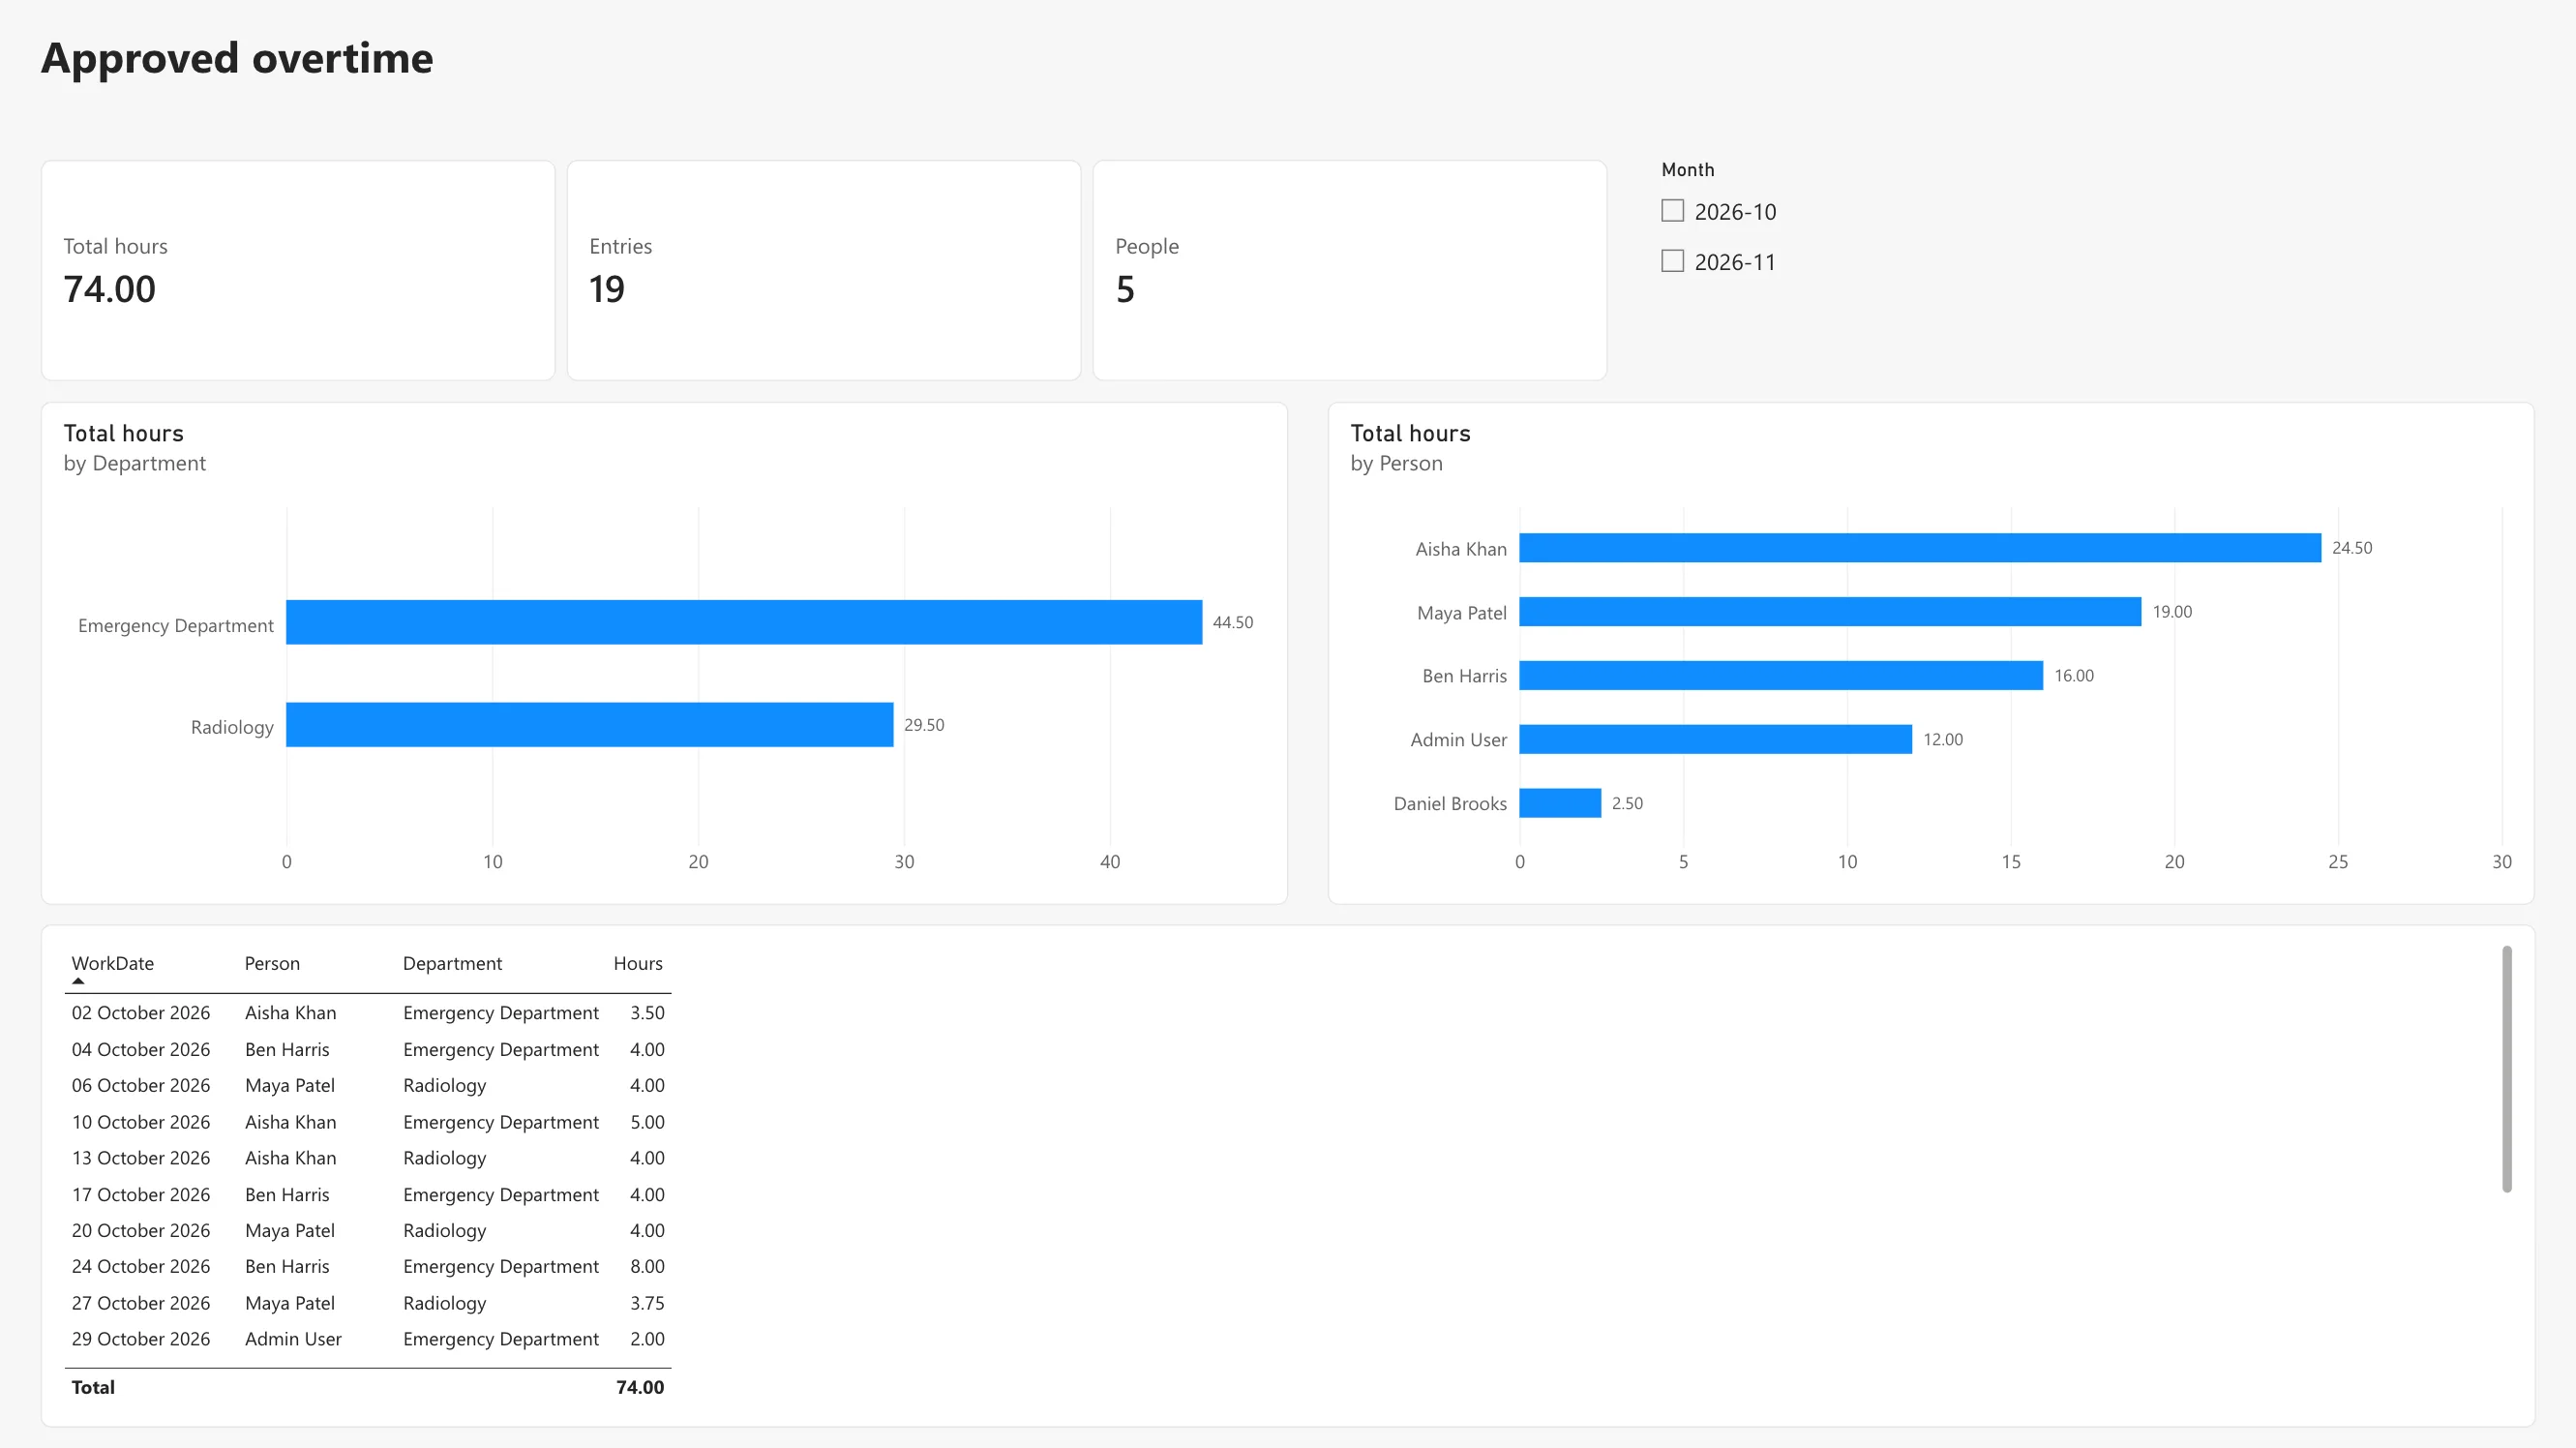
The report, as payroll sees it:
How It Works
The decisions behind it:
- Approved twice, as everywhere else. Like the Reports screen and the payroll workbook, the report counts an entry only when both its Status and its Approval Status say Approved. Power Query filters the rest out before they reach the model.
- Only what the report needs. Six columns of each entry: the date, hours, department, person and month. Reasons, comments and times stay in SharePoint.
- Approvers come from the Departments list. A Department approvers table has one row per department and approver, from the list's Approvers column. The Approvers role keeps the rows whose email is the signed-in user's, and relationships carry that filter to Departments and on to the entries.
- Payroll sees everything. The Payroll role has no rules, which Microsoft's security planning article says provides access to all rows of all model tables.
- Groups, not people. Overtime Timesheet Users is the Approvers role's member and the workspace's Viewer; Overtime Payroll is the Payroll role's member. Staff who approve nothing see nothing.
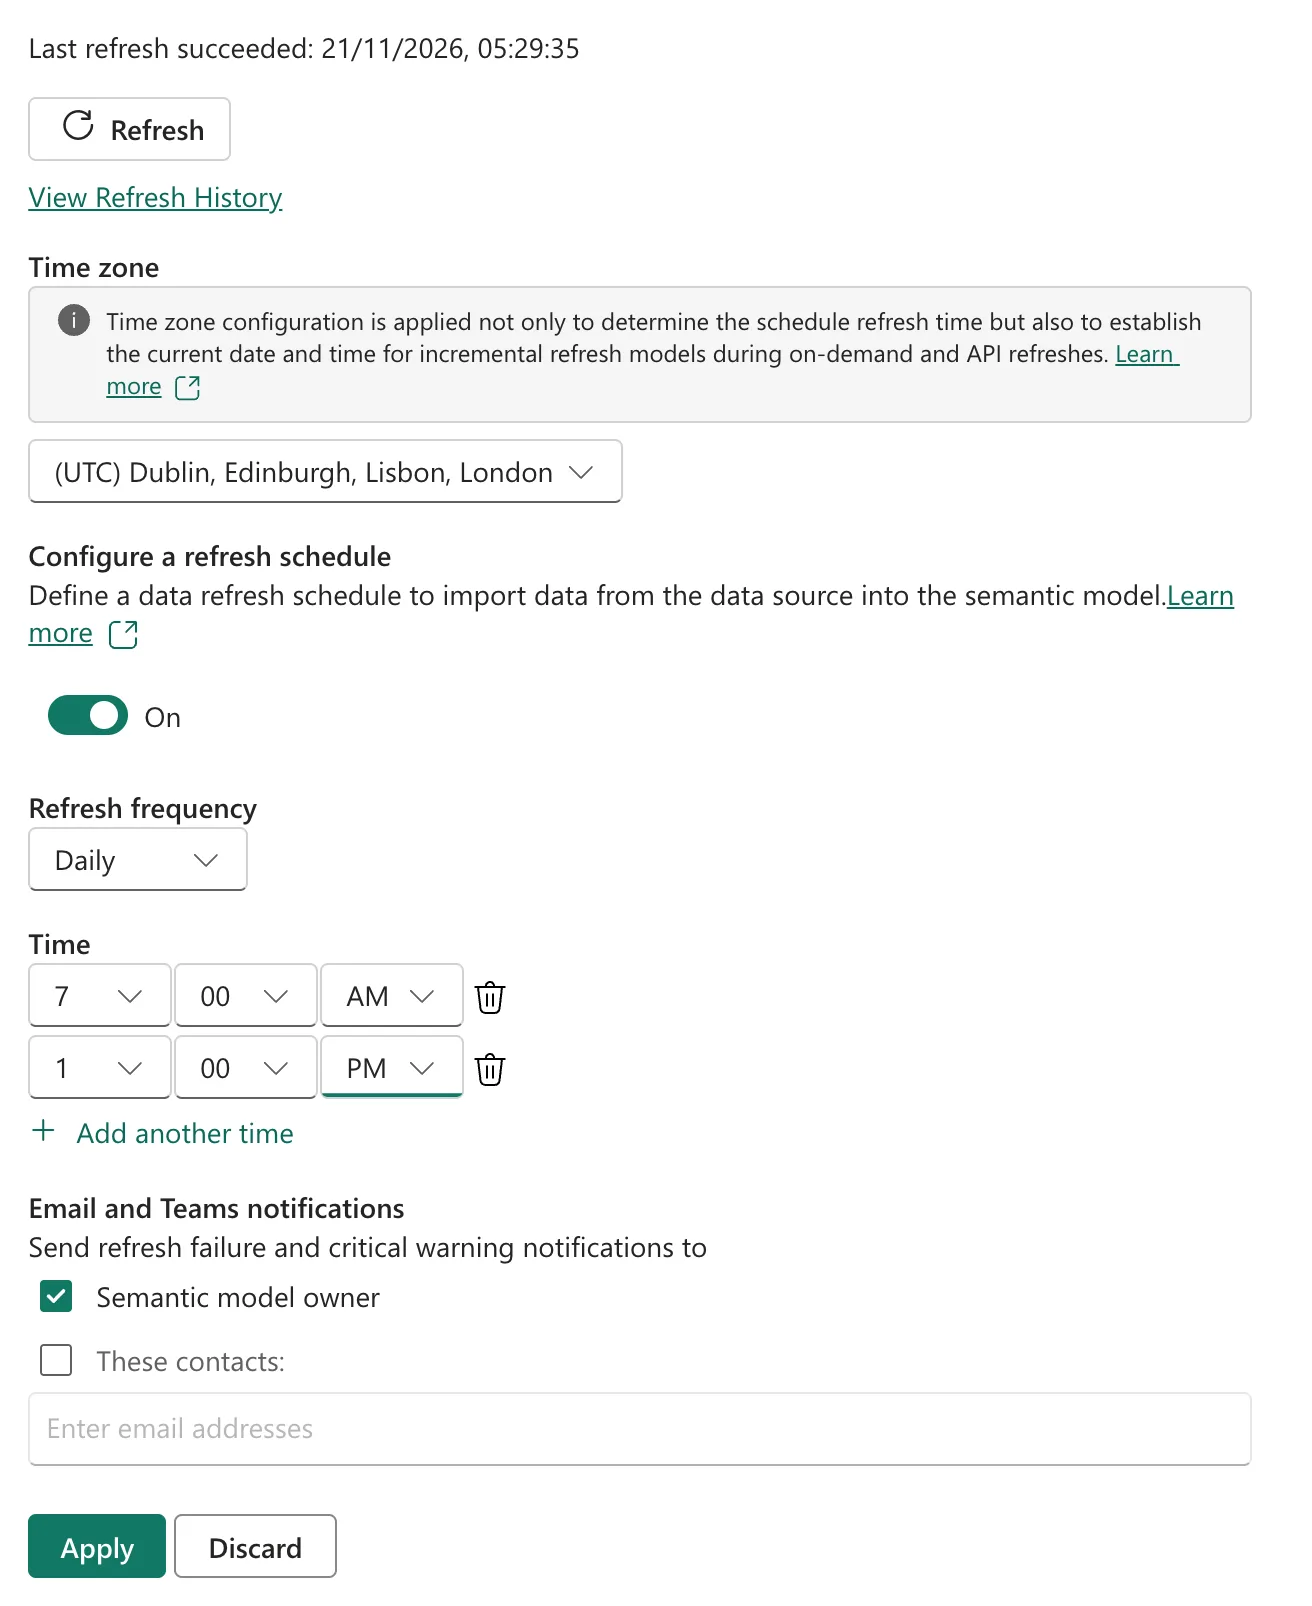
- Refreshed twice a day. The model refreshes at 07:00 and 13:00 UK time, so approvals made in the morning show in the afternoon.
- What it costs. Power BI is the one paid part of the series. Every viewer needs a Power BI Pro license, unless the workspace is on a Premium or Fabric F64 or larger capacity, as Part 1's cost section explains. Microsoft's Power BI pricing page lists Pro at $14.00 per user per month, paid yearly, included in Microsoft 365 E5. The app's Reports screen needs no Power BI license.
Prerequisites
- Part 14 completed.
- A Power BI Pro or Premium Per User license, or a Power BI trial, for you and for everyone who'll view the report.
Step 1: Create the Workspace
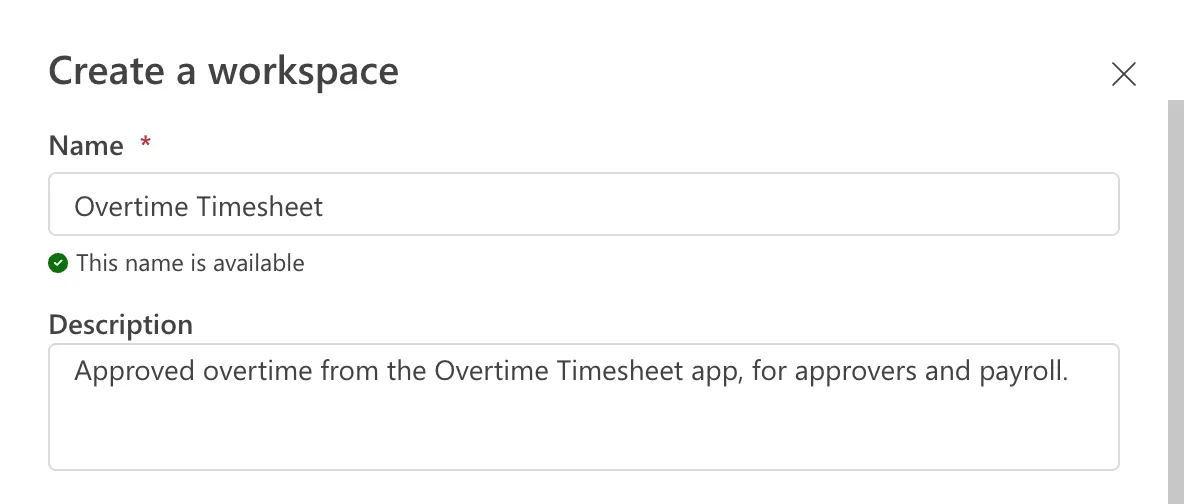
At app.powerbi.com, select Workspaces > New workspace (How to Create a Workspace in Power BI). Name it Overtime Timesheet, with the description Approved overtime from the Overtime Timesheet app, for approvers and payroll.:
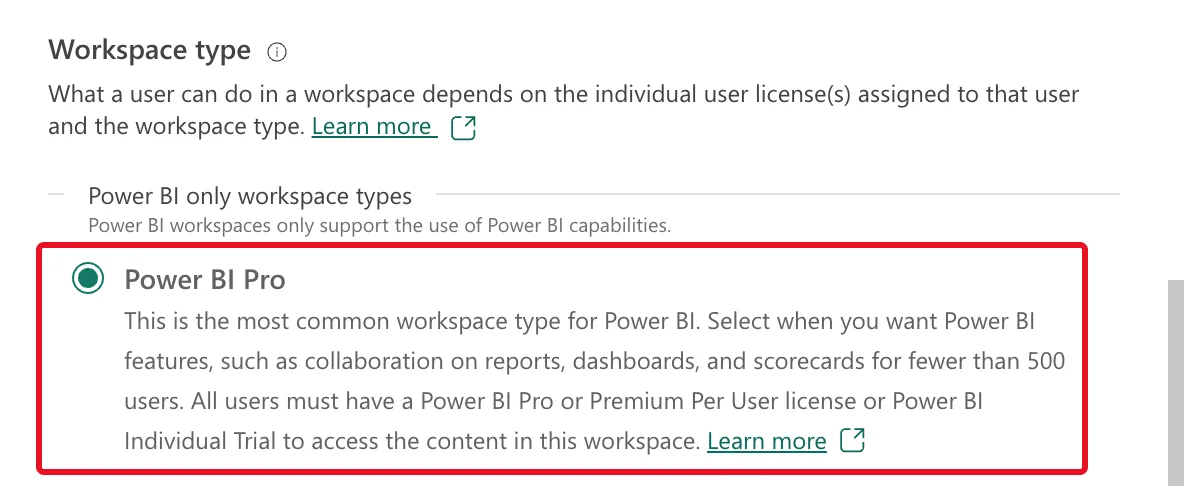
Under Workspace type, keep Power BI Pro:
Select Apply. The workspace opens, empty:

Step 2: Get the Two Lists
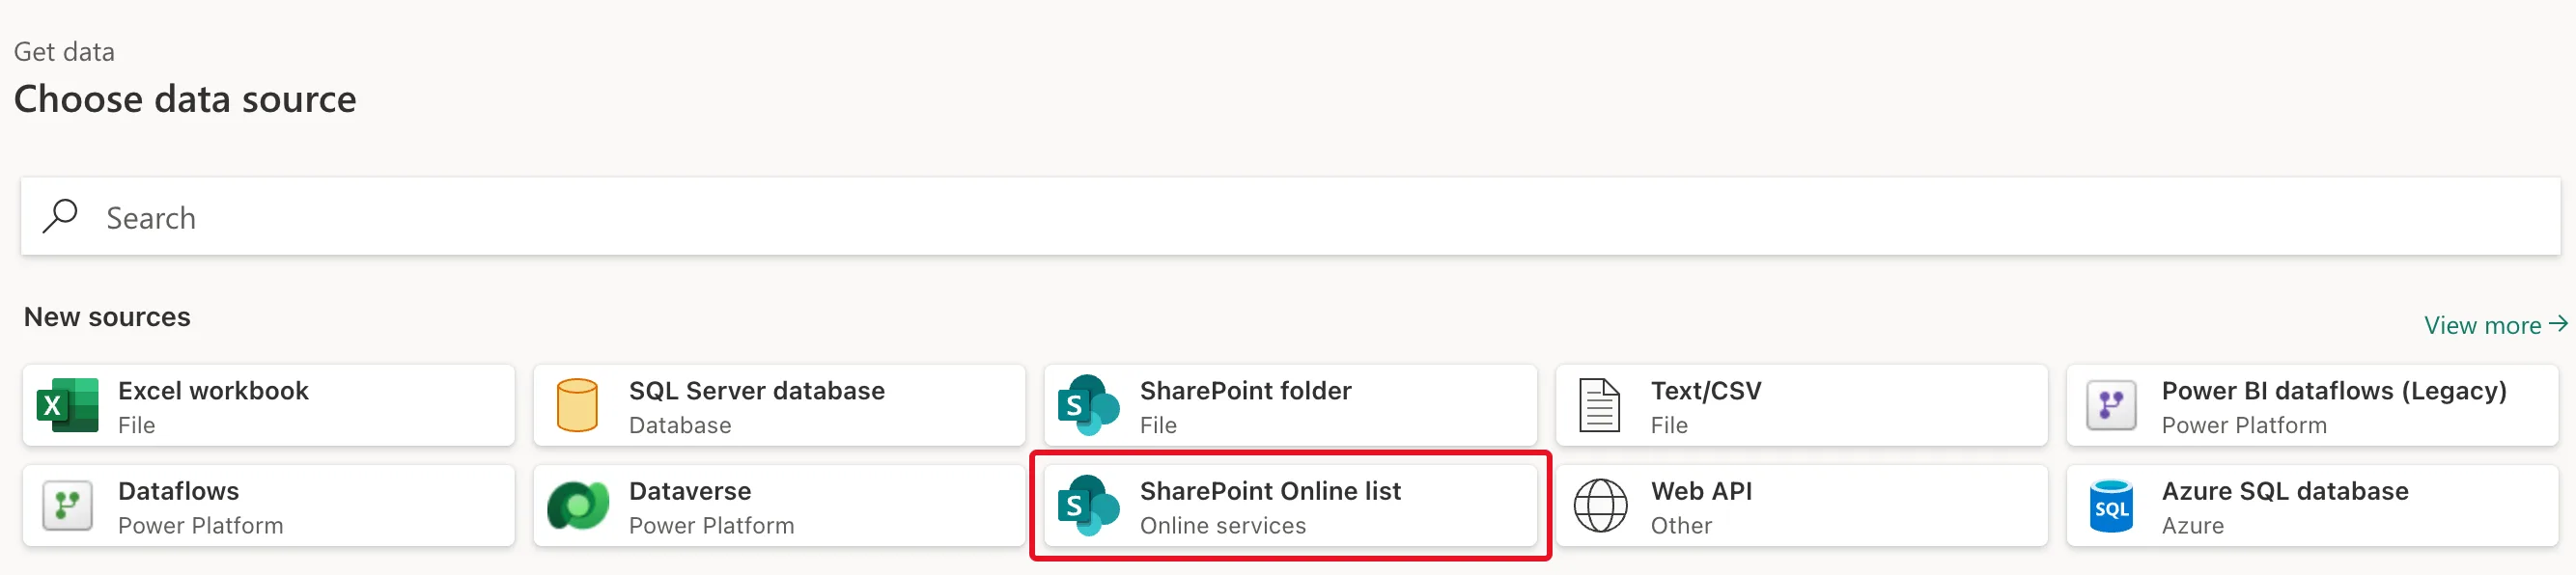
Select New item > Semantic model > Get Data, then SharePoint Online list (How to Get Data from a SharePoint List in Power BI in the Browser):
Fill in the connection:
| Setting | Value |
|---|---|
| Site URL | The Overtime Timesheet site from Part 2 |
| Implementation | 2.0 |
| View mode | All - Retrieve all columns from a SharePoint List |
| Connection | A connection for the site signed in as the app's owner, or Create new connection with Organizational account |
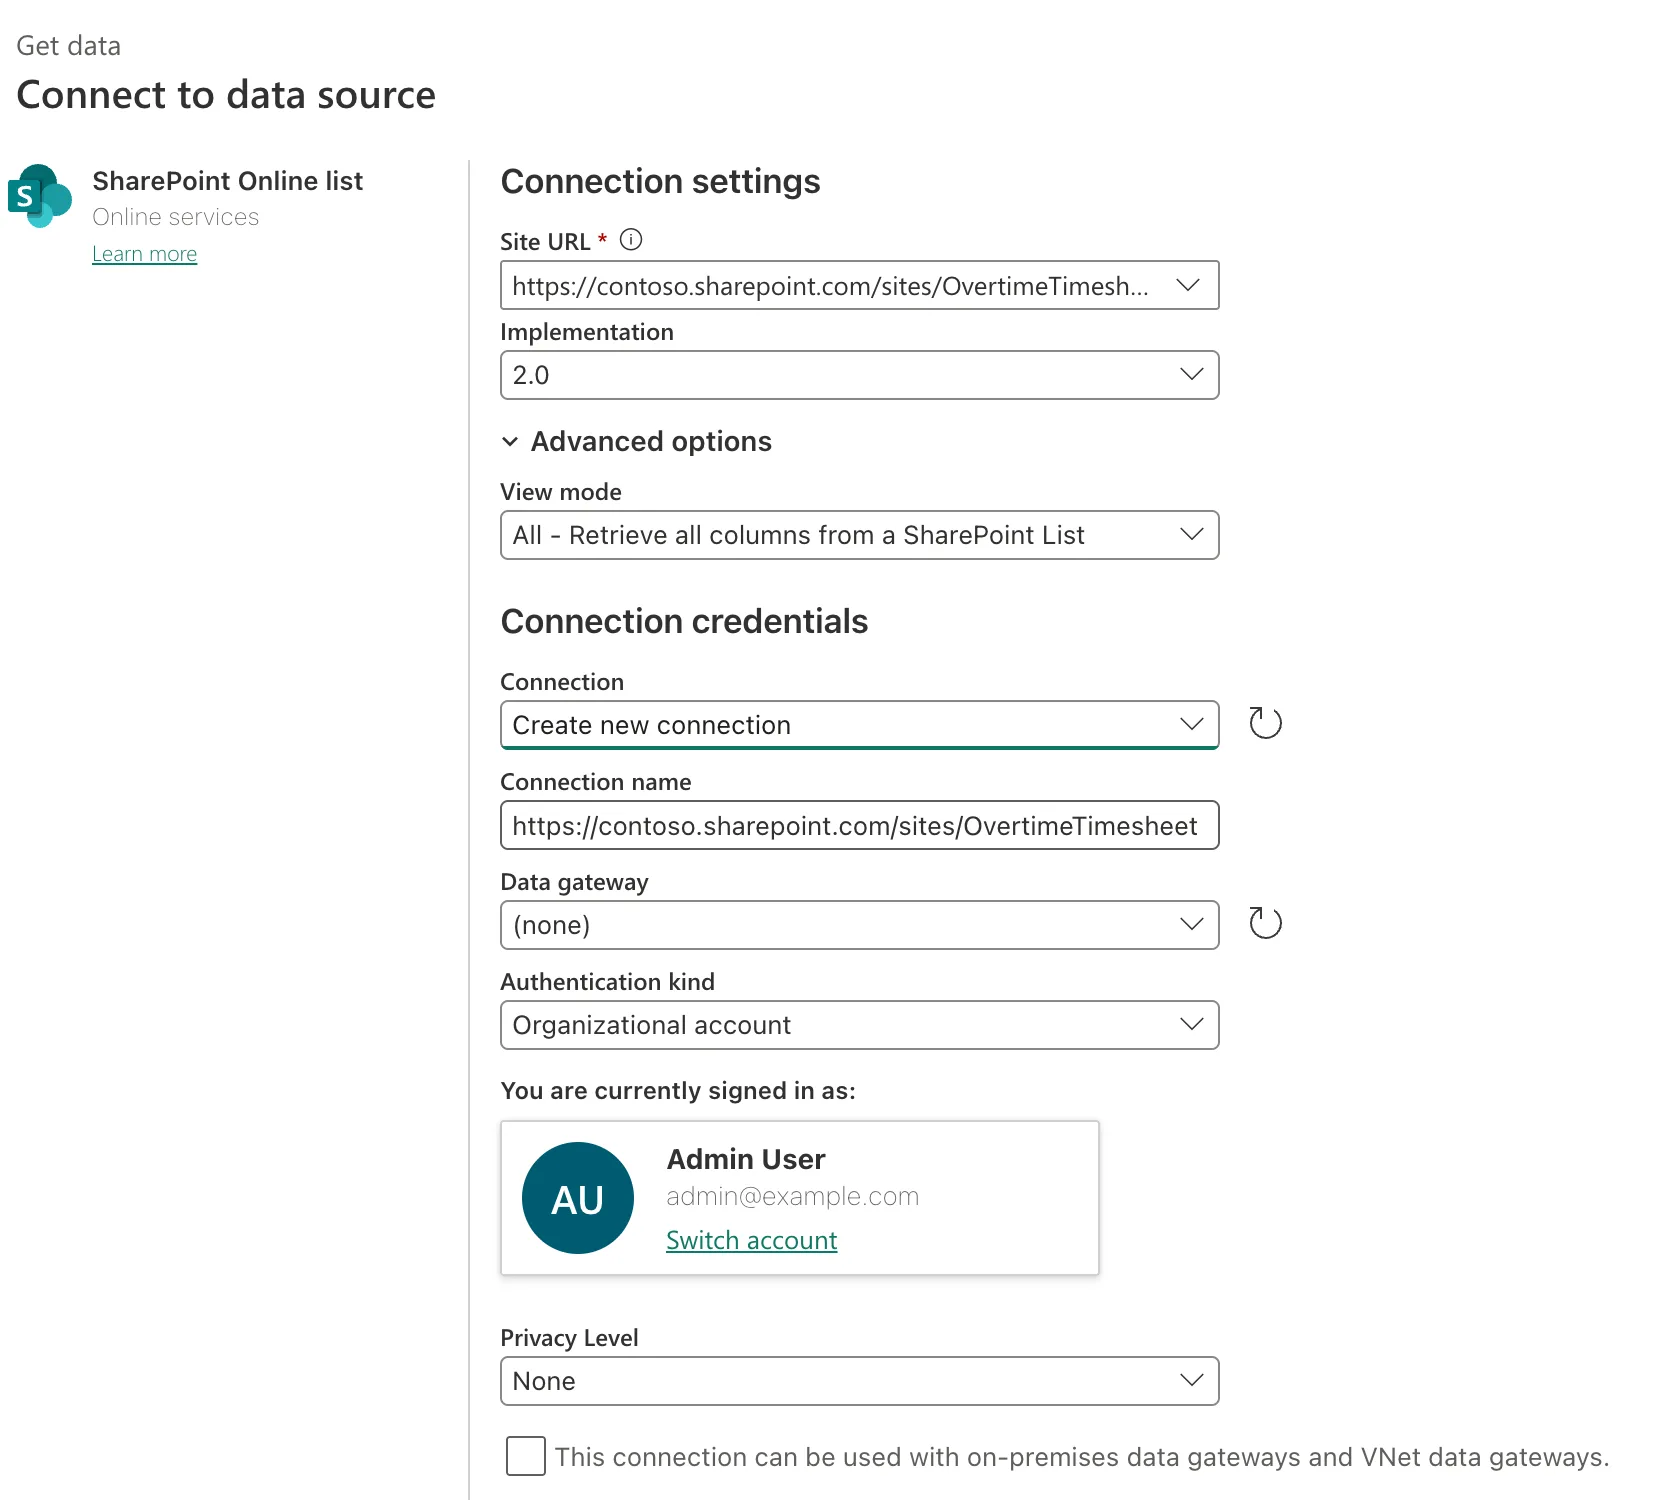
In my tenant, Power BI picked a connection I already had for the site, signed in as the app's owner, and I kept it. The picture shows the other choice, Create new connection, which you'll see the first time. Either way, the connection reads the lists as the app's owner, like the flows, so the model gets every entry and the roles decide who sees which.
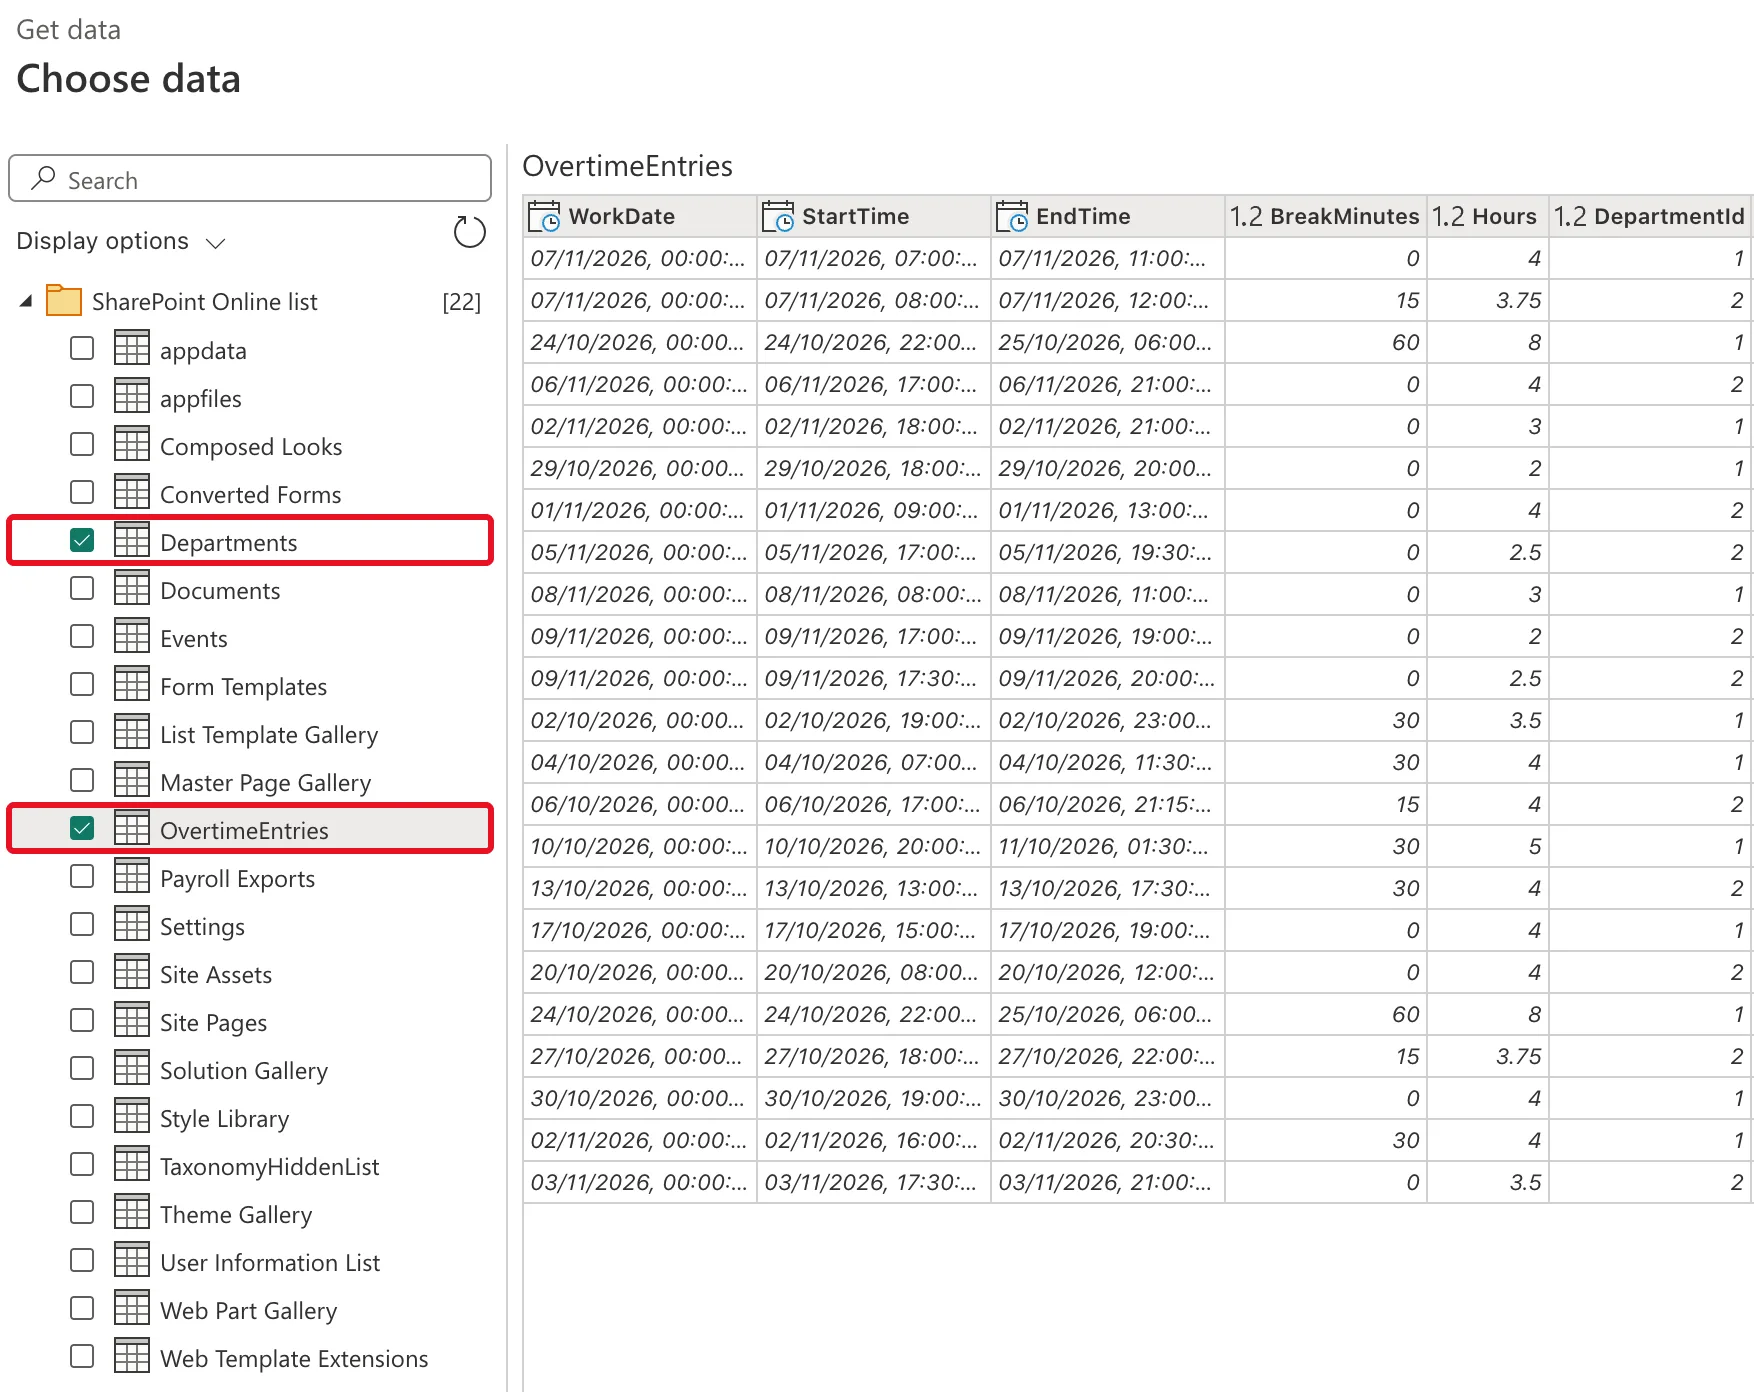
Select Next, tick Departments and OvertimeEntries among the site's 22 lists and libraries, and select Transform data:
Step 3: Keep the Approved Entries
Select the OvertimeEntries query. Choose columns keeps eight of its columns (How to Choose Columns in Power Query): WorkDate, Hours, DepartmentId, Department, EmployeeName, Status, WorkMonth and Approval Status:
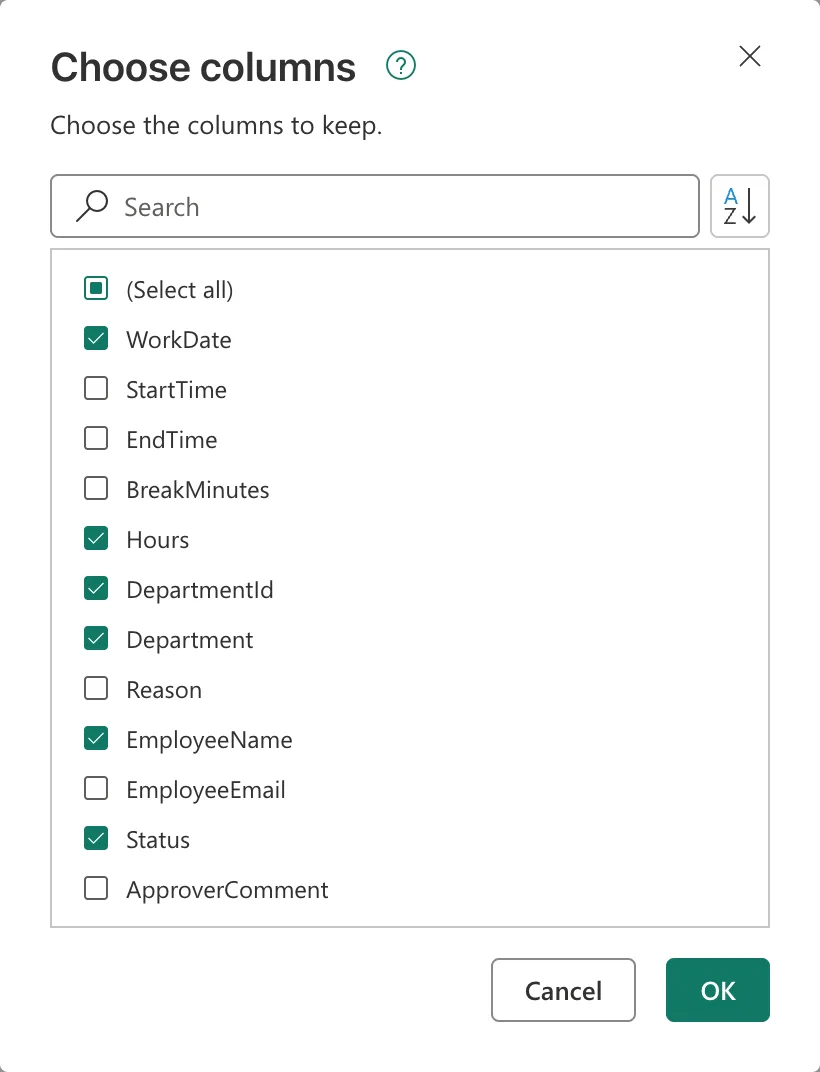
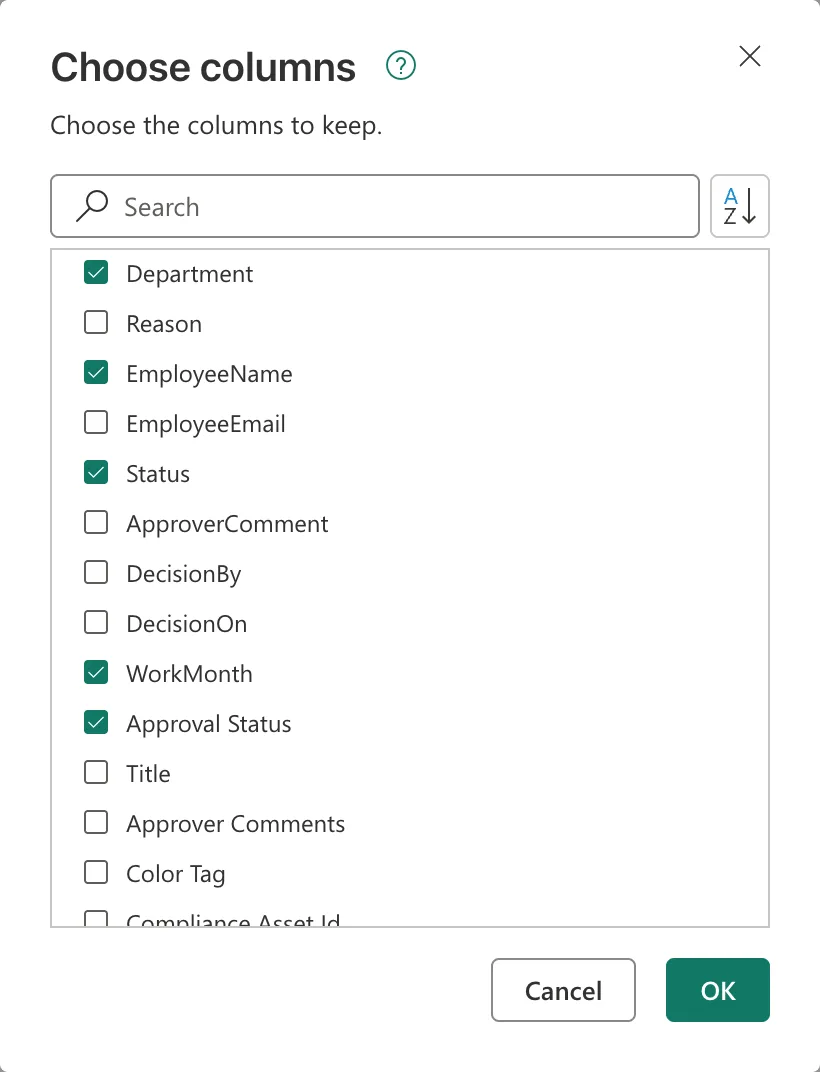
Approval Status is the content approval status from Part 3. Filter rows in Advanced mode keeps the entries approved twice (How to Filter Rows by Two Conditions in Power Query):
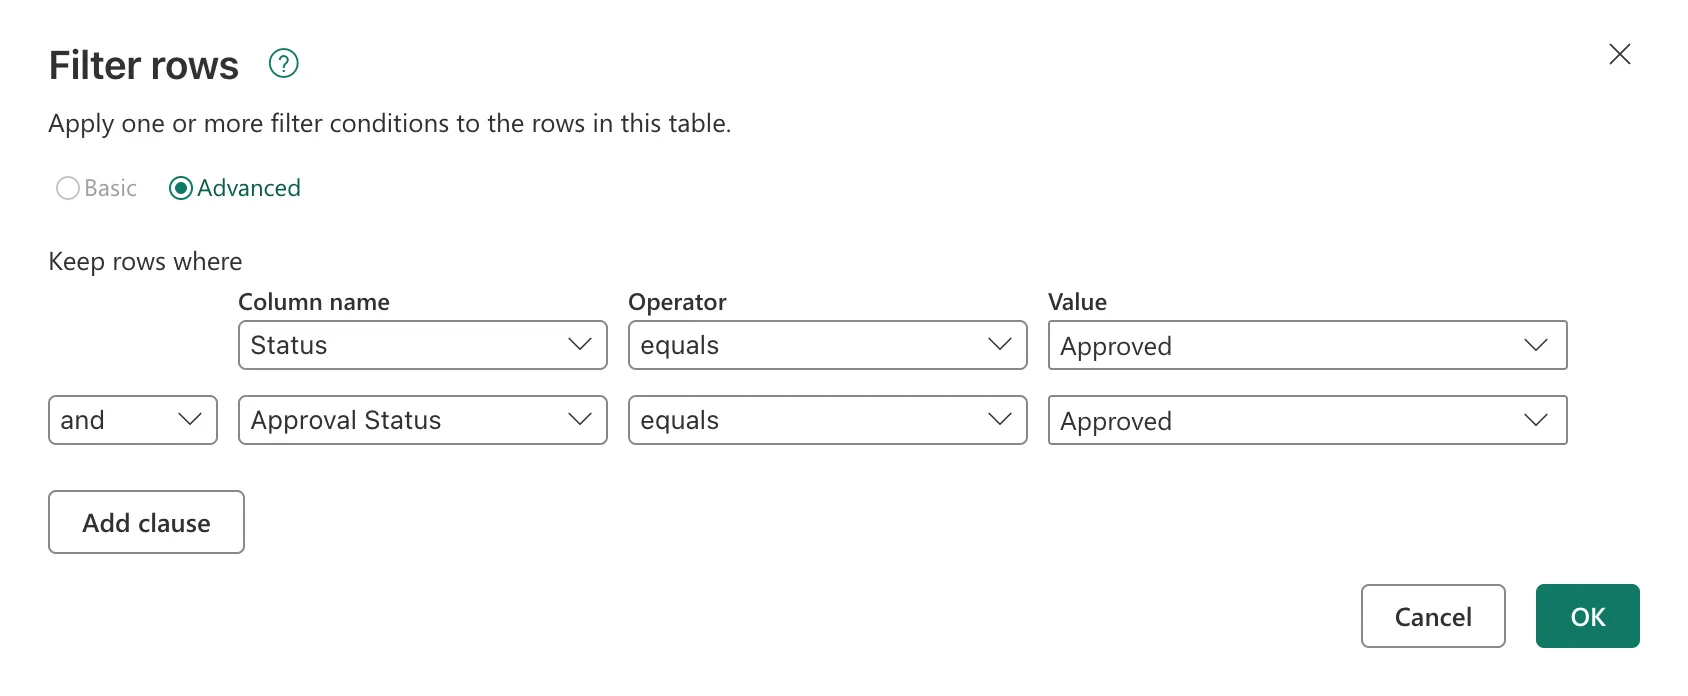
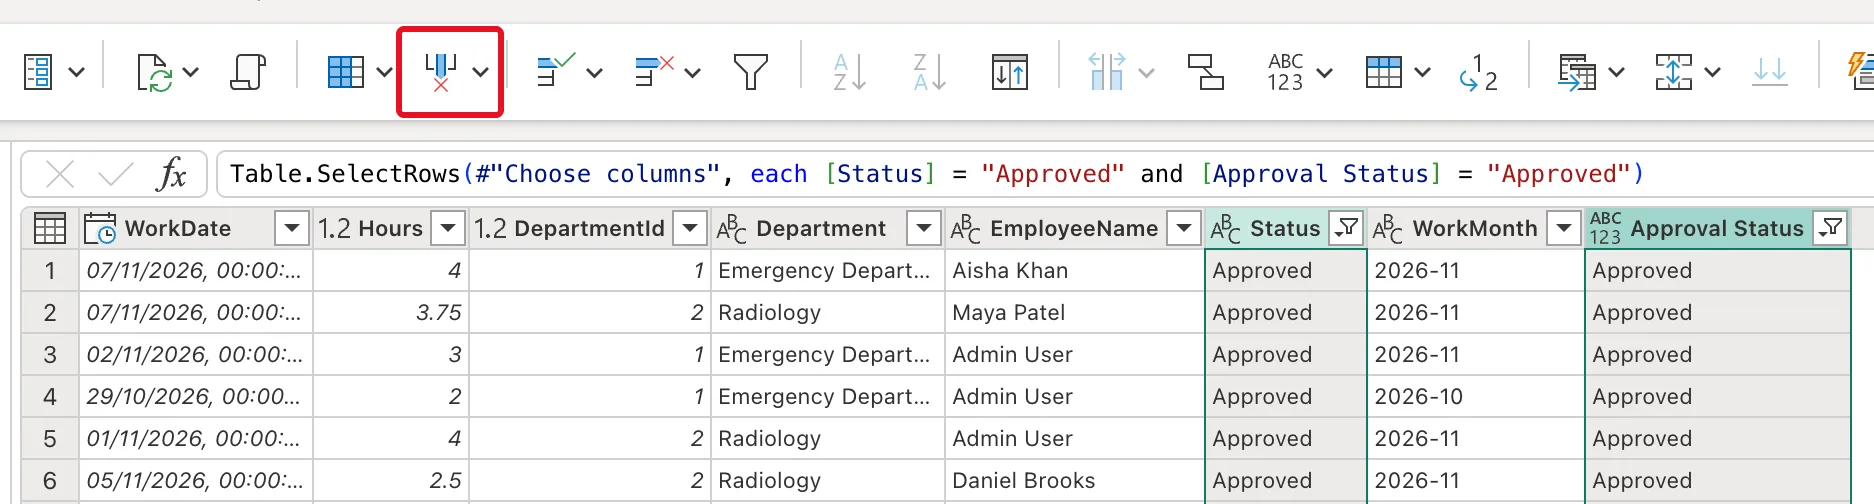
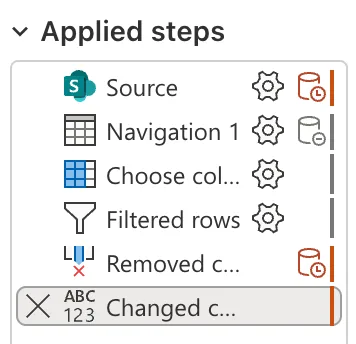
19 entries were left: 11 in October, 46.25 hours, and 8 in November, 27.75 hours, the same as the Reports screen. With only approved rows, the two status columns say Approved everywhere, so Remove columns drops them (How to Remove Columns in Power Query):
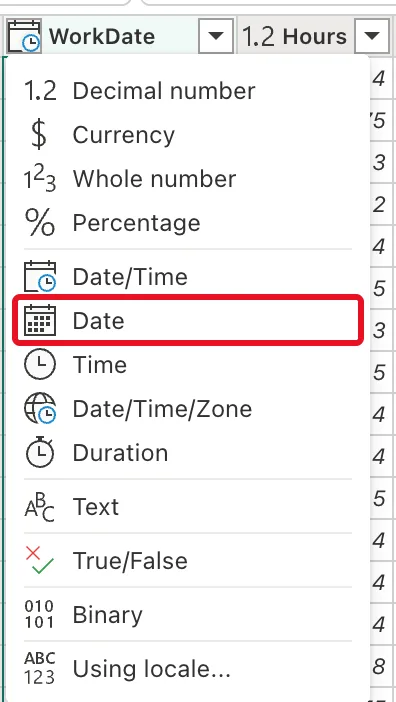
Then set two types (How to Change a Column's Data Type in Power Query): WorkDate from Date/Time to Date, and DepartmentId to Whole number, because it's matched with the departments' ID:
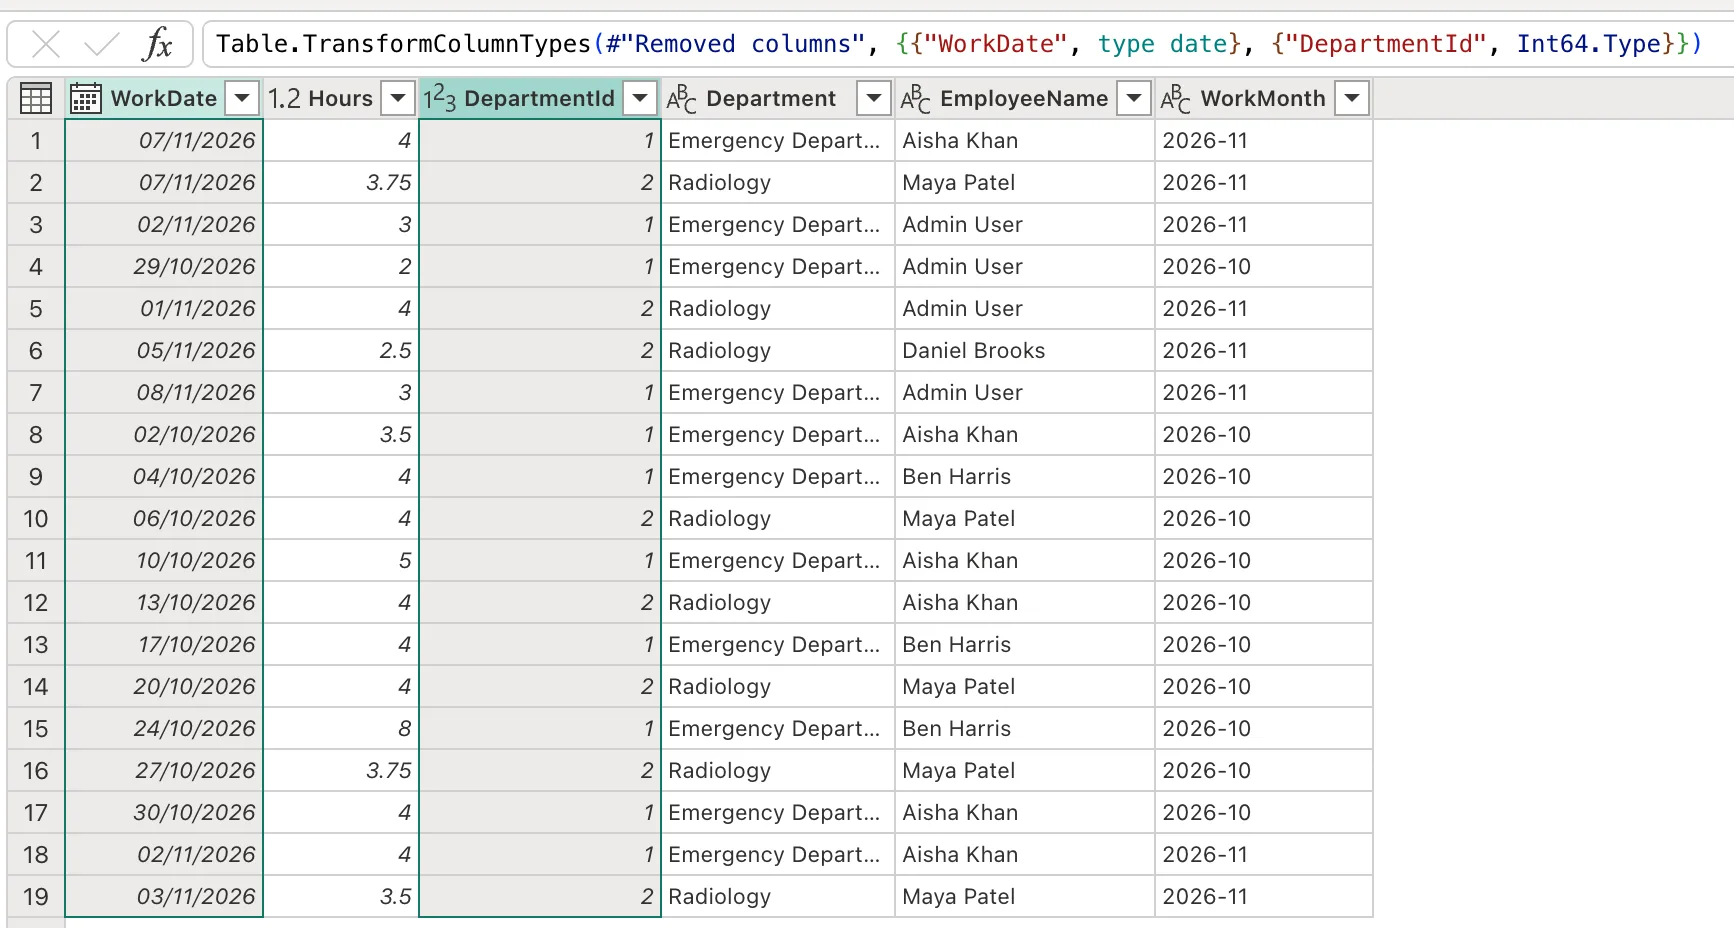
The query now has six columns and 19 rows:
Step 4: Build the Department Approvers Table
The Departments list's Approvers column holds several people per department. The role needs them one per row, so they get their own query. Right-click Departments under Queries and select Duplicate (How to Duplicate a Query in Power Query):
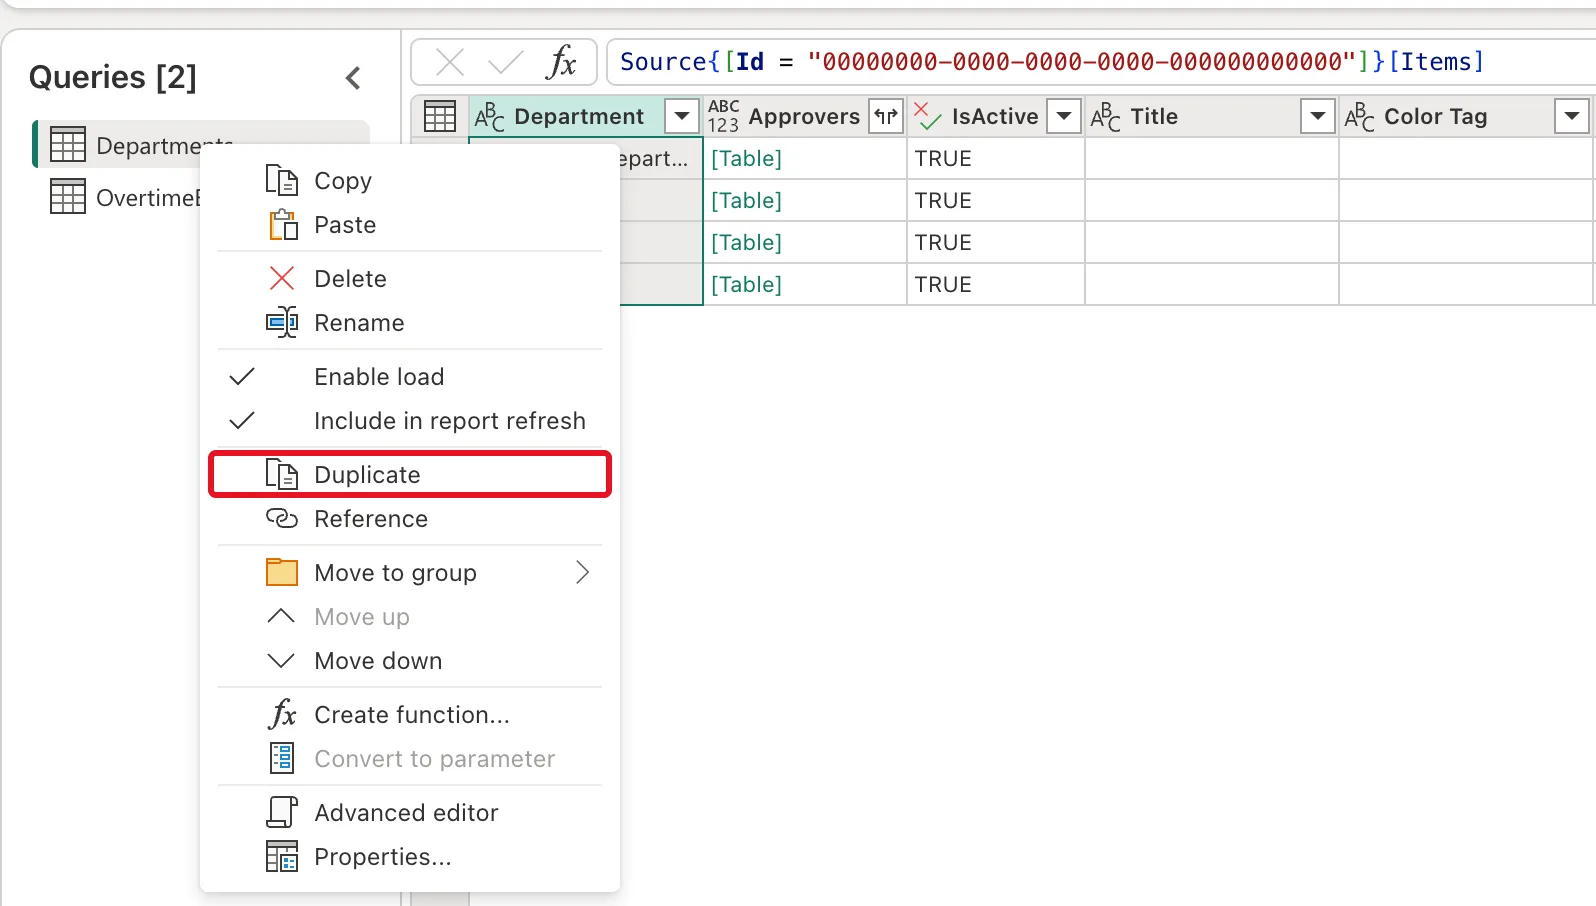
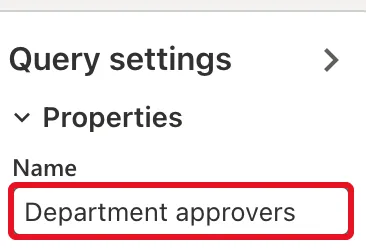
Duplicate, not Reference: the next steps remove Approvers from Departments, and a reference would lose it too. Rename the copy Department approvers (How to Rename a Query in Power Query):
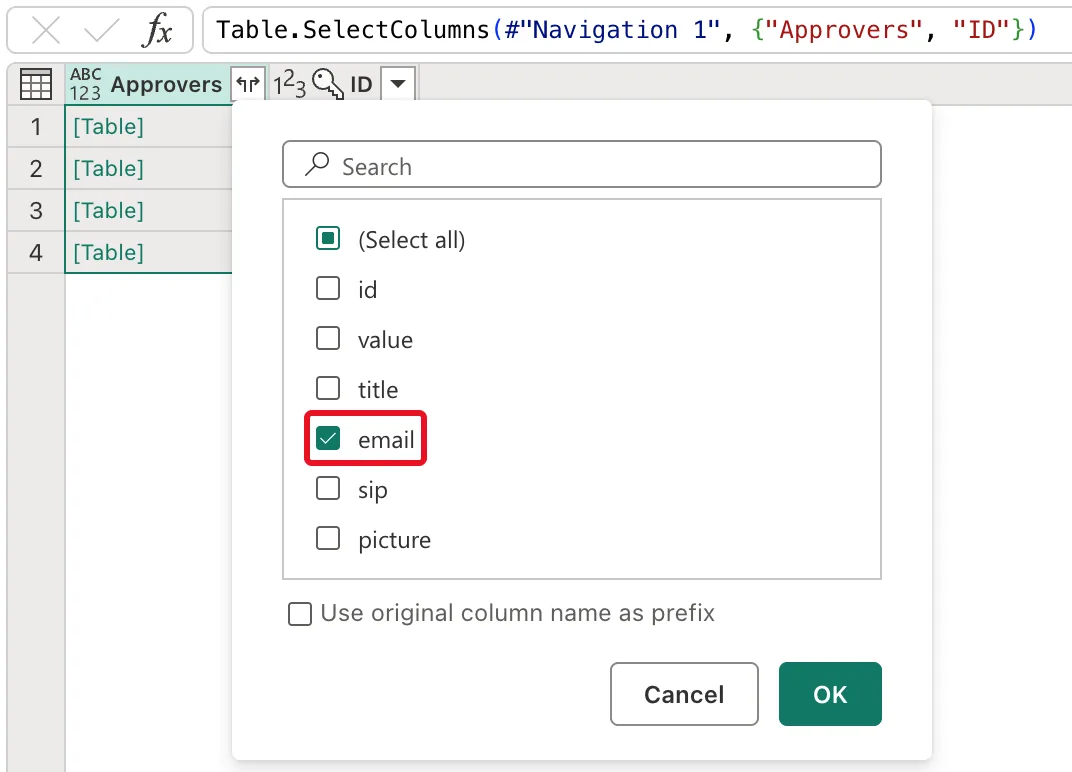
In Department approvers, choose the columns Approvers and ID, then expand Approvers to its email field, without the prefix (How to Get the Email from a SharePoint Person Column in Power Query):
Rename email to ApproverEmail and set it to Text (How to Rename a Column in Power Query). Four rows: Olivia Bennett for departments 1 and 6, Daniel Brooks for 2, and the app's owner for 5:

Finally, Departments keeps Department, IsActive and ID:

Step 5: Create the Semantic Model
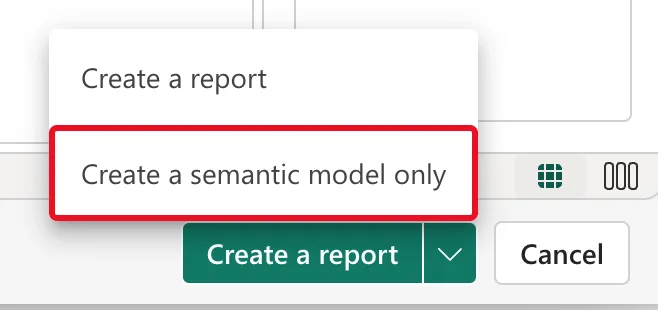
Select the arrow next to Create a report and choose Create a semantic model only (How to Create a Semantic Model Without a Report in Power BI):
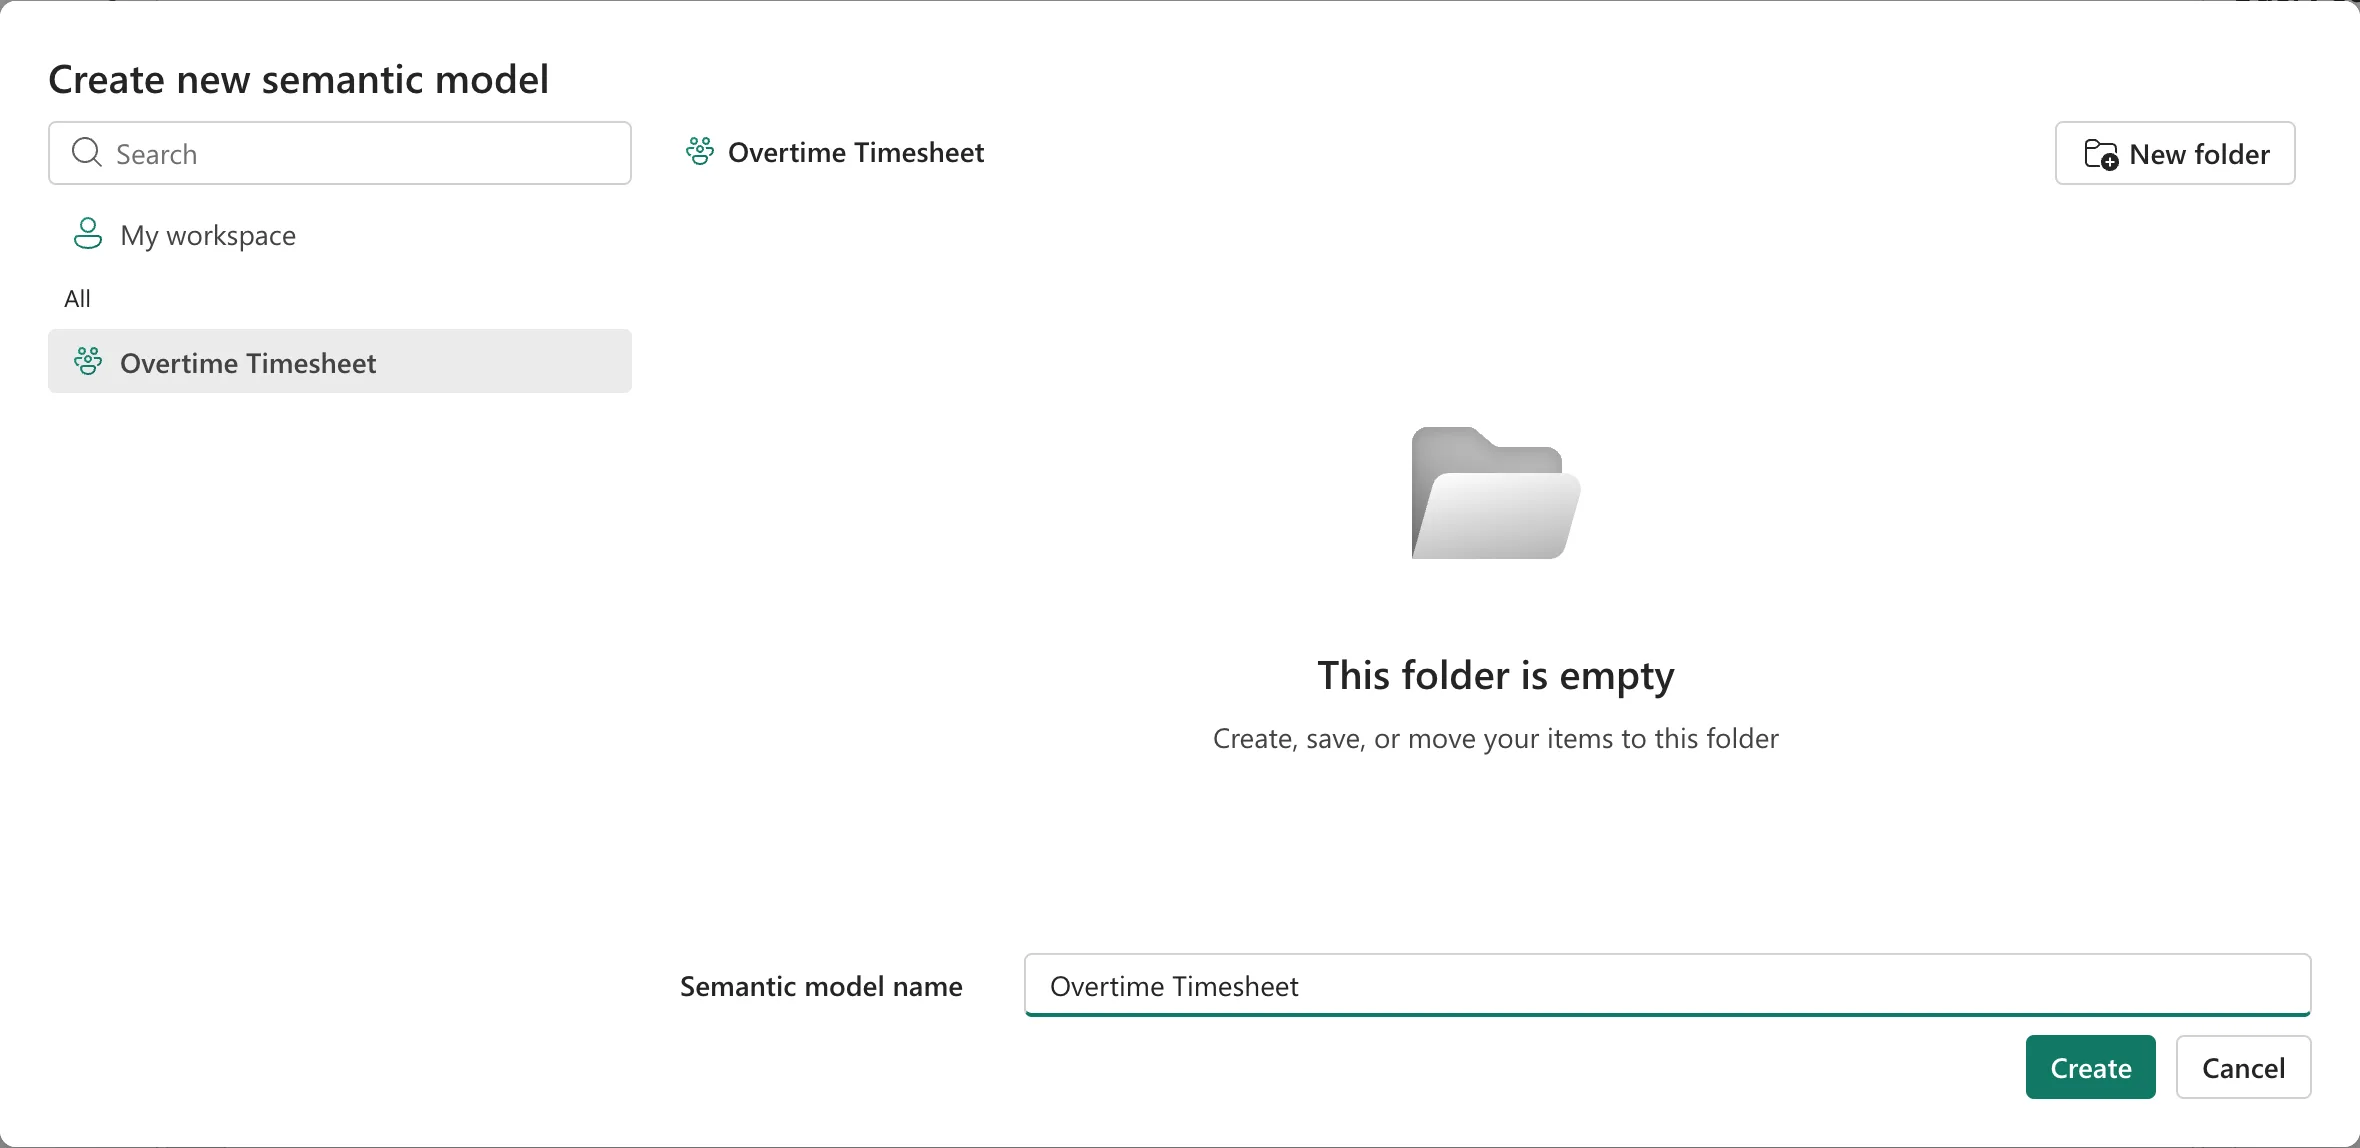
Name it Overtime Timesheet, in the Overtime Timesheet workspace, and select Create:
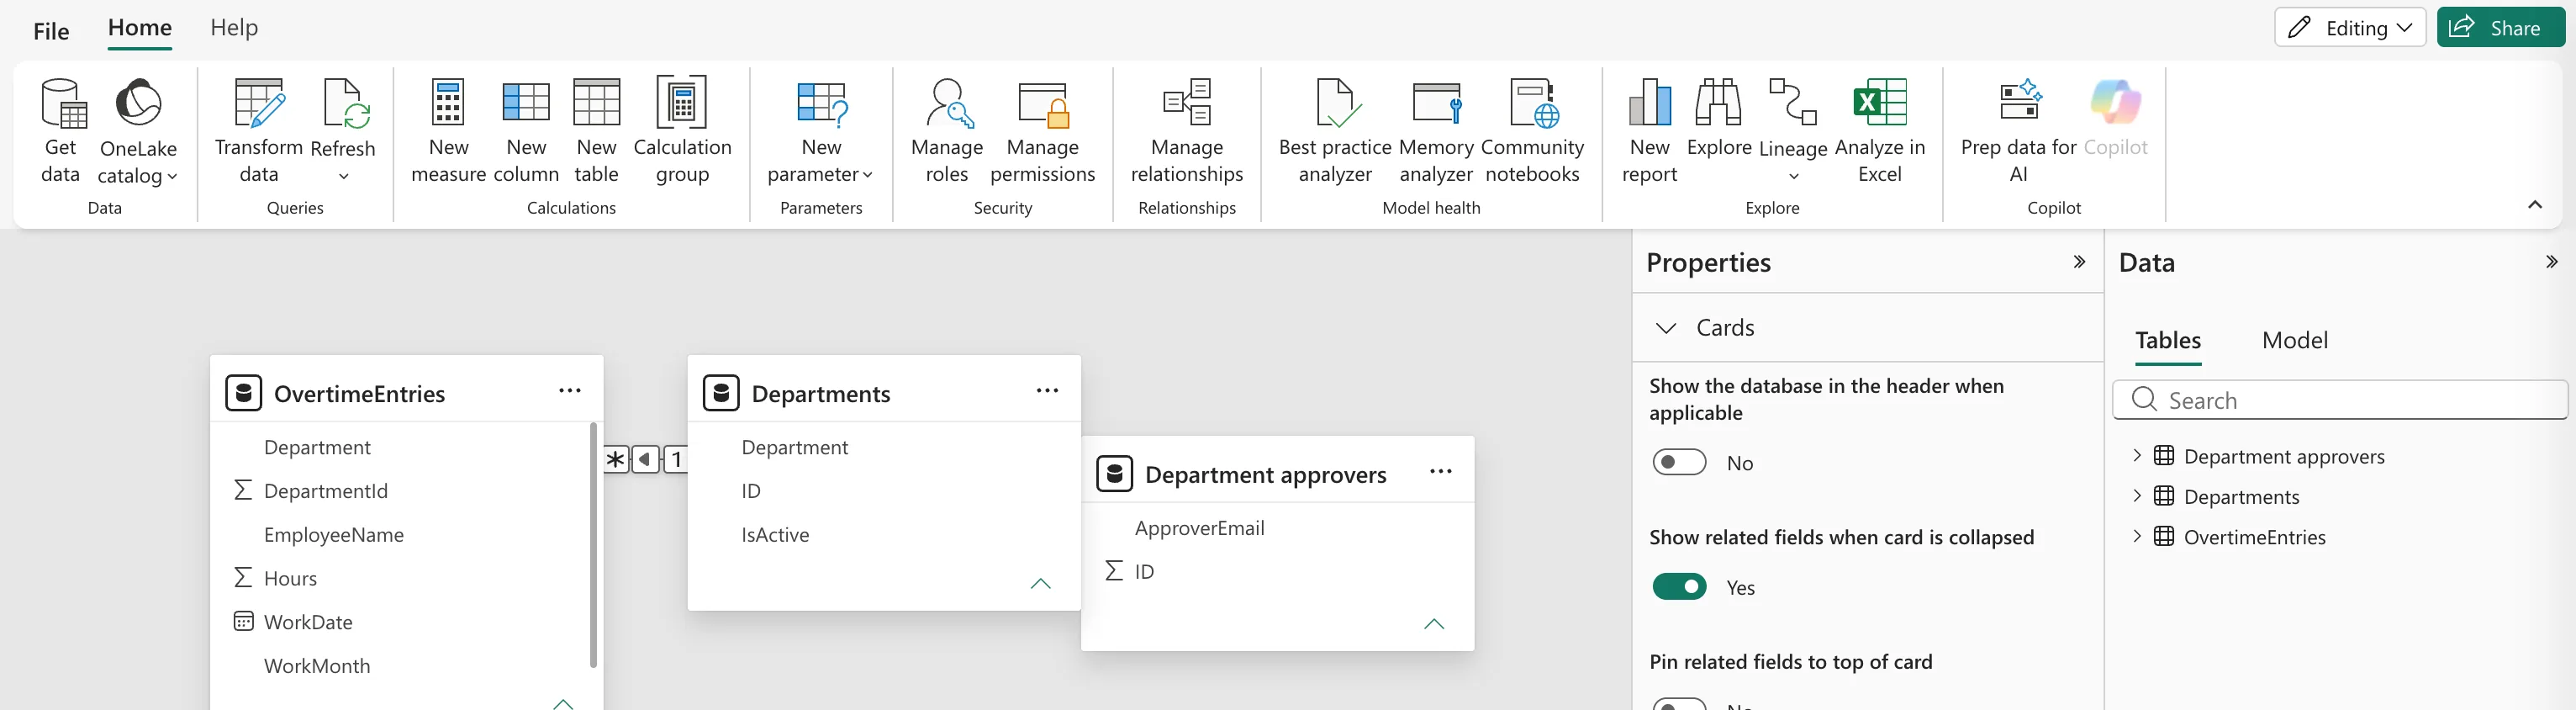
The model editor opens with the three tables:
Step 6: Relate the Tables
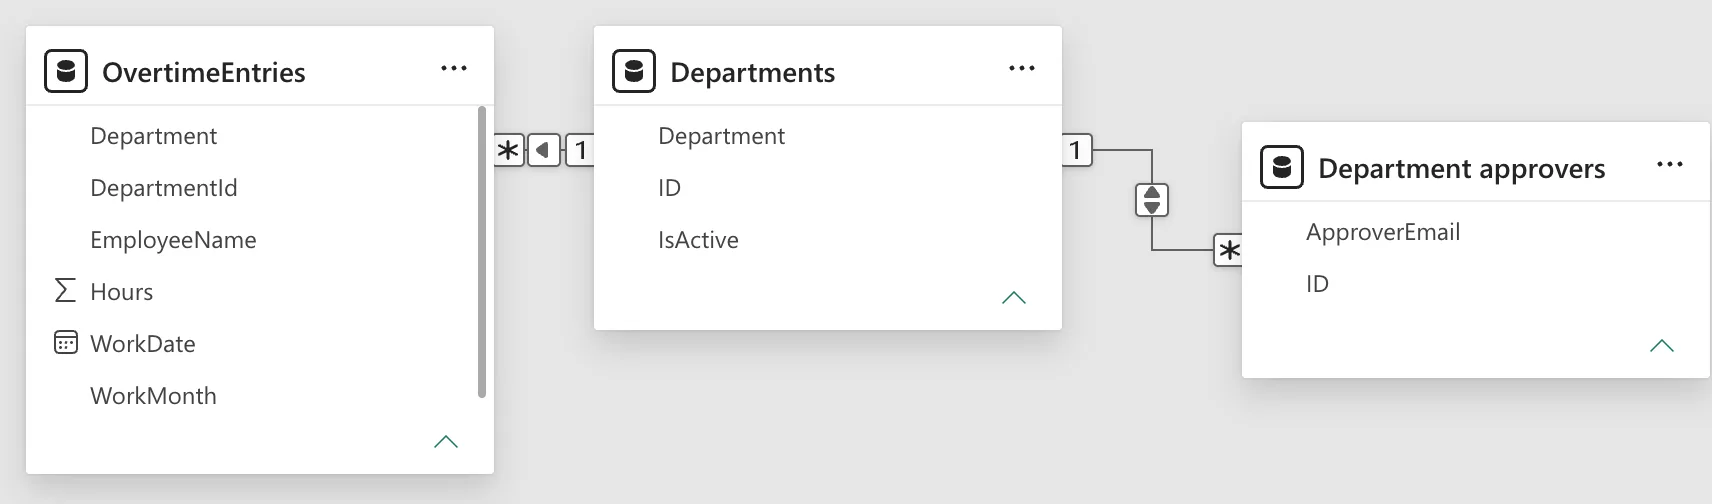
Manage relationships showed one relationship Power BI had made by itself: OvertimeEntries (Department) to Departments (Department), by the department's name:
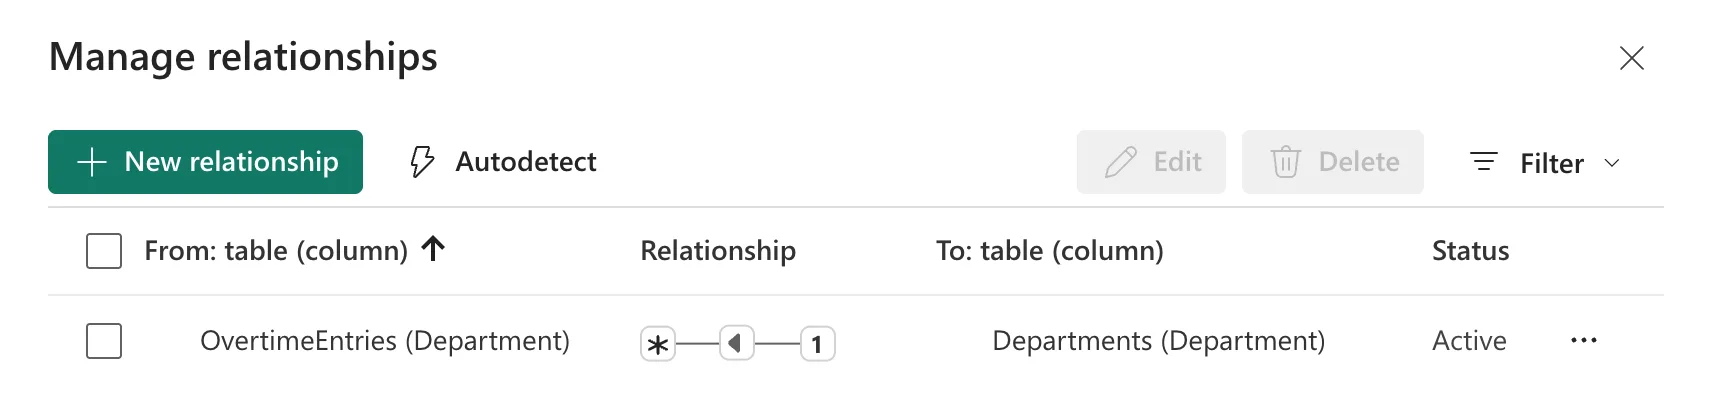
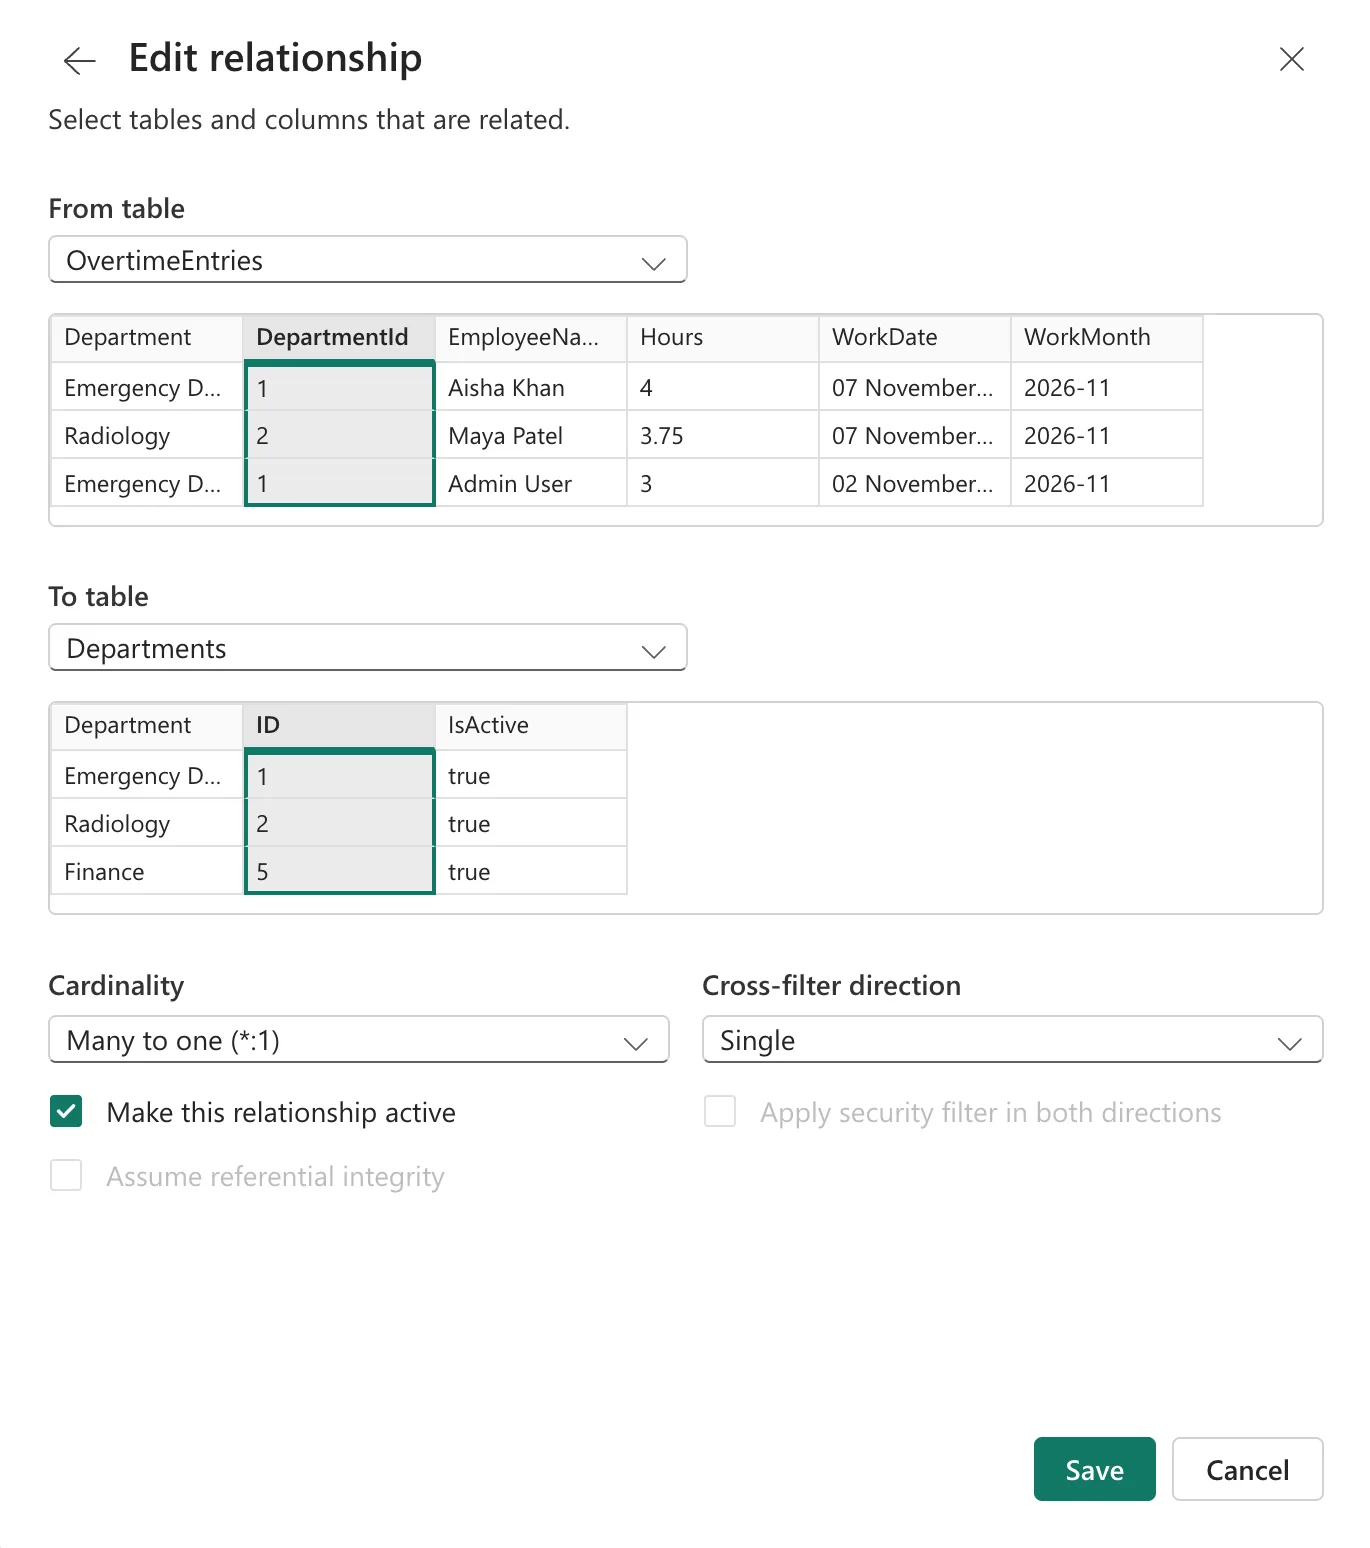
An entry's Department is a snapshot of the name when it was logged (Part 2), and Part 10 lets admins rename departments. DepartmentId doesn't change, so I edited the relationship to DepartmentId and ID, Many to one, Single (How to Create a Relationship Between Two Tables in Power BI):
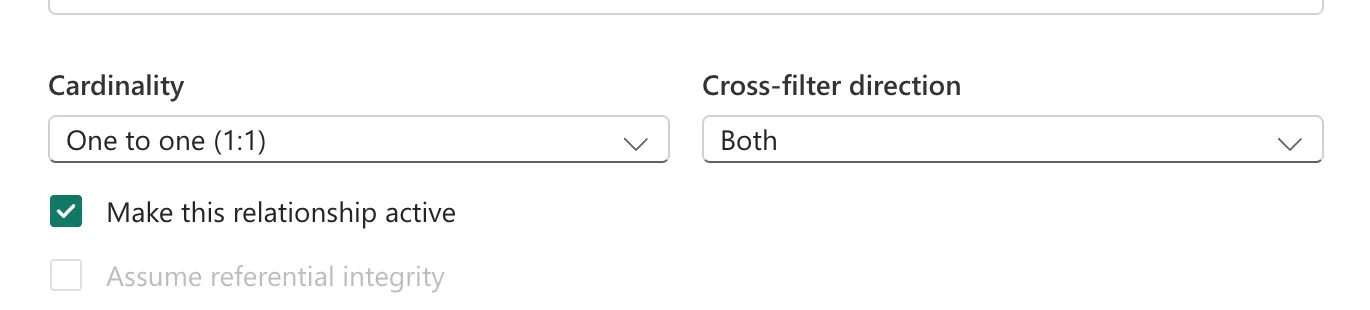
Then a new relationship from Department approvers (ID) to Departments (ID). Power BI filled in One to one (1:1) and Both, because each department had one approver that day, and offered no Apply security filter in both directions (Fixed: Apply Security Filter in Both Directions Is Missing in Power BI):
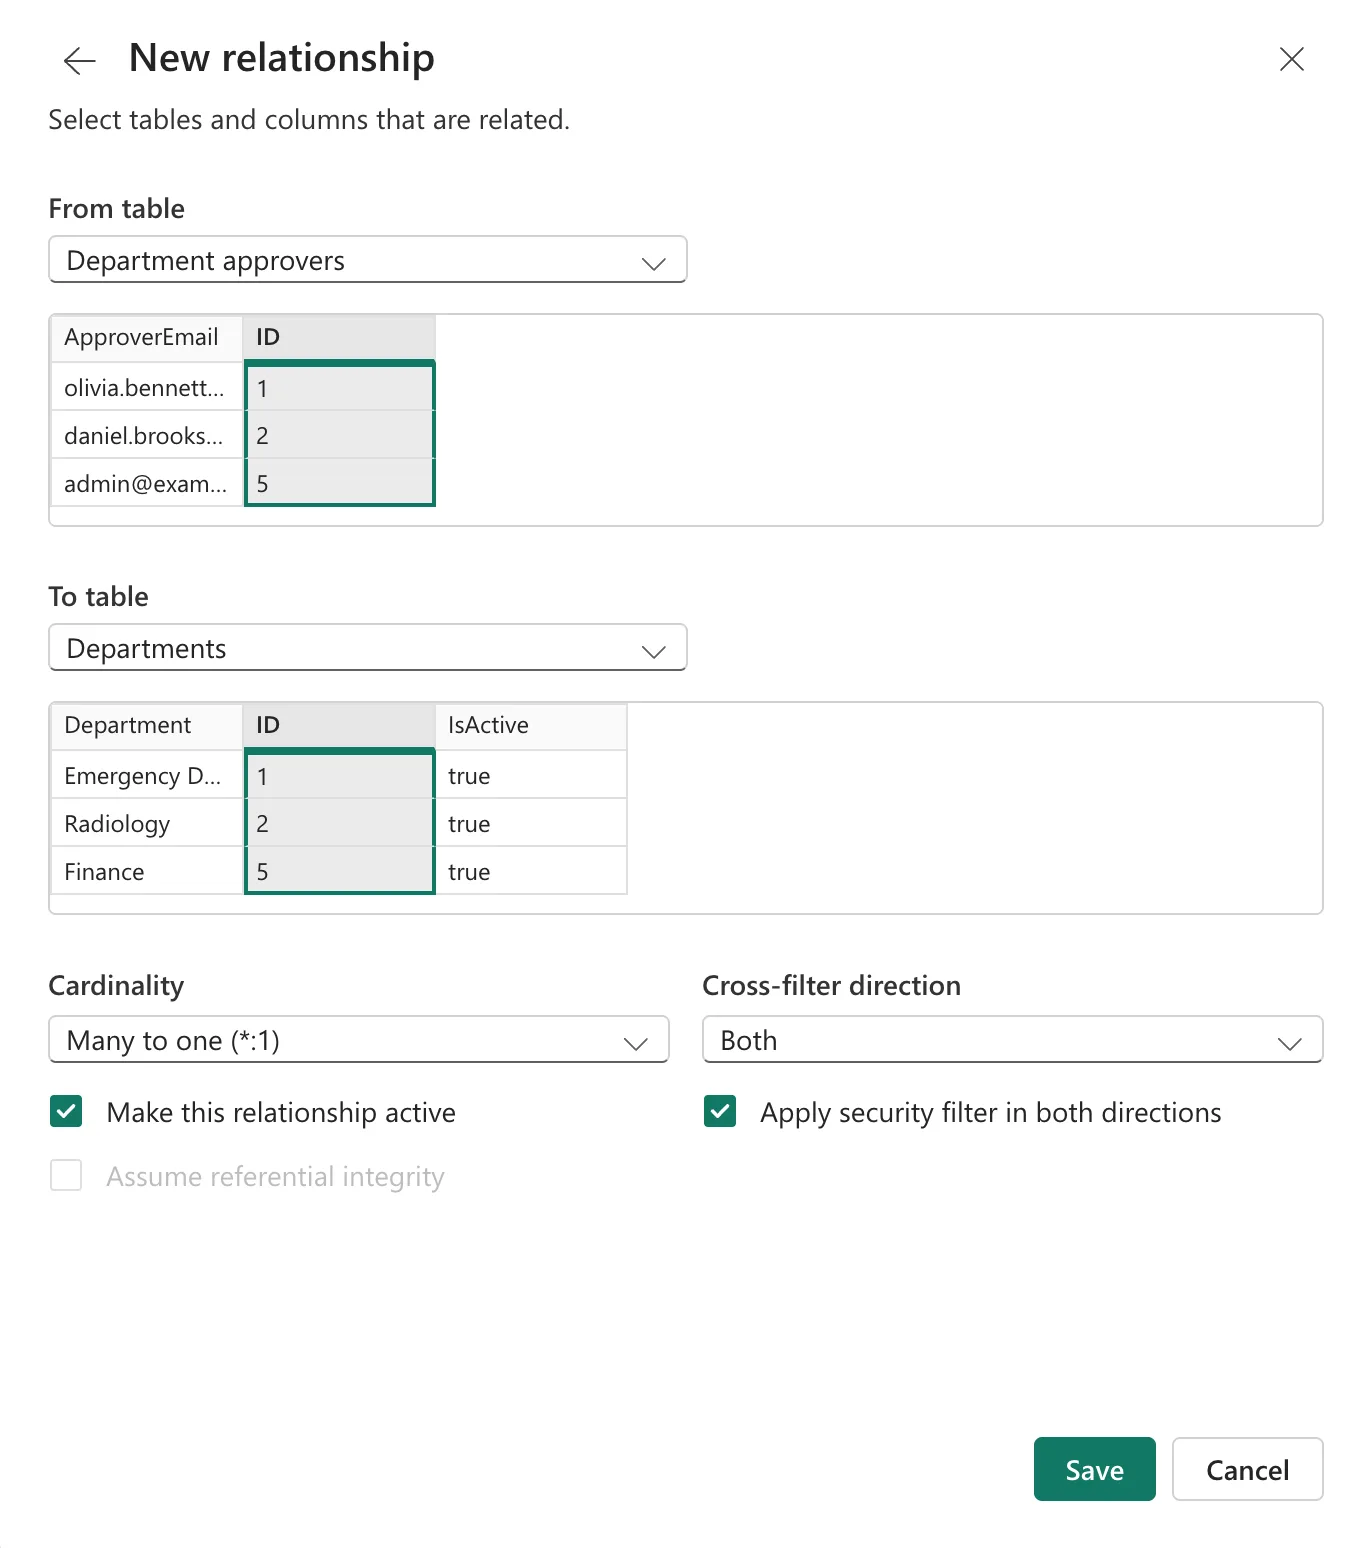
A department can have several approvers, so set Many to one (*:1), Both, and tick Apply security filter in both directions, which carries the role's filter from the approvers to Departments (How to Make a Relationship Filter in Both Directions in Power BI):
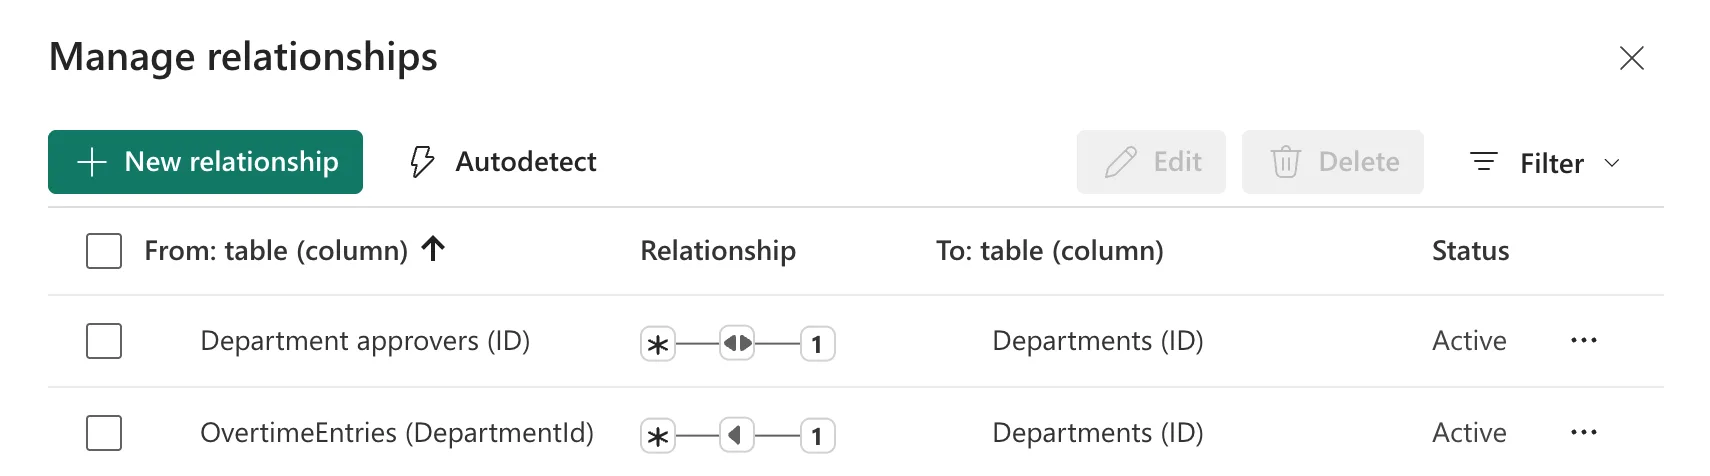
The two relationships:
Step 7: Add the Measures
Select OvertimeEntries and New measure, three times (How to Create a Measure in Power BI in the Browser):
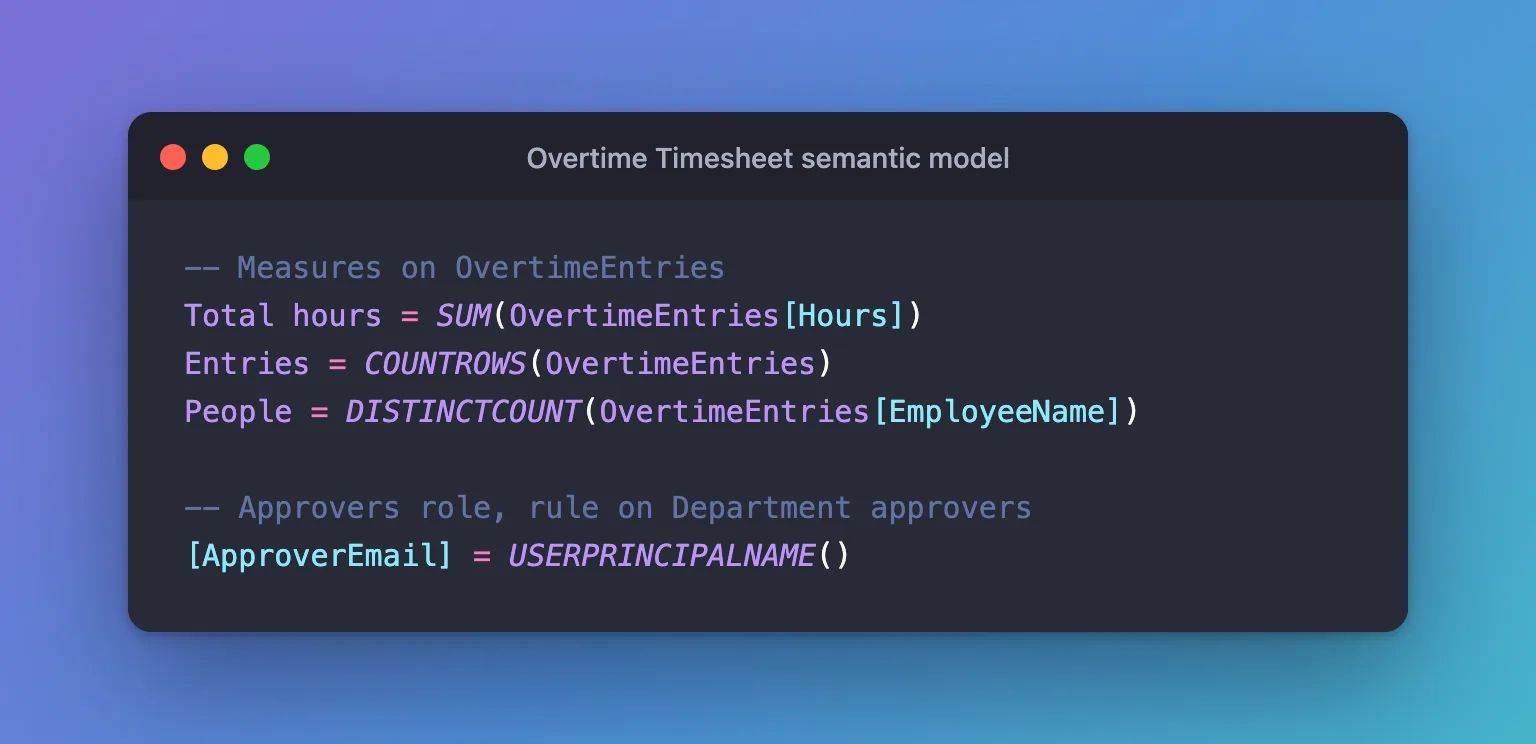
Total hours = SUM(OvertimeEntries[Hours])
Entries = COUNTROWS(OvertimeEntries)
People = DISTINCTCOUNT(OvertimeEntries[EmployeeName])
- Total hours adds up the approved hours (How to Add Up a Column in Power BI with SUM).
- Entries counts the approved entries (How to Count Rows in Power BI with COUNTROWS).
- People counts different people (How to Count Distinct Values in Power BI with DISTINCTCOUNT). It counts names, not emails: Part 12 imported a former employee, Ben Harris, with no email, and DISTINCTCOUNT counts a blank as a value.

Step 8: Add the Roles
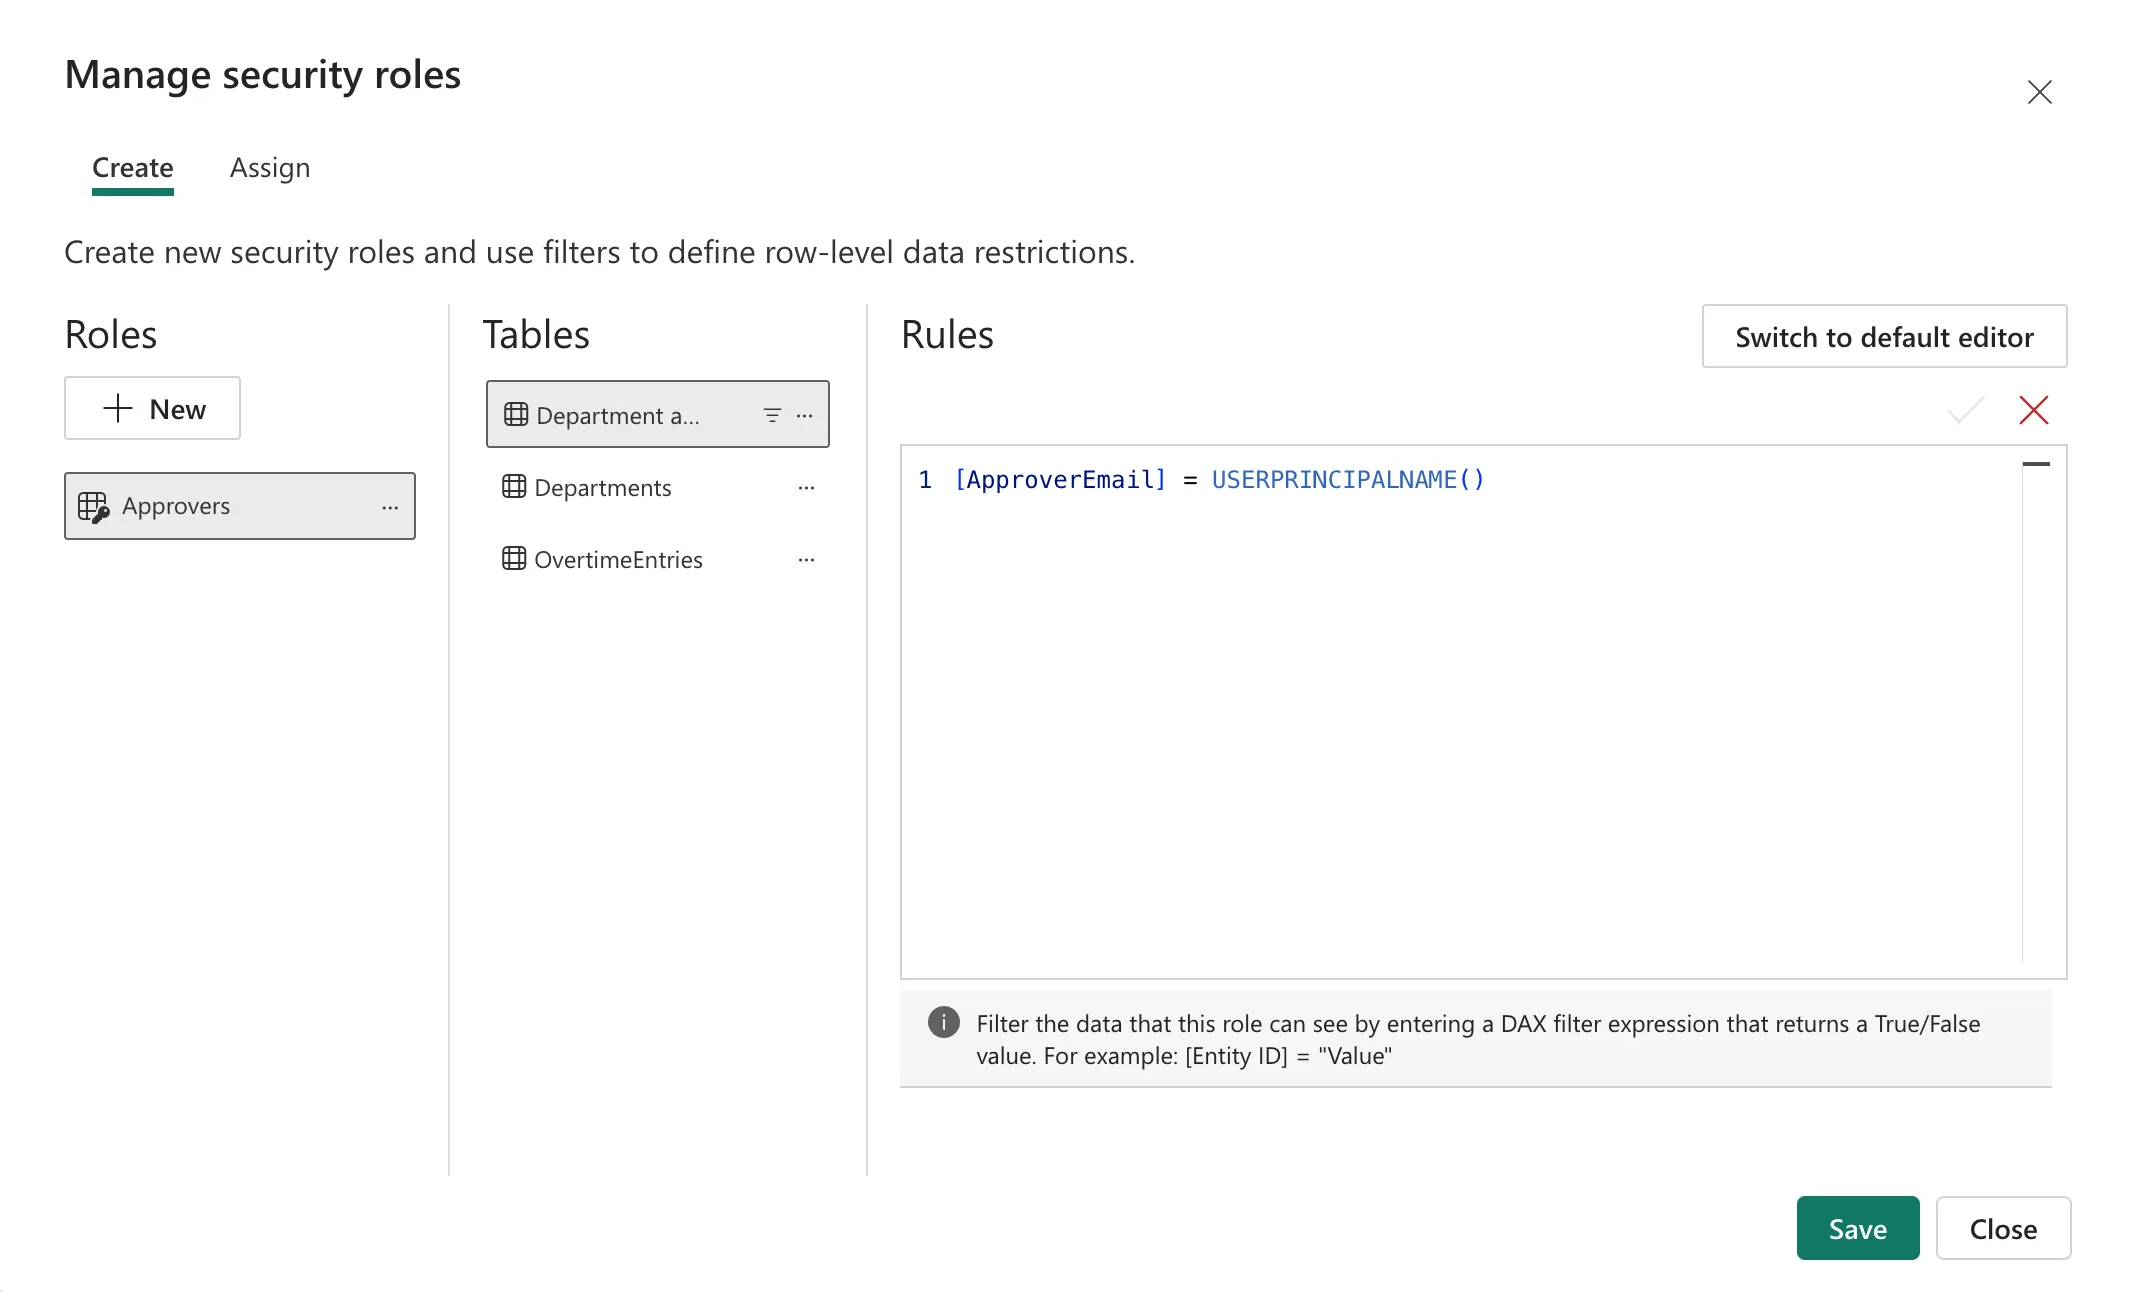
Select Manage roles (How to Add Row-Level Security Roles in Power BI in the Browser). The Approvers role filters Department approvers, in the DAX editor:
[ApproverEmail] = USERPRINCIPALNAME()
USERPRINCIPALNAME() is the signed-in user (How to Get the Signed-In User in Power BI with USERPRINCIPALNAME). The rule keeps that person's approver rows; the relationships then keep their departments, and those departments' entries.
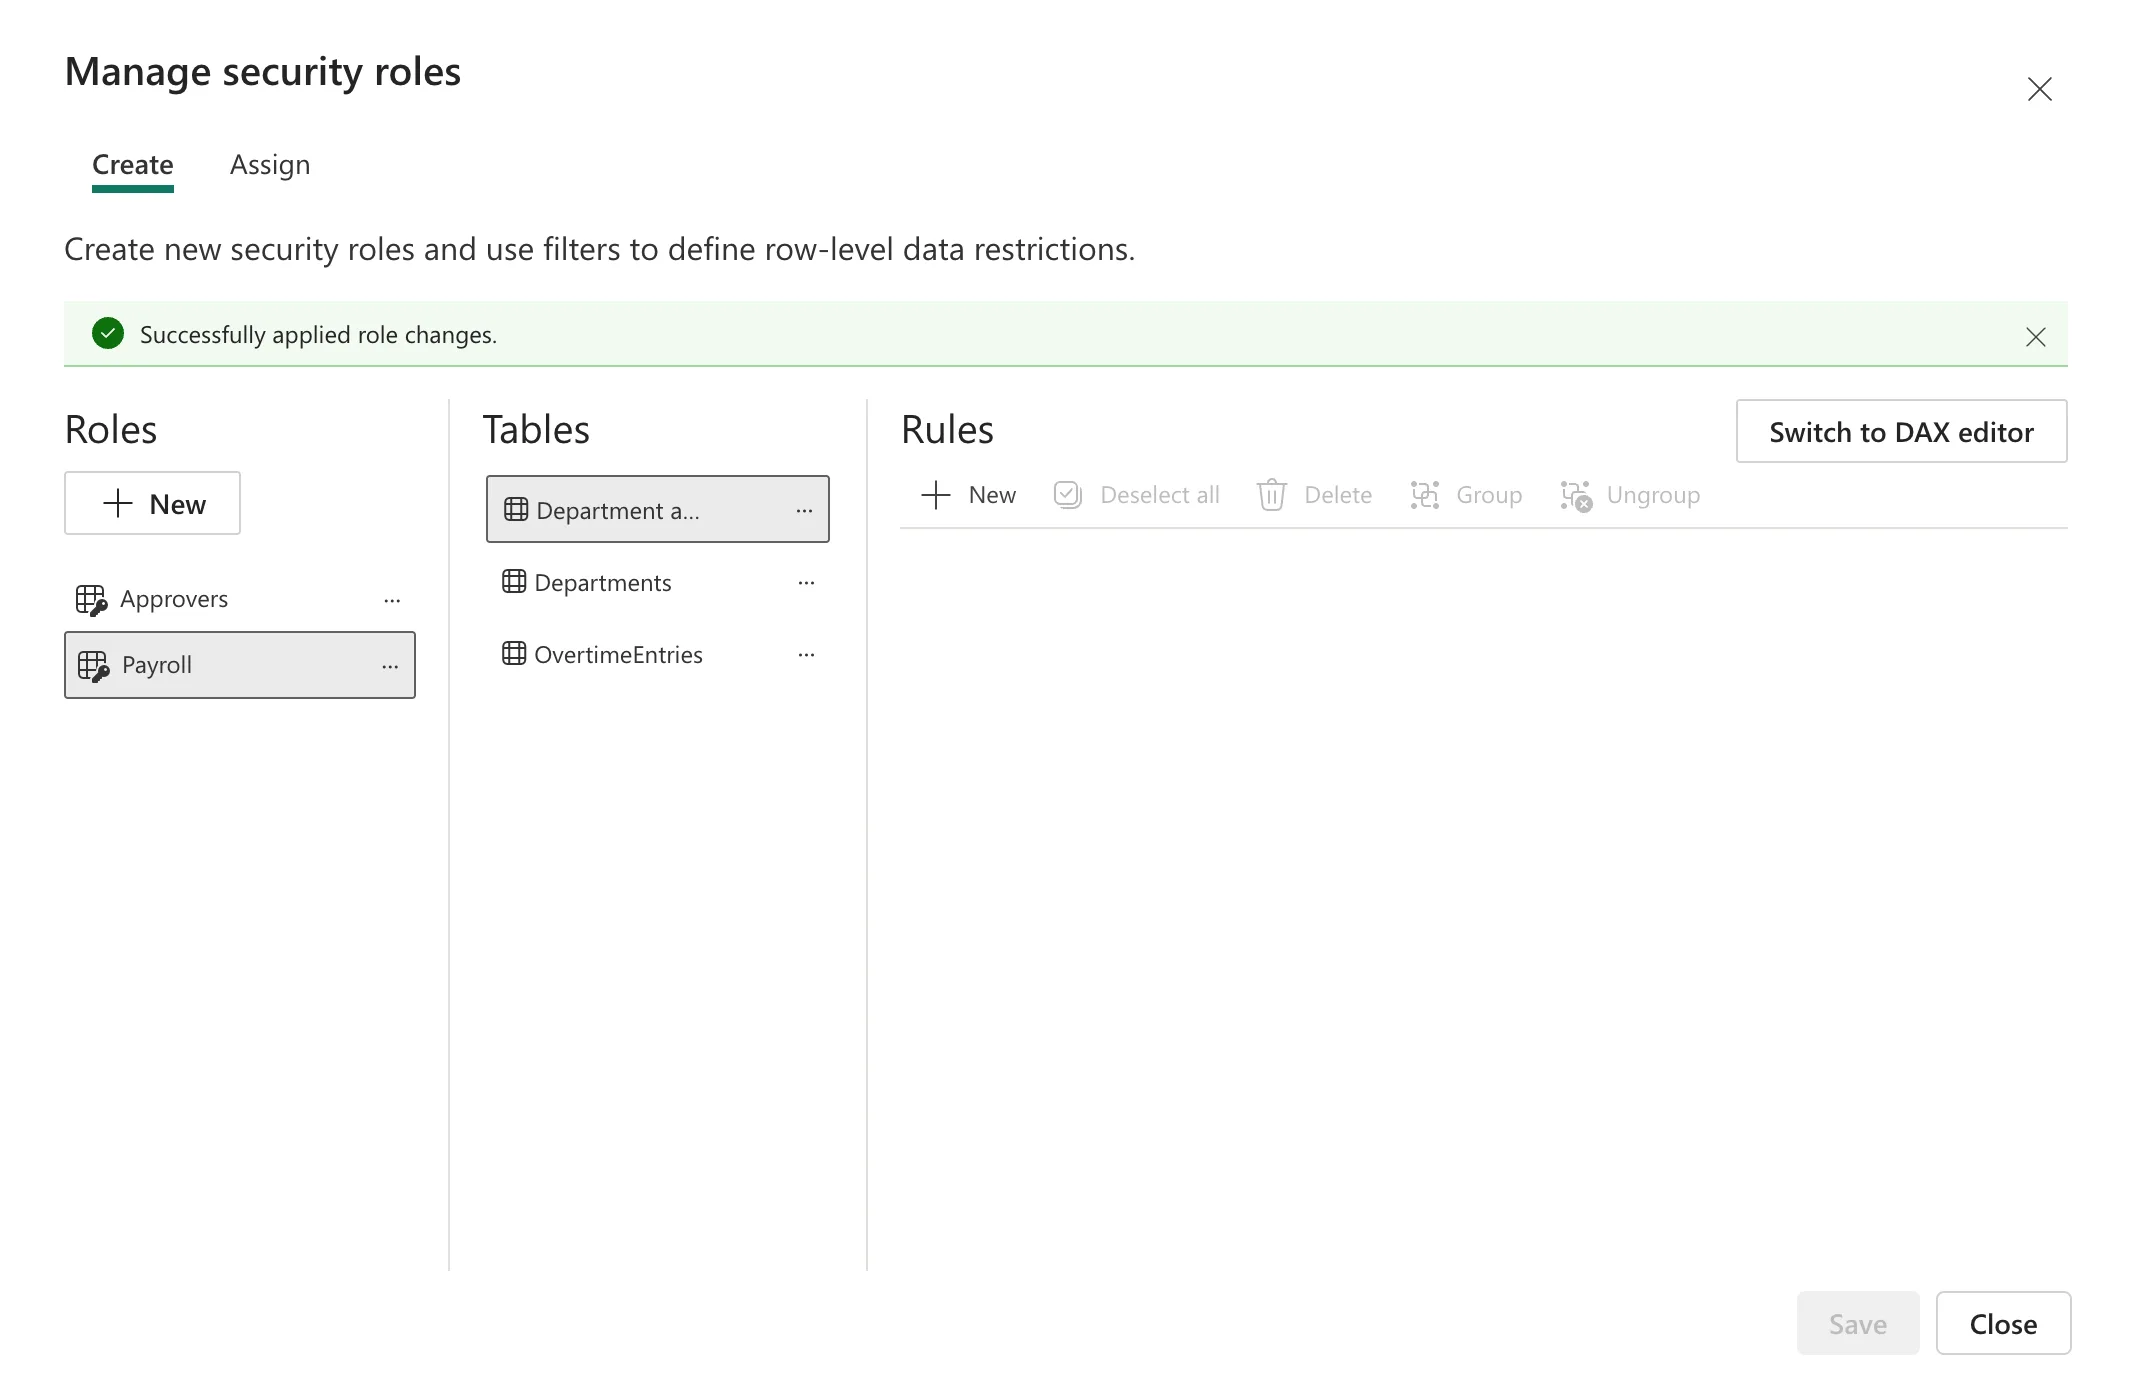
The Payroll role gets no rule at all, so it sees every row:
The model's code, in one place:
Step 9: Build the Report
Select New report in the model editor (How to Create a Report from a Semantic Model in Power BI) and add:
| Visual | Fields | Guide |
|---|---|---|
| Text box | Approved overtime, 24 point, bold | Text box |
| Card | Total hours, Entries, People | Card |
| Slicer | WorkMonth | Slicer |
| Clustered bar chart | Department of Departments, Total hours | Bar chart |
| Clustered bar chart | EmployeeName, Total hours | Bar chart |
| Table | WorkDate, EmployeeName, Department, Hours | Table |
The department chart uses Department from the Departments table, which the roles filter, rather than the entry's snapshot of the name.
Three things went wrong on the way, each with its own fix:
The table showed Year, Quarter, Month and Day instead of WorkDate:
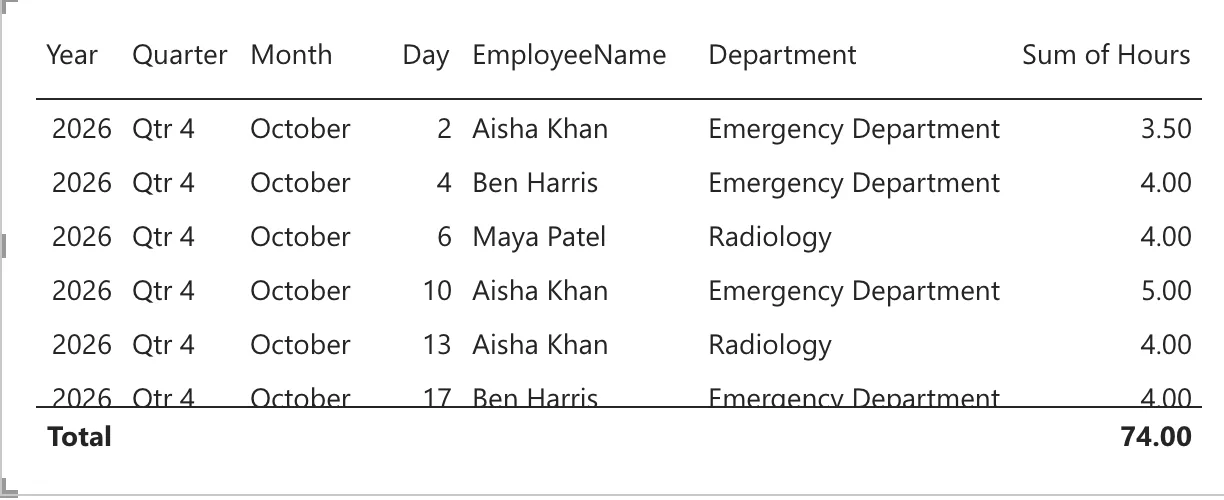
In the Columns well, the field's menu switches from Date Hierarchy to WorkDate (Fixed: Power BI Table Shows Year, Quarter, Month and Day Instead of the Date):
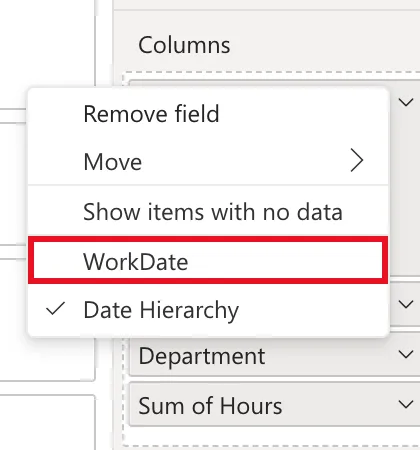
The fonts shrank. The new page was 1920 by 1080, and its text looked small to me, so I changed it to 1280 by 720:
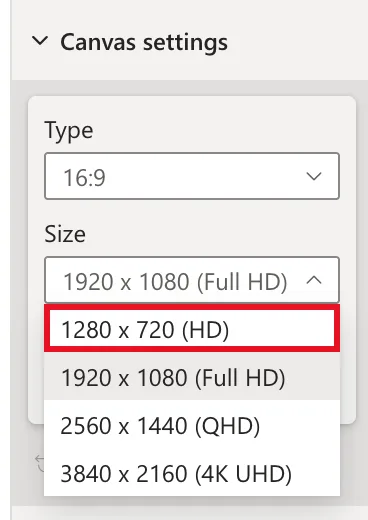
With data labels on, the department chart then warned that it had reduced its fonts, on the axes, legend and labels:
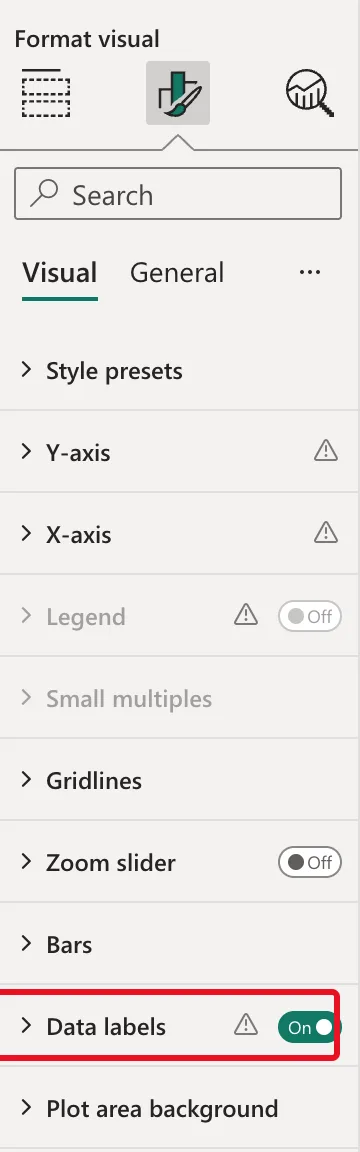
The visuals were too small for their labels. I set the page back to 1920 x 1080 and made every visual one and a half times bigger with exact sizes (Fixed: "Data Label Font Reduced" on a Power BI Visual):
| Visual | Width × height | Position (horizontal, vertical) |
|---|---|---|
| Text box | 1170 × 80 | 30, 20 |
| Card | 1170 × 165 | 30, 120 |
| Slicer | 660 × 165 | 1230, 120 |
| Department chart | 930 × 375 | 30, 300 |
| Person chart | 900 × 375 | 990, 300 |
| Table | 1860 × 375 | 30, 690 |
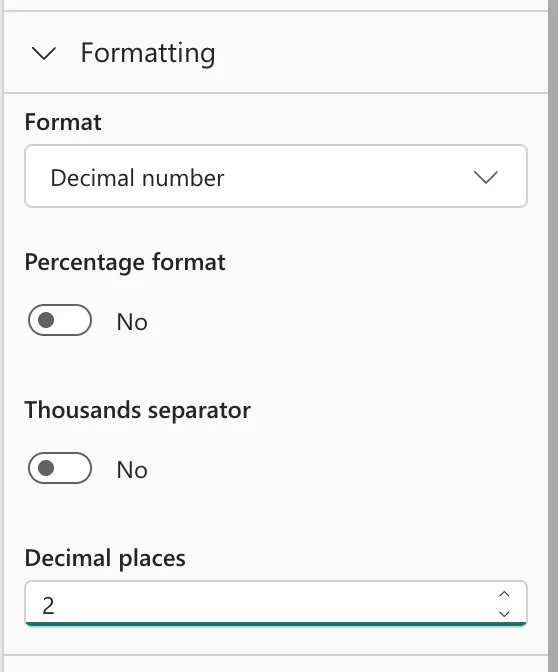
The labels rounded 44.50 to 45. Total hours had the General format. In the model, its Formatting became Decimal number with 2 decimal places (Fixed: Power BI Data Labels Show 45 Instead of 44.50):
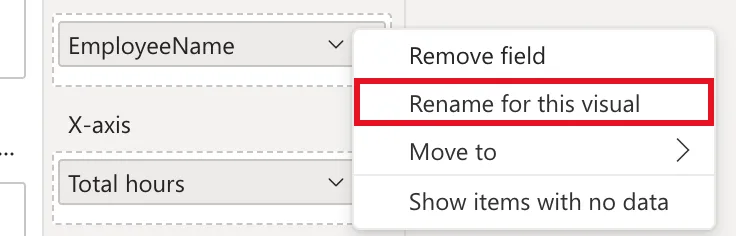
Finally, Rename for this visual gives the readers' names (How to Rename a Field in One Power BI Visual): EmployeeName becomes Person in the person chart and the table, Sum of Hours becomes Hours, and WorkMonth becomes Month in the slicer:
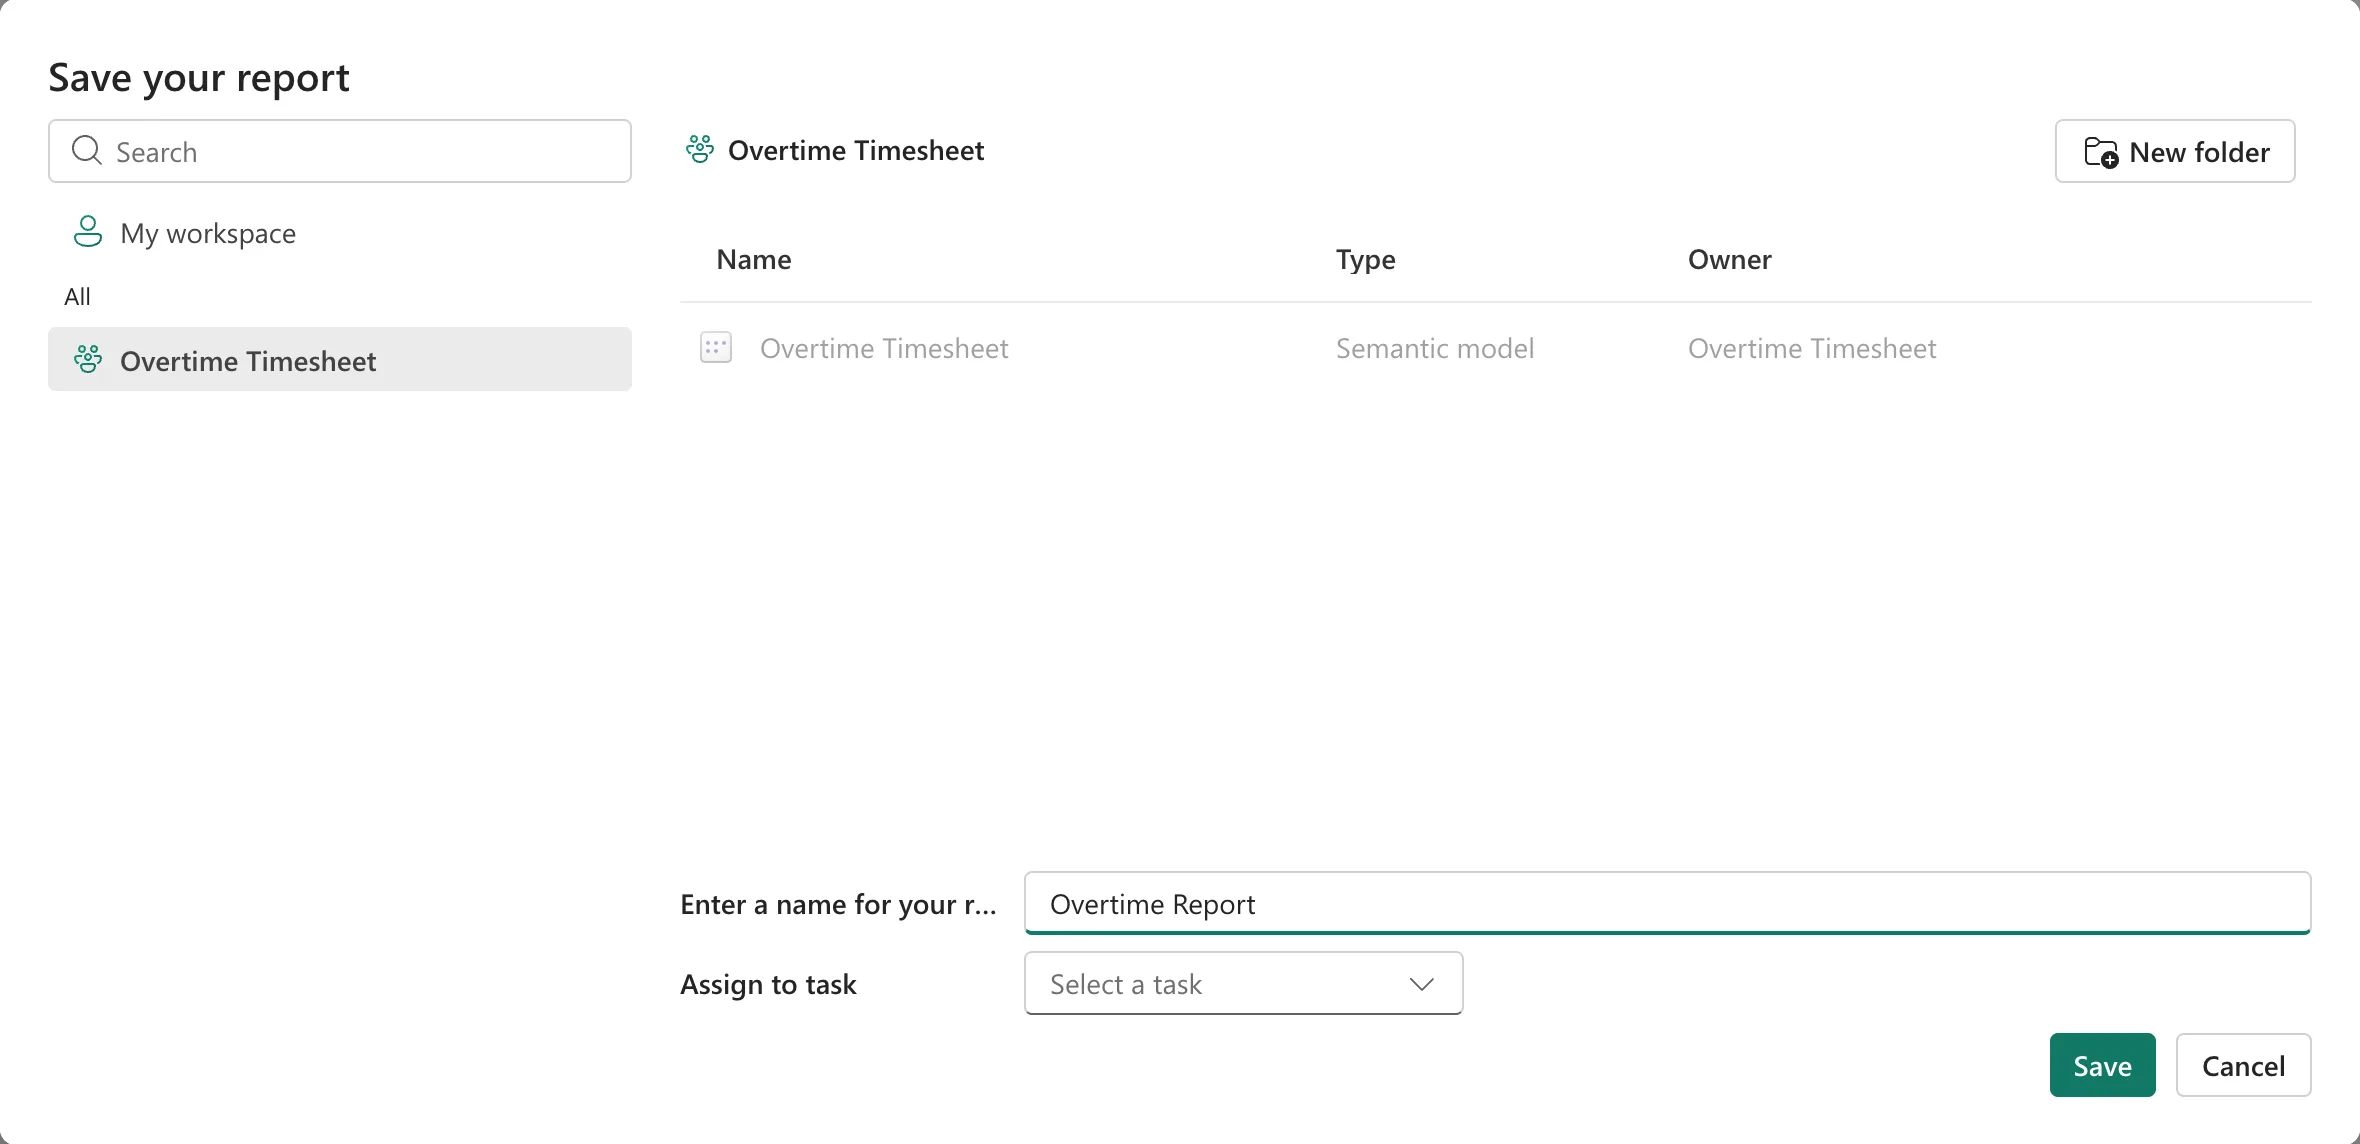
Rename the page Overtime (How to Rename a Page in a Power BI Report), and save the report as Overtime Report in the Overtime Timesheet workspace (How to Save a Report in Power BI in the Browser):
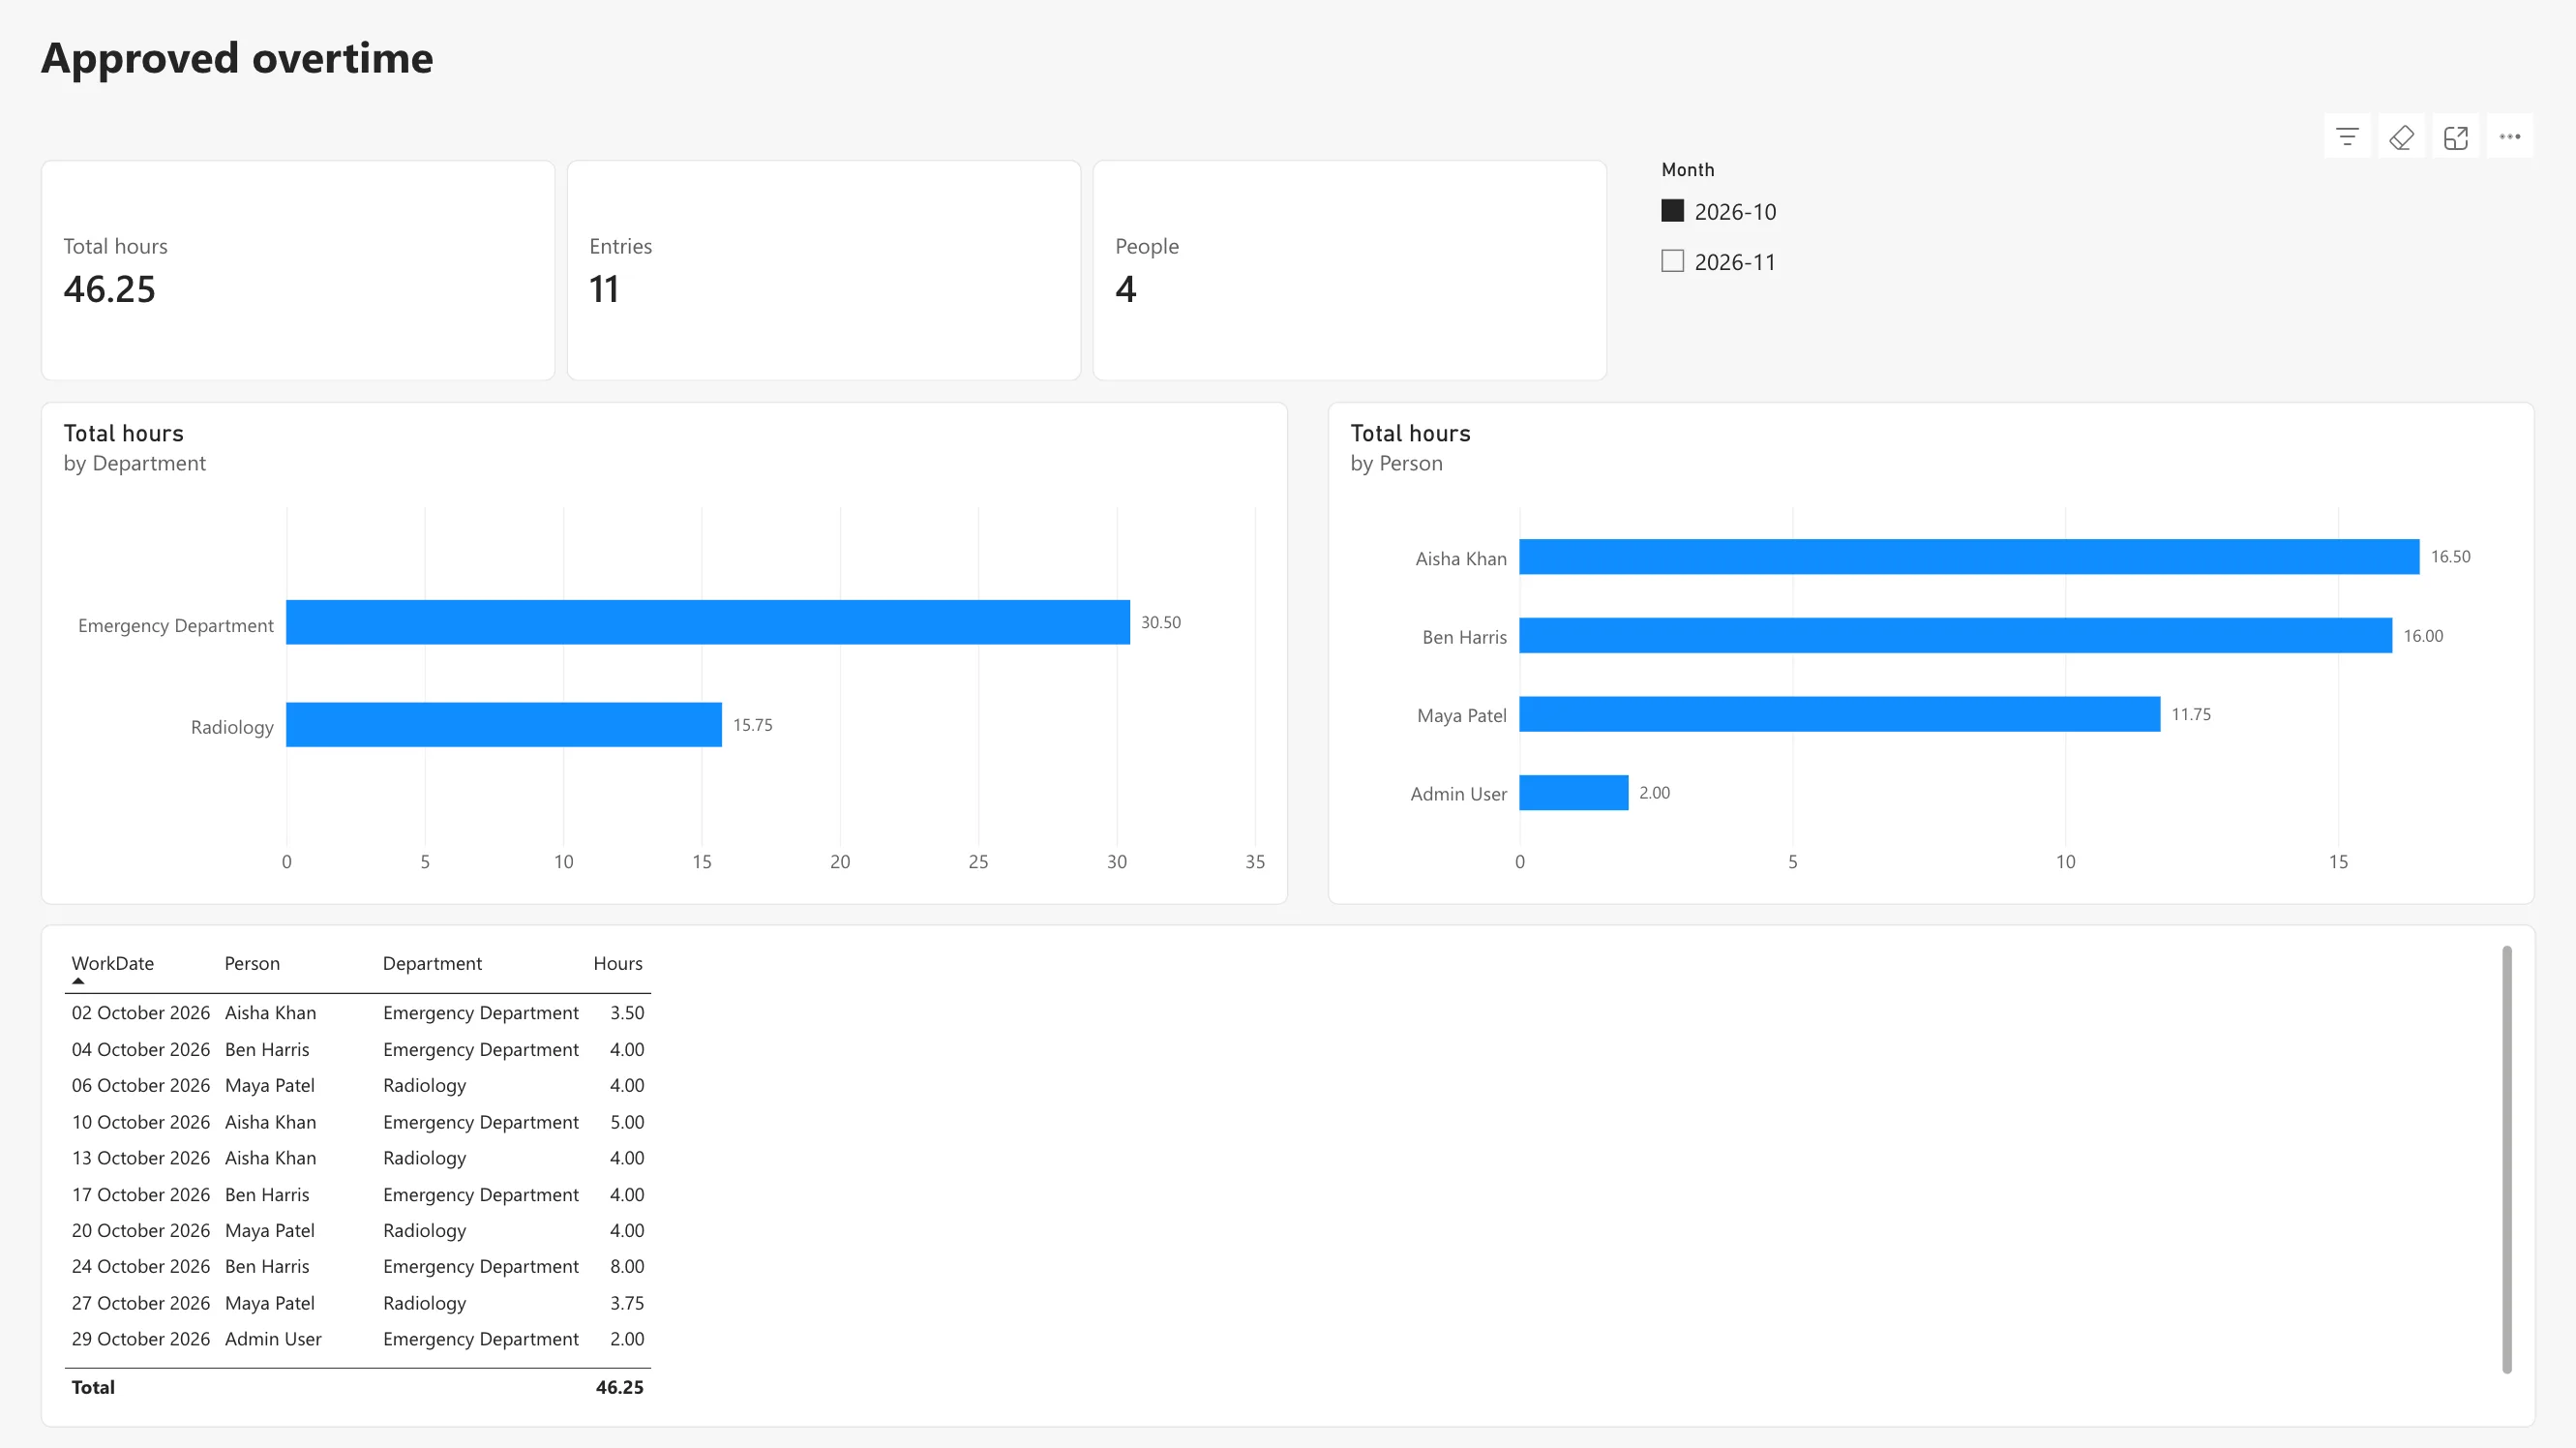
The report shows 74.00 hours from 19 entries by 5 people, as in the picture at the top. Selecting 2026-10 in the slicer gives October: 46.25 hours from 11 entries by 4 people, with 30.50 for the Emergency Department and 15.75 for Radiology, the same as the Reports screen:
Step 10: Schedule the Refresh
The workspace now holds the model and the report:

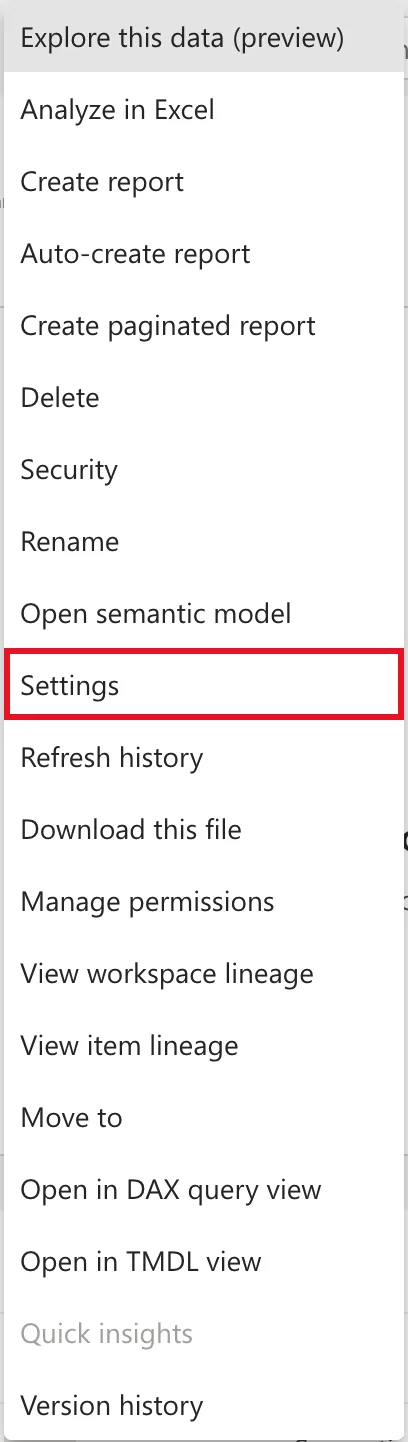
Open the model's More options (...) > Settings (How to Schedule a Refresh of a Power BI Semantic Model):
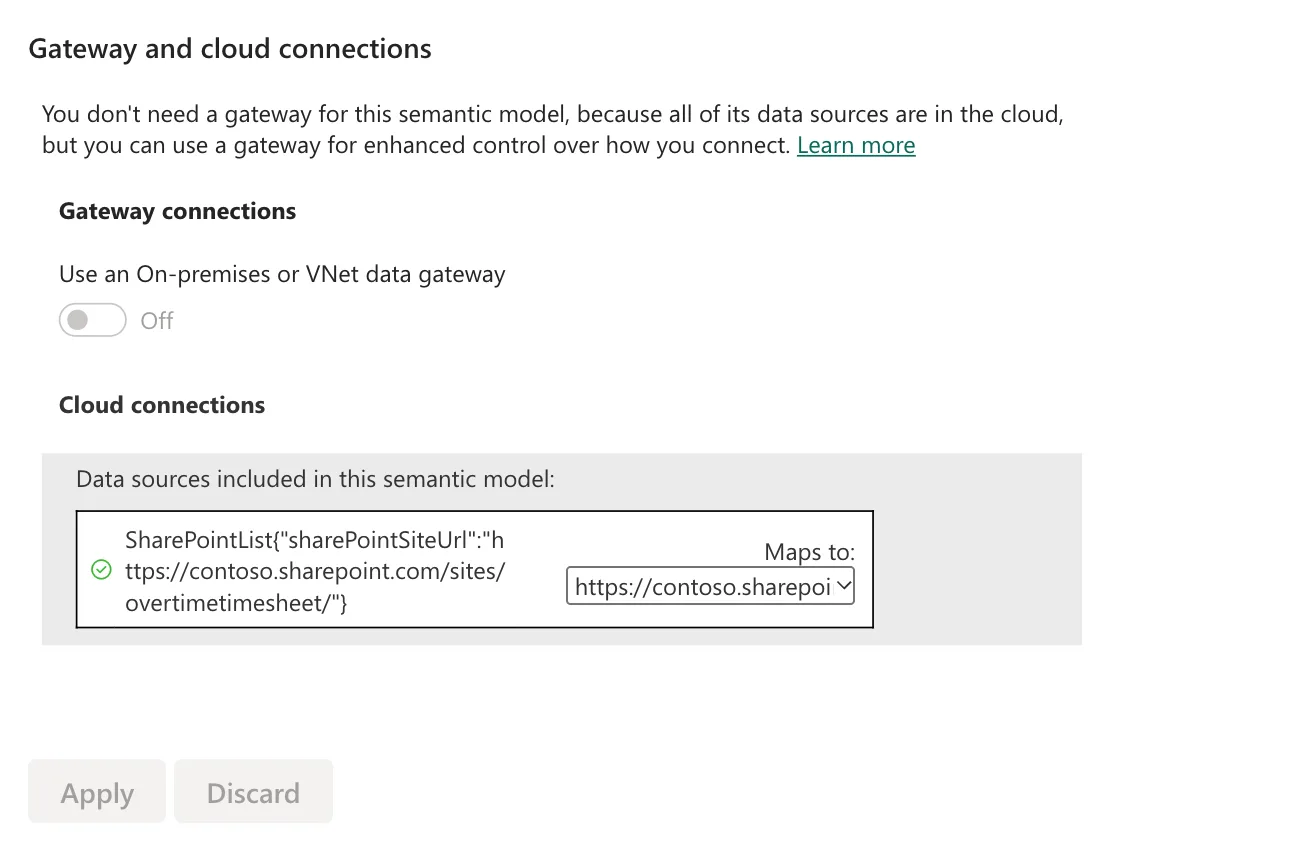
Under Gateway and cloud connections, the SharePoint source maps to the connection chosen in Step 2; no gateway is needed, because the data is in the cloud:
Under Refresh, set the time zone to (UTC) Dublin, Edinburgh, Lisbon, London, turn the schedule On, Daily at 7:00 AM and 1:00 PM, keep the owner notified of failures, and Apply:
Step 11: Give Approvers and Payroll Their Roles
I tested the roles before adding anyone to them. On the model's Security page, Test as role with Approvers showed blanks for me, correctly: I approve only Finance, which has no approved overtime (How to Test Row-Level Security in Power BI):
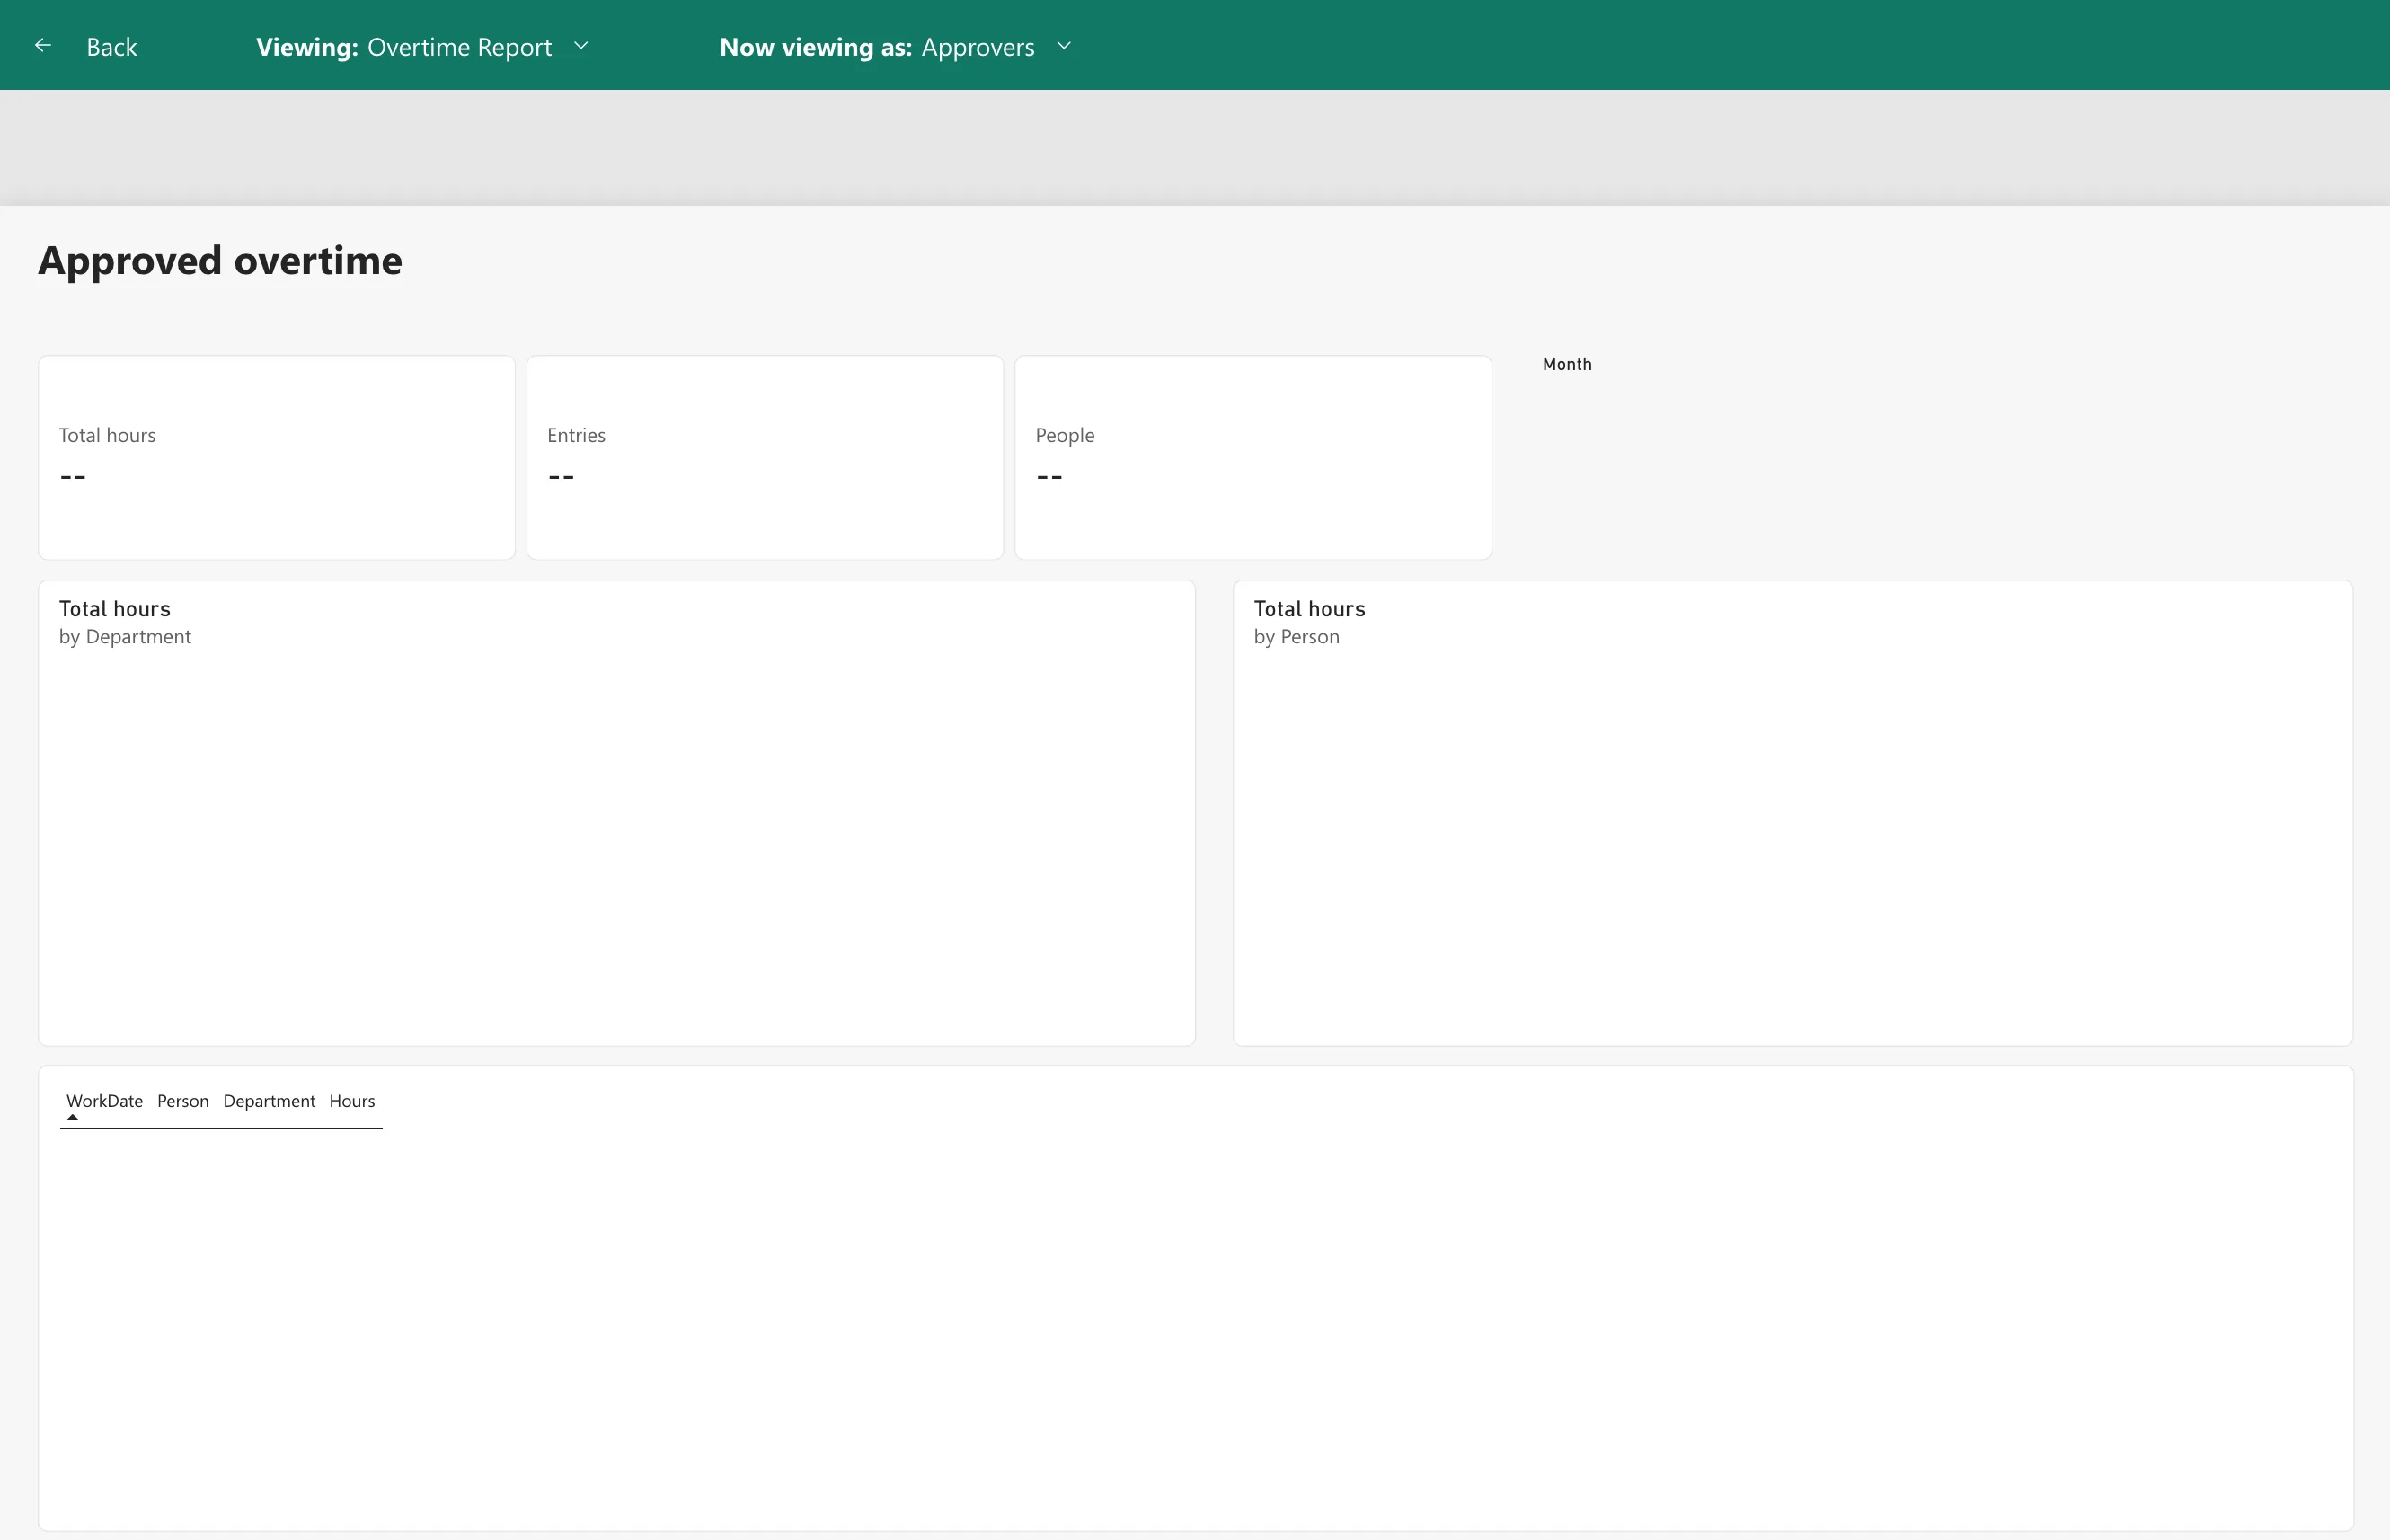
Viewing as Olivia Bennett instead:
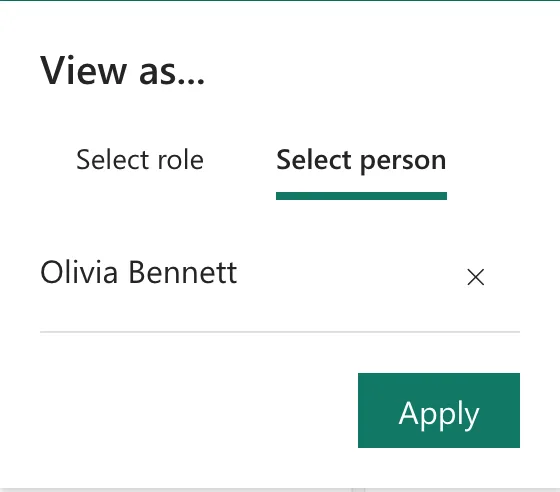
gave This user is not configured for any row-level security roles: the roles had no members yet (Fixed: "This User Is Not Configured for Any Row-Level Security Roles" in Power BI).
On the Security page, add the groups (How to Add Members to a Row-Level Security Role in Power BI). Approvers gets Overtime Timesheet Users, the group of all the app's staff from Part 1:
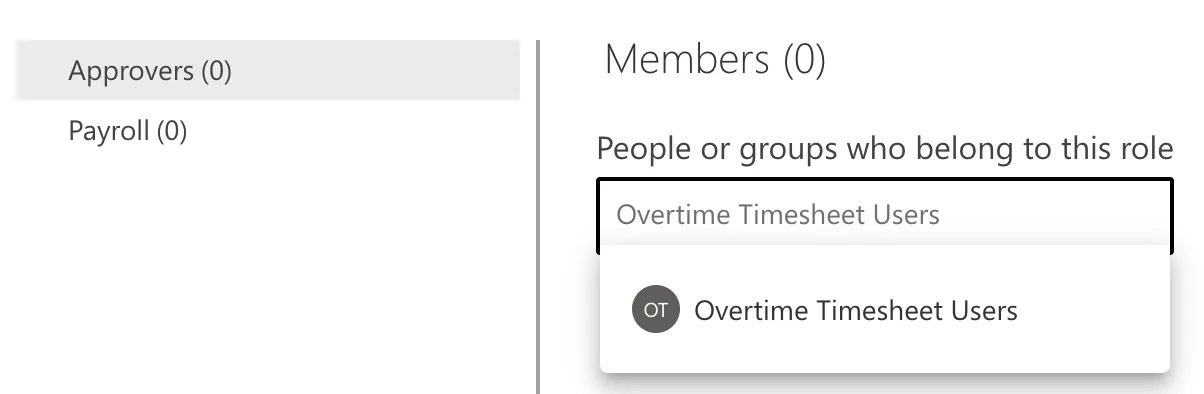
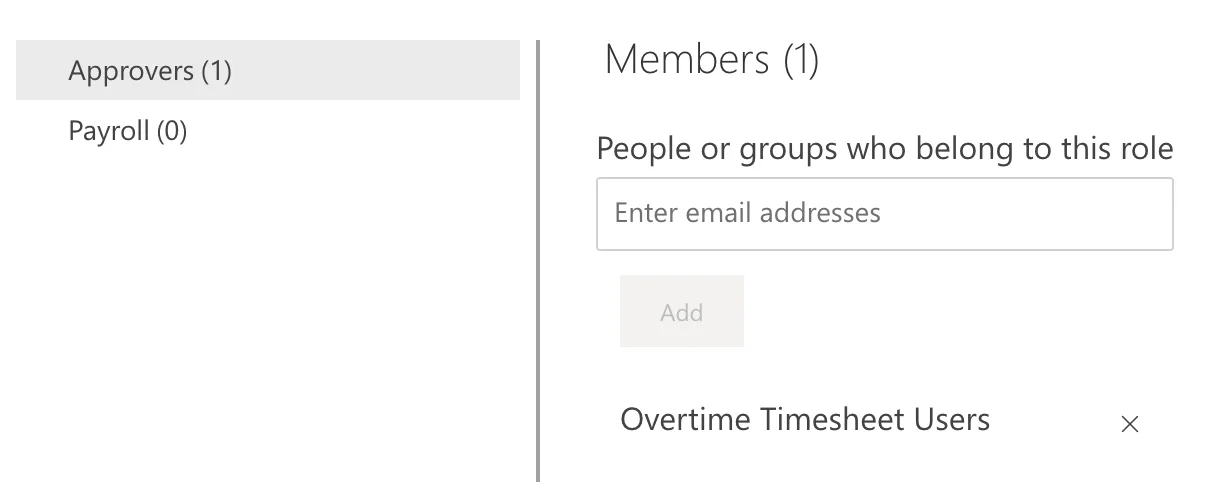
Payroll gets Overtime Payroll:
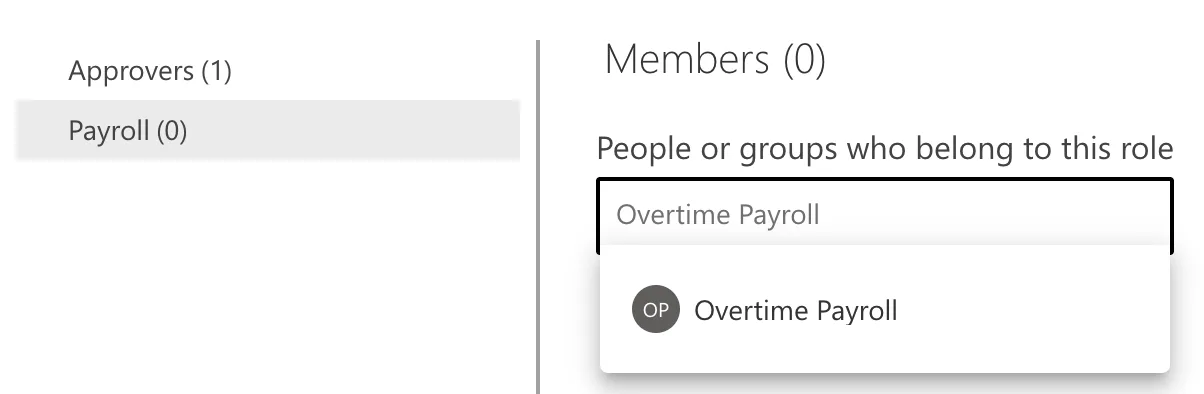
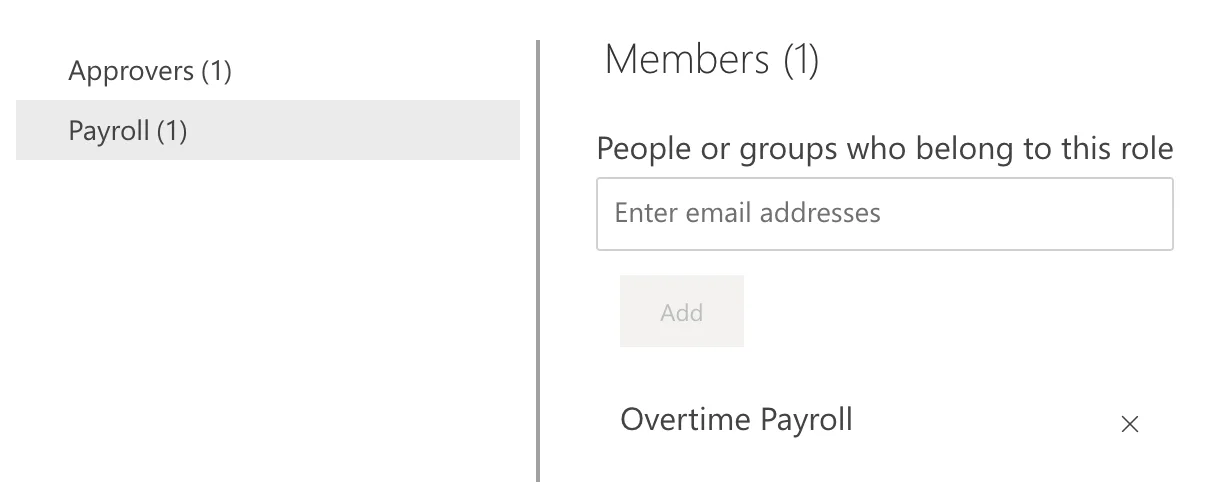
Select Save. Payroll officers are in both groups, and roles add up, so they see everything.
The readers also need the workspace. In Manage access, add Overtime Timesheet Users as Viewer (How to Give Someone Viewer Access to a Power BI Workspace). Viewer is also the only workspace role row-level security applies to:
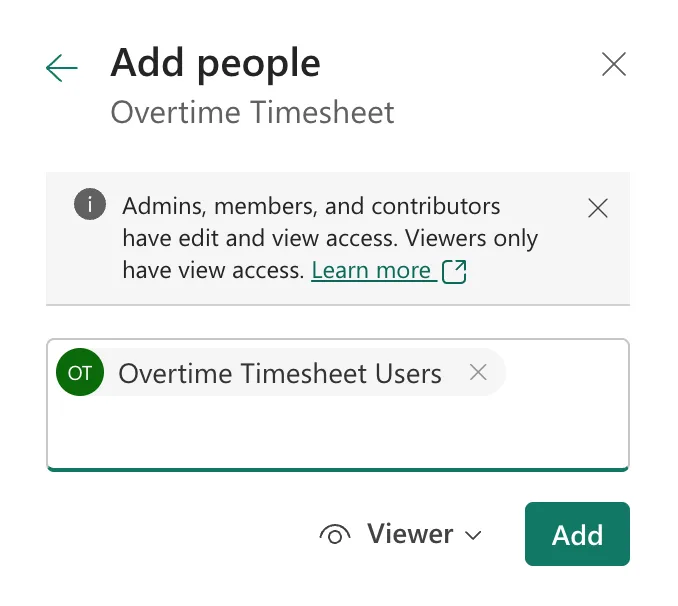
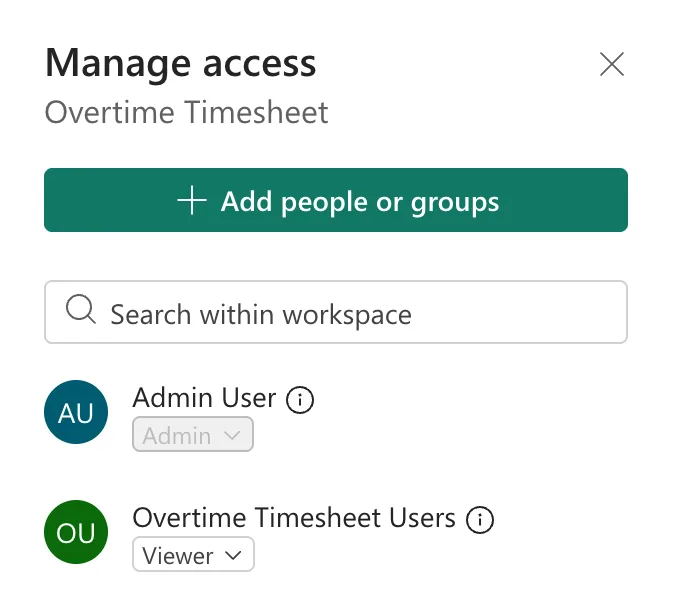
Step 12: Test Each Role
Back on the Security page, Test as role, then Now viewing as each person.
Olivia Bennett, the Emergency Department's approver, sees only her department: 44.50 hours from 11 entries by 3 people:
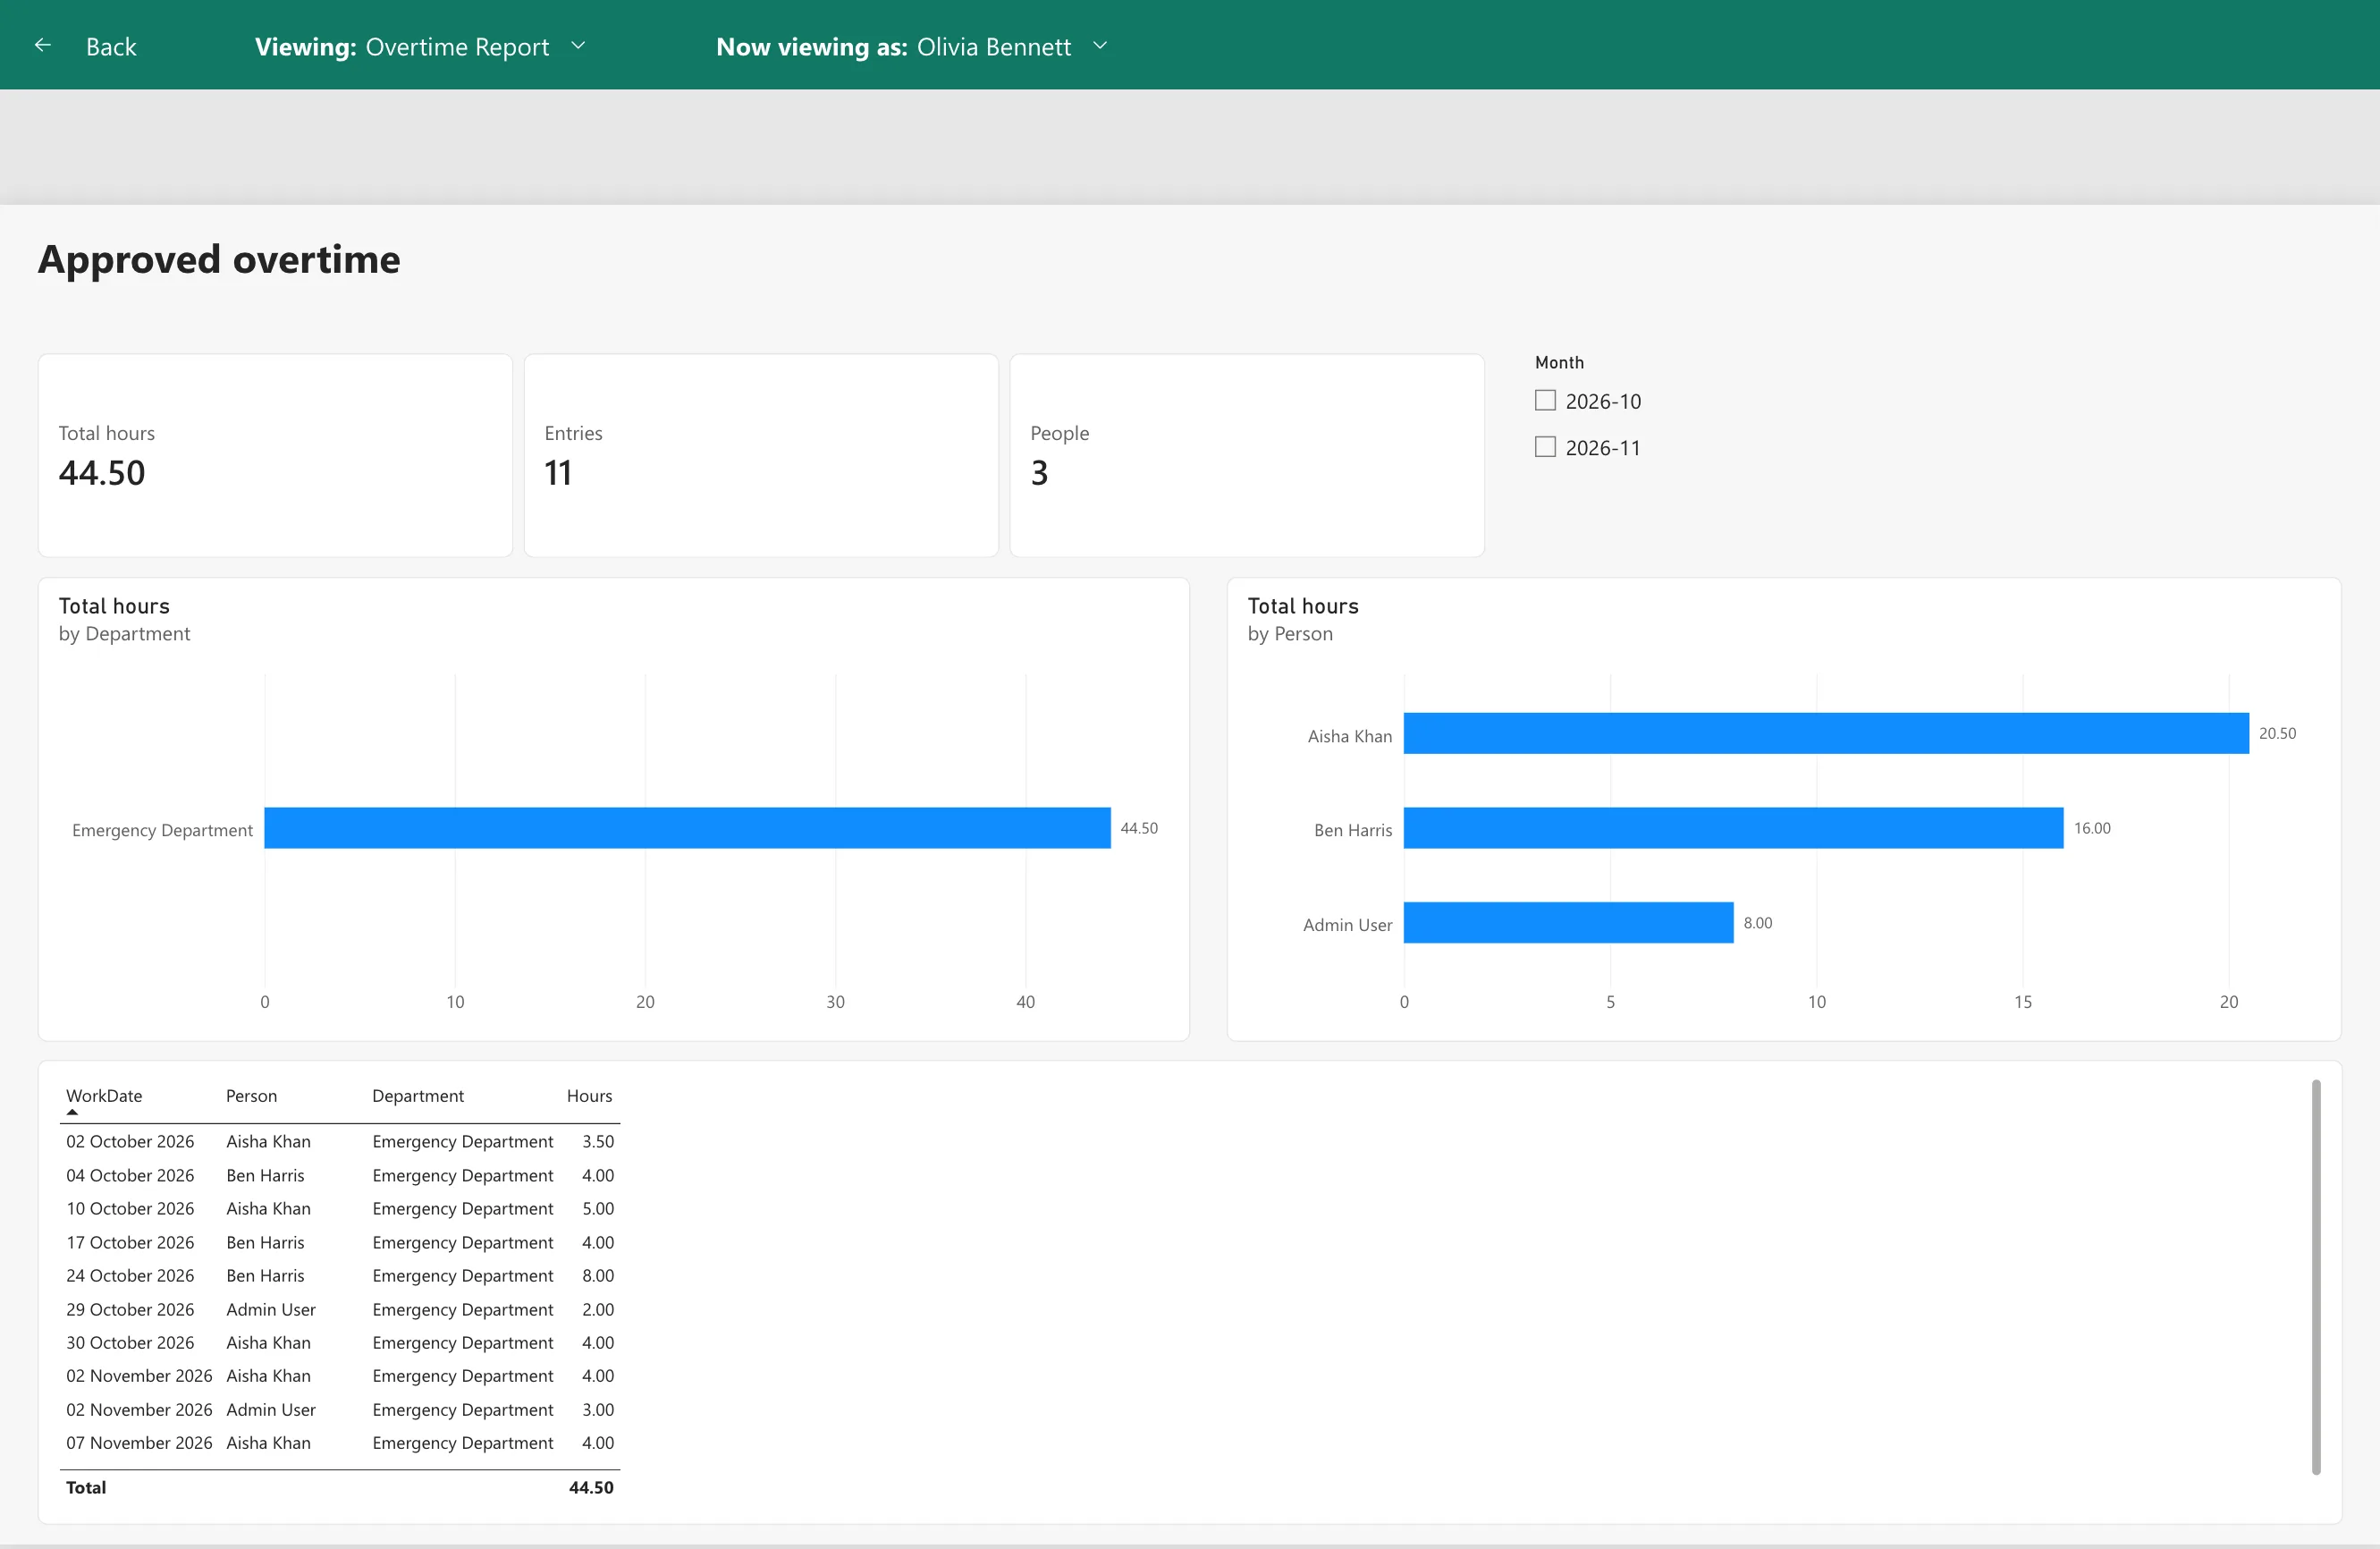
Daniel Brooks, Radiology's approver, sees Radiology: 29.50 hours from 8 entries by 4 people, his own 2.50 hours included, because the report is by department:
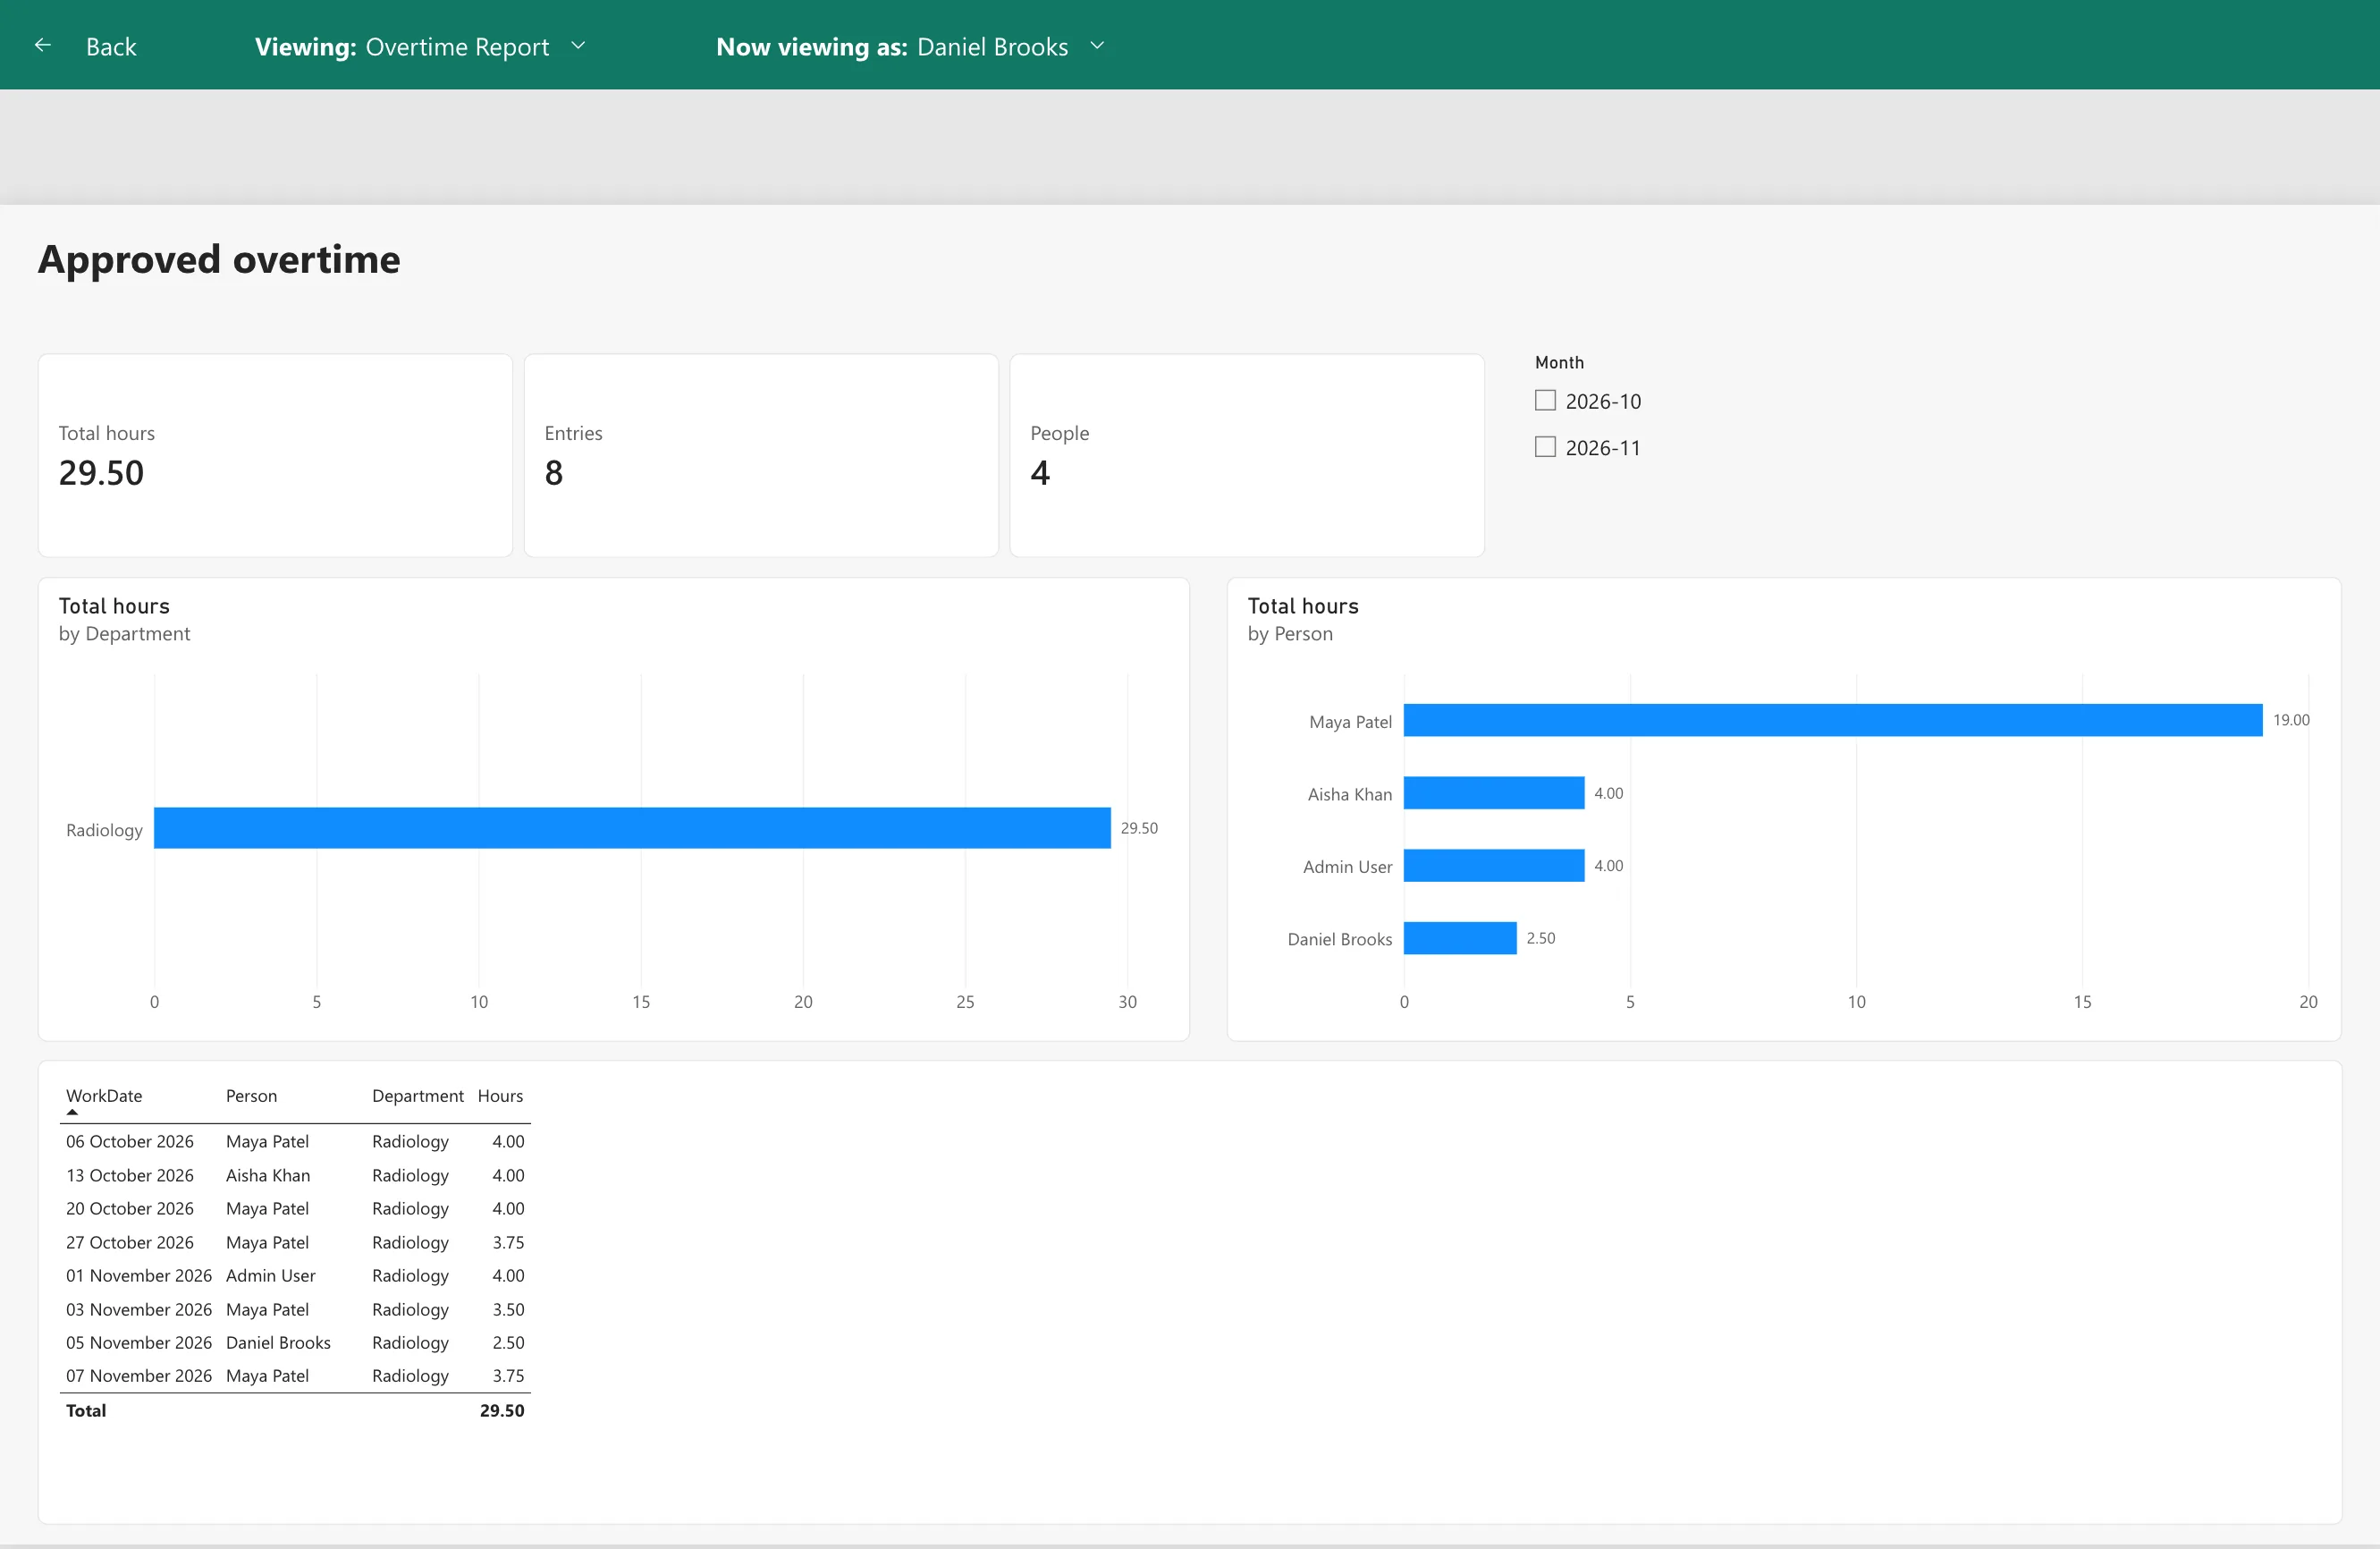
His own entries are still approved by his manager, as Part 8 set up; the report only shows them.
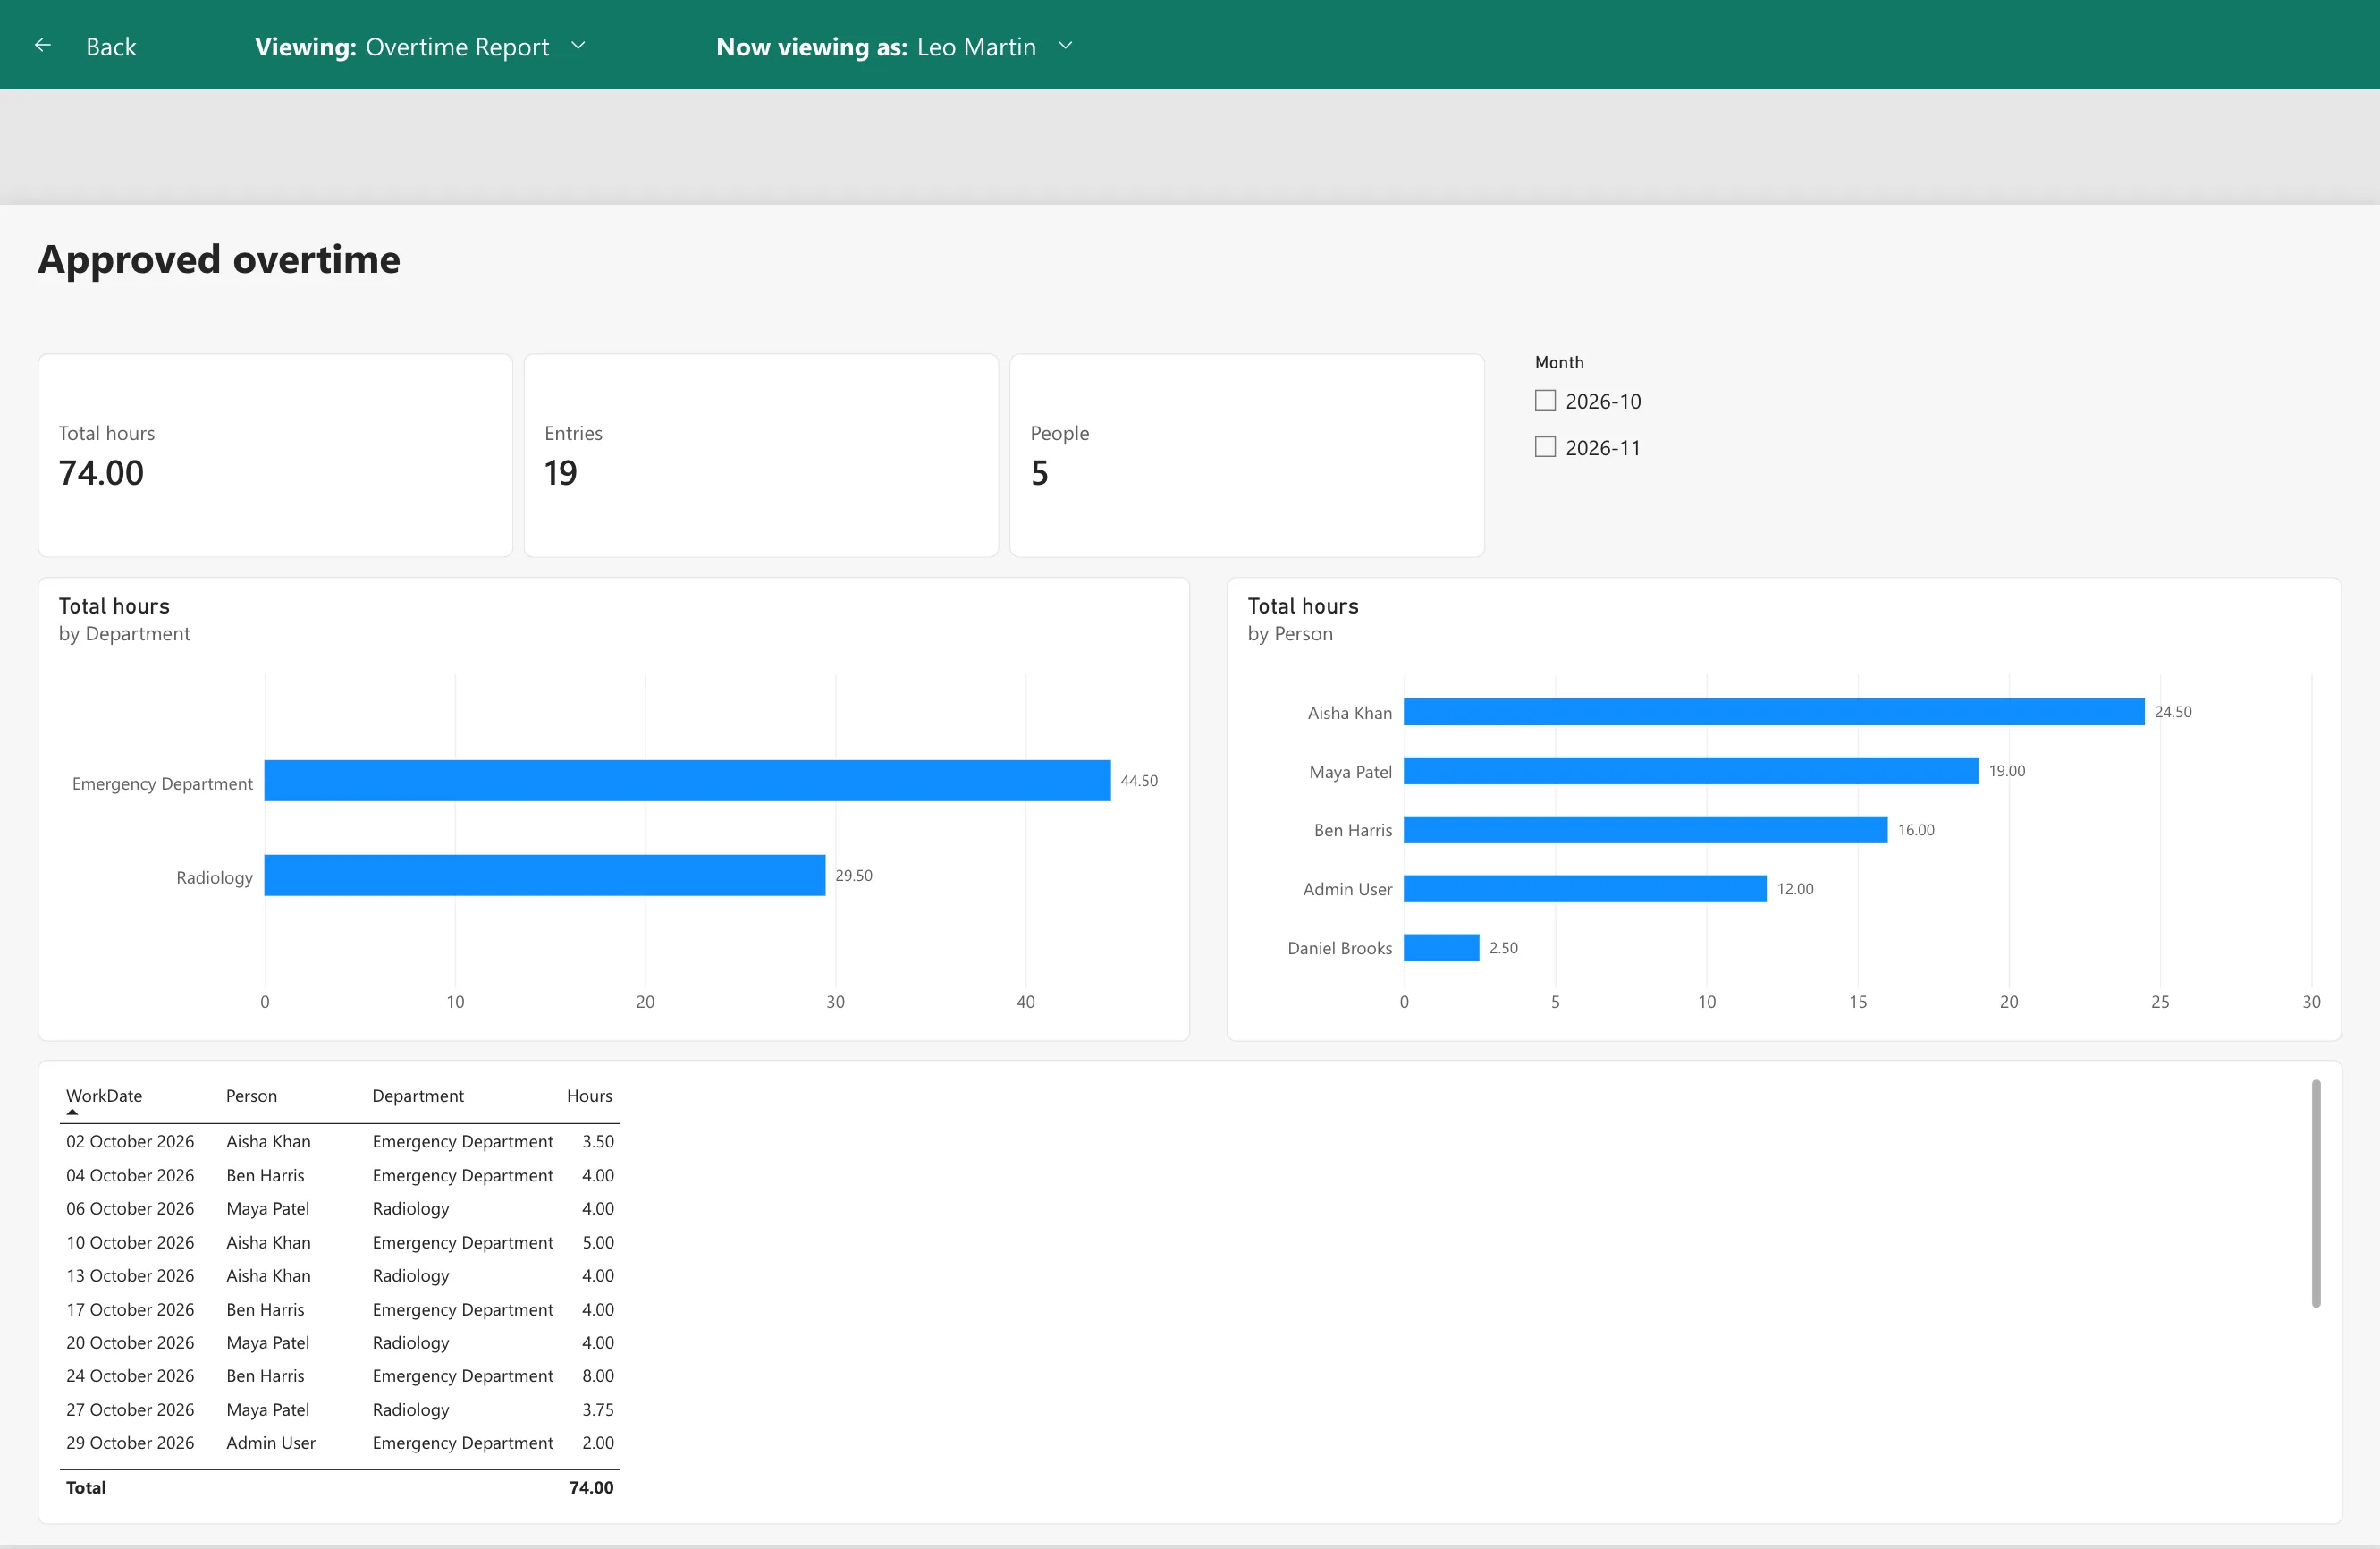
Leo Martin, the payroll officer, sees everything: 74.00 hours from 19 entries by 5 people:
Common Mistakes
| Mistake | What happens | Do this instead |
|---|---|---|
| Loading every entry | Pending and rejected hours appear in the totals | Filter on Status and Approval Status in Power Query |
| Relating entries to departments by name | A renamed department breaks the match | DepartmentId to ID |
| Reference instead of Duplicate for the approvers | The query loses Approvers with Departments | Duplicate |
| Accepting a one-to-one approvers relationship | No security checkbox, and the rule stops at the approvers | Many to one, Both, security filter ticked |
| Making readers Members of the workspace | Row-level security doesn't apply to them | Viewer |
| Adding people instead of groups | Every joiner needs a change in two places | The app's groups |
Troubleshooting
| Symptom | Likely cause | Fix |
|---|---|---|
| Totals differ from the Reports screen | The filters differ | Both Status and Approval Status equal Approved |
| An approver sees every department | They're a workspace Admin, Member or Contributor | Make them a Viewer |
| An approver sees nothing | Their email isn't in the department's Approvers | Check the Departments screen |
| This user is not configured for any row-level security roles | The person isn't in a role | Add their group |
| This user does not have access to the dataset or report | The person isn't in the workspace | Add their group as Viewer |
| Today's approvals are missing | The next refresh hasn't run | Wait for 07:00 or 13:00, or refresh now |
FAQ
Why not use Export to Power BI on the SharePoint list?
That makes a semantic model from the one list you export. This report needs two lists shaped in Power Query first, so it starts from Get Data.
Does this need Power BI Desktop?
No. Every step here runs in the browser, including Power Query, relationships, measures and row-level security.
Can approvers see the reasons for overtime?
No. The model holds six columns of each entry and no reasons; the reasons stay in SharePoint, behind Part 3's permissions.
Why do I see blanks when I test the Approvers role?
Test as role uses your own sign-in. If you approve no department with approved overtime, there's nothing to show. View the report as a specific approver instead.
Conclusion
The Power BI side of the app is in place:
- an Overtime Timesheet workspace and semantic model, built in the browser from the OvertimeEntries and Departments lists, with only entries approved twice;
- a Department approvers table from the departments' Approvers, related so the Approvers role's rule reaches each approver's departments and their entries;
- Total hours, Entries and People measures, and a report with cards, a month slicer, charts by department and by person, and a table;
- a refresh at 07:00 and 13:00 UK time;
- the app's groups as role members and workspace Viewers, tested as an approver of each department and as payroll.
Part 16: Share the App and Add It to Microsoft Teams shares the app with the app's groups and adds it to Microsoft Teams.
Additional Resources
- Edit semantic models in the Power BI service
- Row-level security (RLS) with Power BI
- Power Query SharePoint Online list connector
- Configure scheduled refresh
- Power BI service features by license type
← Previous: Part 14: Create the Payroll Workbook from the App Next → Part 16: Share the App and Add It to Microsoft Teams
