Build an Overtime Timesheet App in Power Apps — Part 11: Build the Reports Screen

Approvers and payroll need to see how much overtime was approved each month, by department and by person, without reading other people's entries in SharePoint. This part builds the Reports screen: a flow that returns one month's approved overtime that the person may see, and a screen with the total, a chart by department and a list of people.
This is Part 11 of a 20-part series.
- Part 1: Plan the App and Set Up the Demo Organization
- Part 2: Create the SharePoint Site and Lists
- Part 3: Keep Overtime Private with SharePoint Permissions
- Part 4: Create the Solution, Environment Variables and Canvas App
- Part 5: Build the Home Screen
- Part 6: Build the Log Overtime Screen
- Part 7: Build the My Overtime Screen
- Part 8: Build the Approval Flow for Teams and Outlook
- Part 9: Show Approvers What's Waiting
- Part 10: Build the Departments Screen
- Part 11: Build the Reports Screen (you are here)
- Part 12: Import the Old Excel Timesheet (coming soon)
- Part 13: Create the Monthly Payroll Workbook with Office Scripts (coming soon)
- Part 14: Build the Power BI Overtime Report (coming soon)
- Part 15: Share the App and Add It to Microsoft Teams (coming soon)
- Part 16: Test Every Role and Department (coming soon)
- Part 17: Build a Setup Flow That Creates the Lists (coming soon)
- Part 18: Run the Solution Checker and Export the Solutions (coming soon)
- Part 19: Install the App in a New Environment (coming soon)
- Part 20: Recap, Production Checklist and Next Steps (coming soon)
Since Part 5, the Home screen has shown approvers and payroll staff a Reports button that did nothing. This part builds what it opens: Get Overtime Report, a flow the app runs with a month, and the Reports screen. Then it shares the app with the payroll officer and tests the screen as payroll, as an approver and on a phone. Each generic task has its own guide; this part gives the values for this app, and why.
What You'll Build
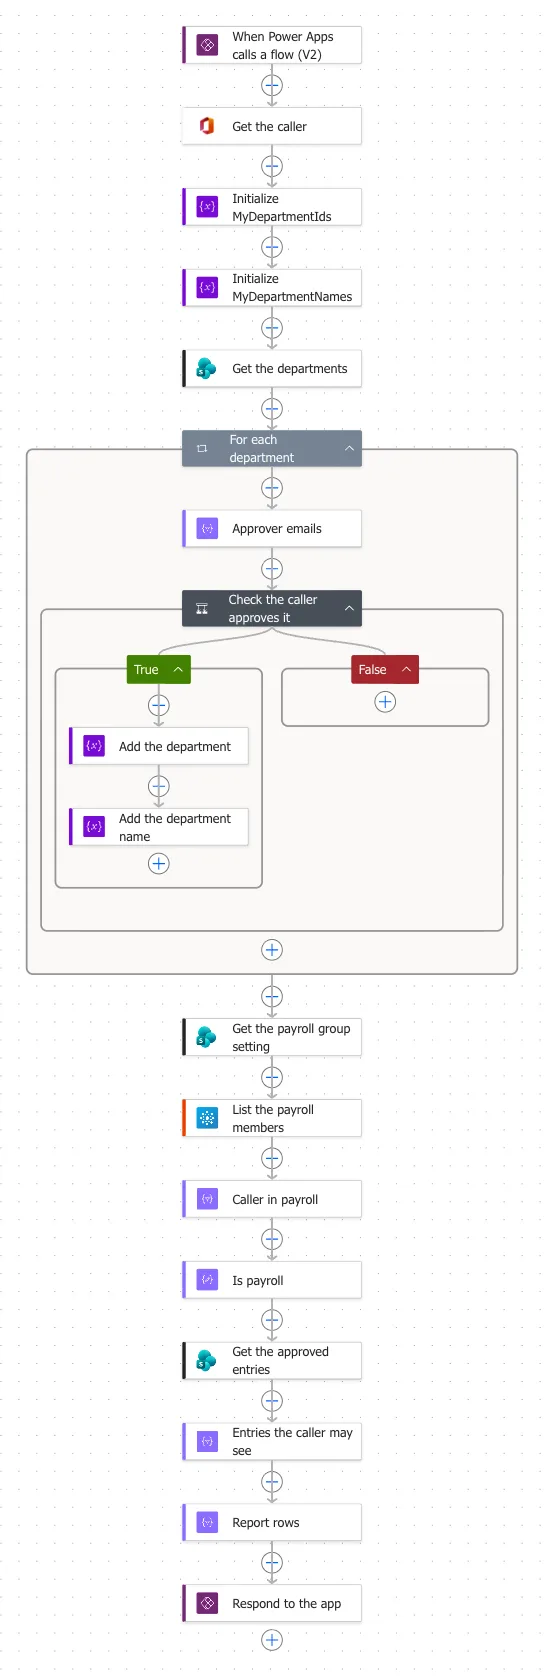
The finished flow, action by action:
When Power Apps calls a flow (V2)        one input: Month, a Date
├─ Get the caller                        Get my profile (V2): who is running the flow
├─ Initialize MyDepartmentIds            Initialize variable: an empty list
├─ Initialize MyDepartmentNames          Initialize variable: an empty list
├─ Get the departments                   Get items: every department
├─ For each department
│  ├─ Approver emails                    Select: its approvers' emails, lower case
│  └─ Check the caller approves it       Condition: is the caller one of them?
│     ├─ True: Add the department        Append to array variable: its ID
│     └─ True: Add the department name   Append to array variable: its name
├─ Get the payroll group setting         Get items: the group's ID from Settings
├─ List the payroll members              List group members: Overtime Payroll
├─ Caller in payroll                     Filter array: the member who is the caller
├─ Is payroll                            Compose: true or false
├─ Get the approved entries              Get items: the month, approved twice
├─ Entries the caller may see            Filter array: everything for payroll, or their departments
├─ Report rows                           Select: four fields of each entry
└─ Respond to the app                    Respond to a Power App or flow: entries and scope
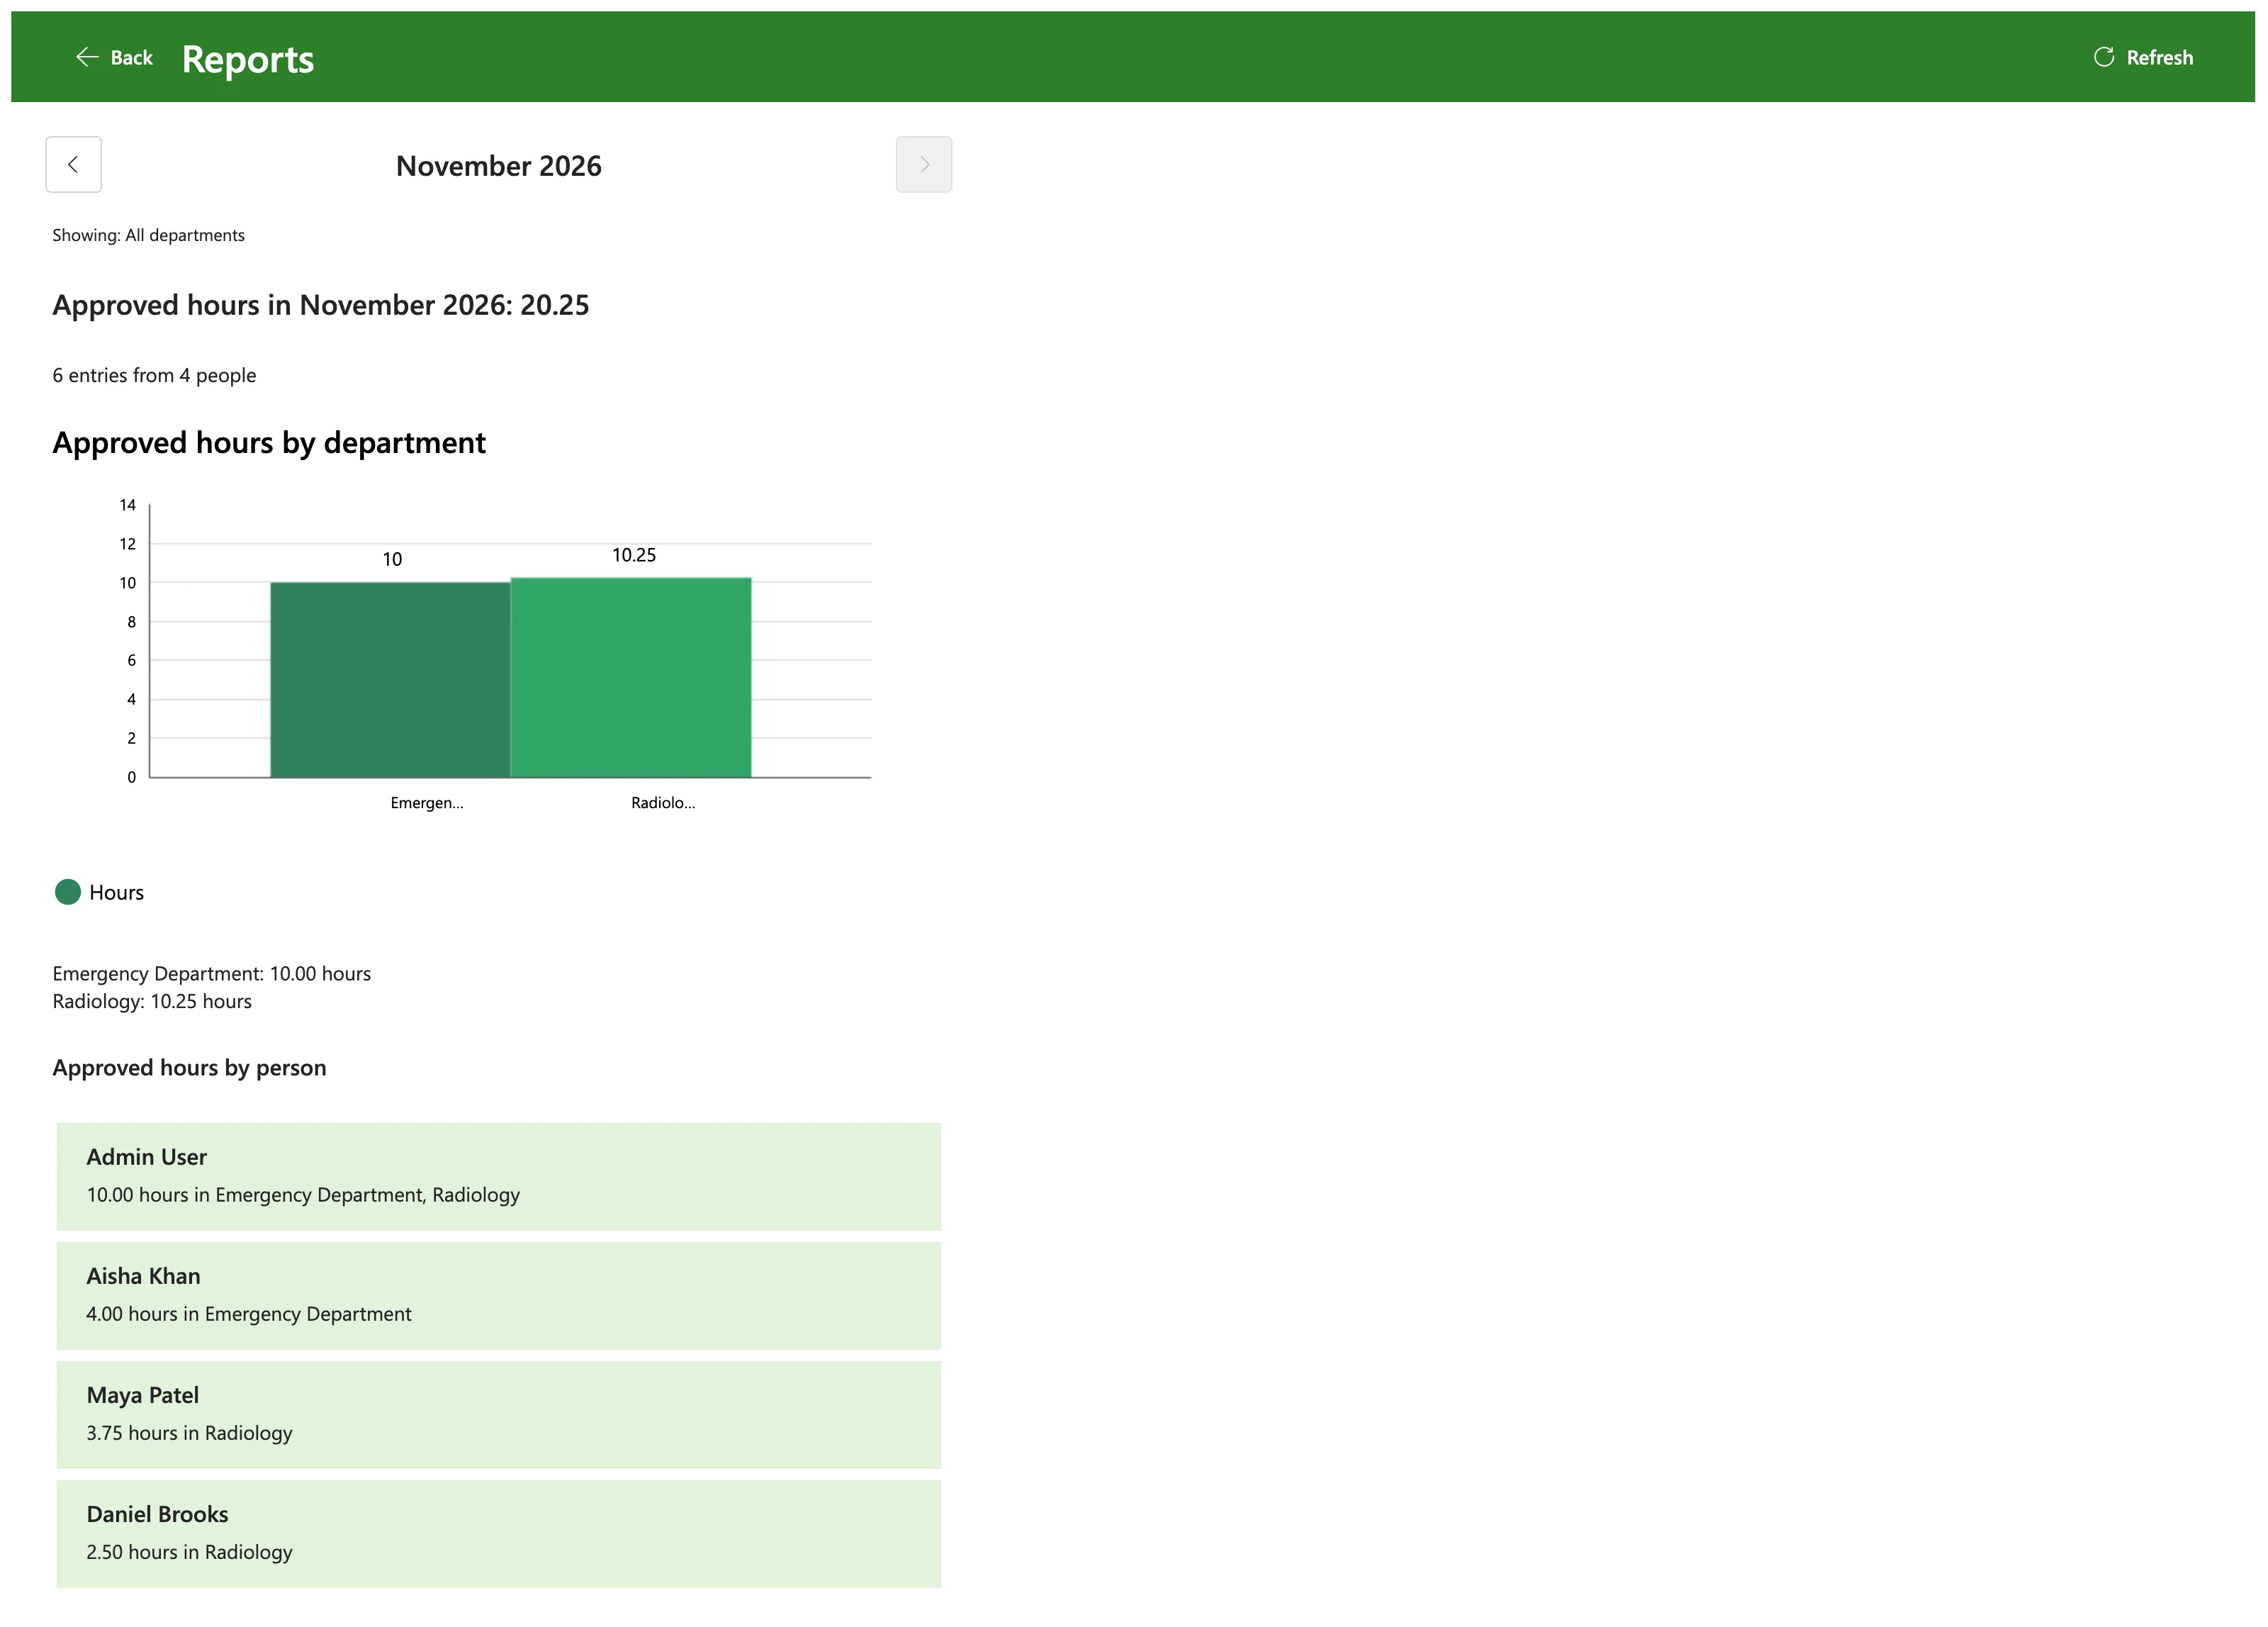
What the payroll officer, Leo Martin, sees for November:
How the Report Works
The decisions behind it:
- An entry counts when it's approved twice. Its own Status column must say Approved, and so must SharePoint's Approval Status. Anyone allowed to edit an entry can change Status in SharePoint, as Part 8 found. Only people with permission to approve items can change Approval Status: in this app, the site's owners, and Part 8's flow sets it with the owner's connection. An entry whose Status was changed by hand stays out of the report.
- The hours are the approved hours. Part 8's flow works the hours out from the times and the break and saves them with the decision. With content approval on (Part 3), any later change to an approved entry sends it back to Pending, so an entry that counts still carries the hours its approver saw.
- A flow, because nobody can read other people's entries. Part 3 lets each person read only their own items in OvertimeEntries. As in Part 9, the flow reads the list with its owner's SharePoint connection, and decides itself what each person gets.
- The flow decides who sees what. It finds out who's asking with their own Office 365 Users connection. Members of the Overtime Payroll group get every department. Everyone else gets the departments whose Approvers column names them, so someone who approves no department gets nothing. The app sends only the month, so nobody can ask for more by changing what it sends.
- Four fields per entry. The flow returns each entry's employee, email, department and hours, without dates, times or reasons. The app works out the totals.
- One month at a time. The screen opens on the current month, and the arrows go back through earlier months. Future months have no approved overtime, so the forward arrow stops at the current month.
- The payroll workbook comes later. Part 13 builds the monthly Excel workbook for payroll, with its own button on this screen.
Prerequisites
- Part 10 completed, with the app open in Power Apps Studio.
- The site's owner as the flow's maker, so its SharePoint connection can read every entry.
- Some approved entries. Part 8's tests left six approved entries in November 2026 and one in October.
Step 1: Create the Flow with a Month Input
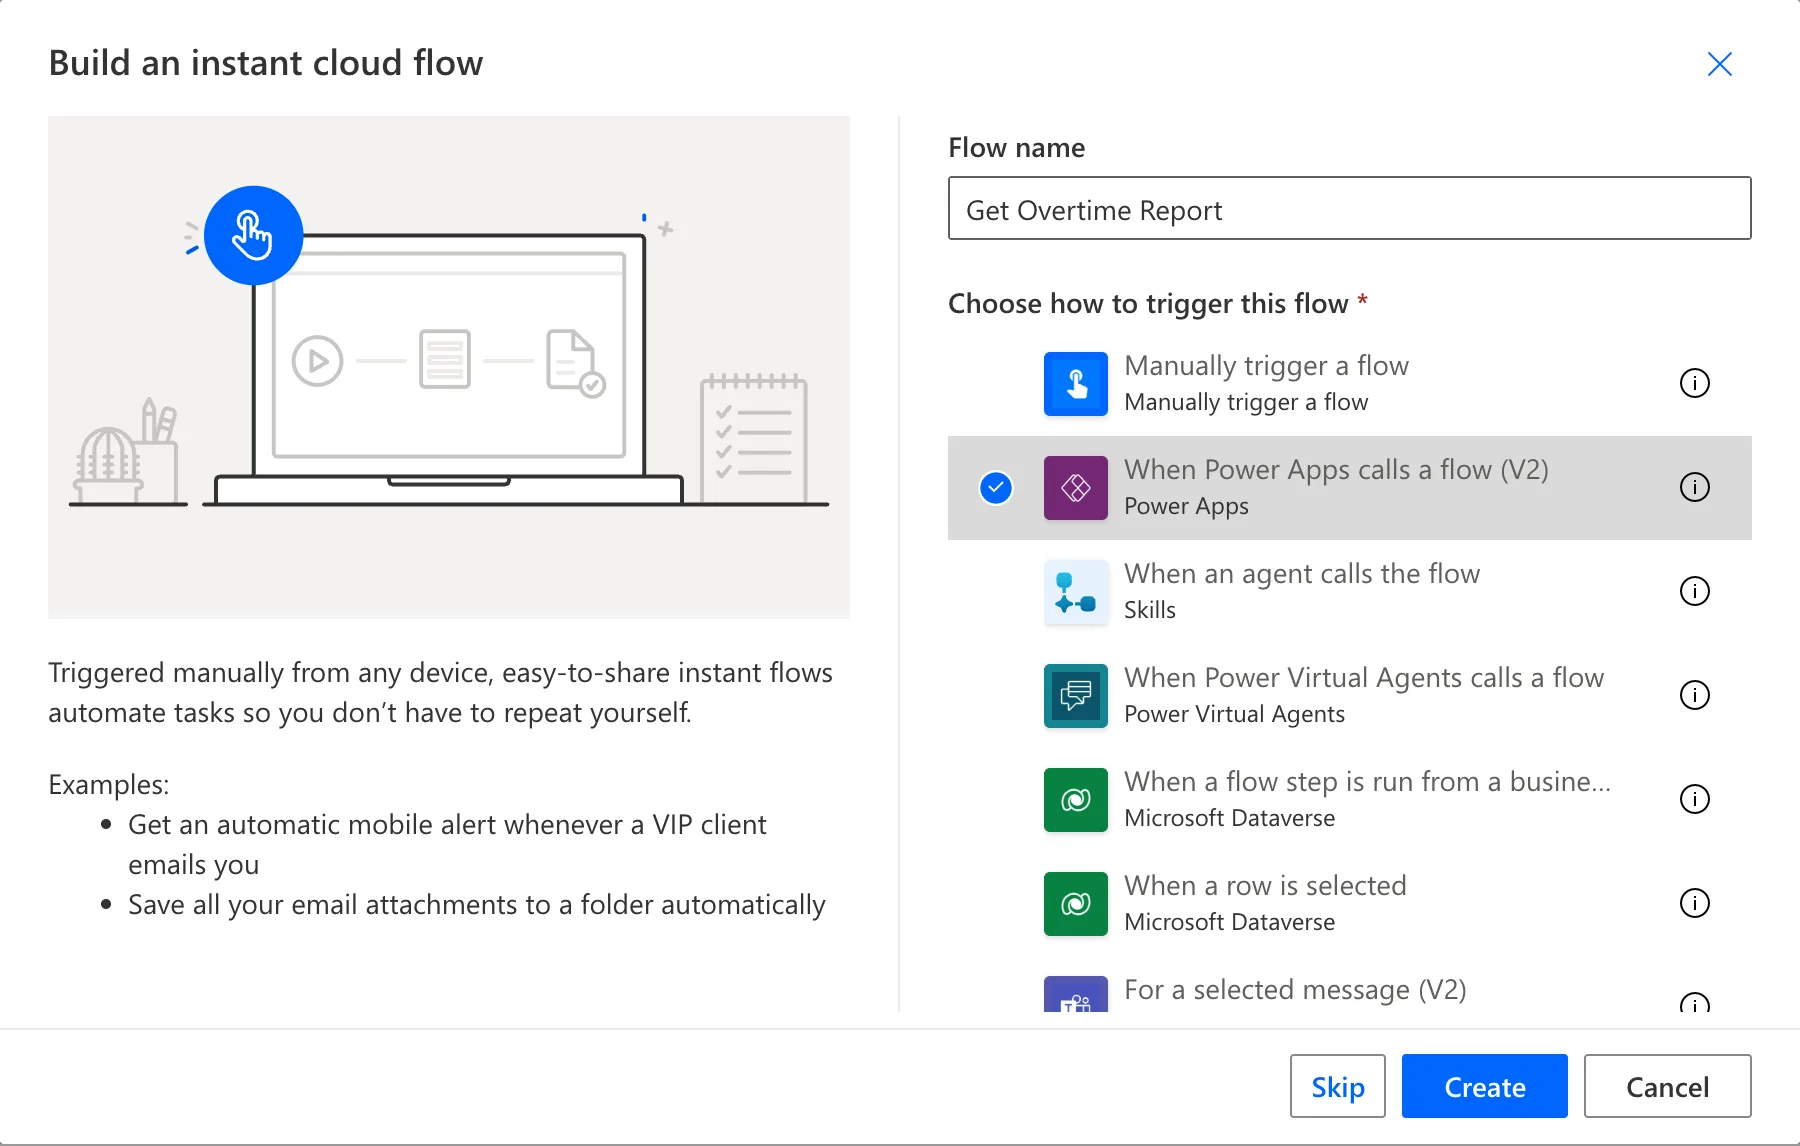
In the Overtime Timesheet solution, select New > Automation > Cloud flow > Instant. Name the flow Get Overtime Report, choose When Power Apps calls a flow (V2), and select Create (How to Create a Flow That Power Apps Can Run in Power Automate):
As in Part 9, it opened in the classic designer. I added the first action, Get my profile (V2) from Step 2, saved, and opened the flow from My flows with Edit to build the rest in the new designer. On its details page, I gave it a description: Returns the approved overtime entries of one month that the person running it may see: every department for payroll, or only the departments they approve. Used by the Reports screen of the Overtime Timesheet app.
The month. Unlike Part 9's flow, this one needs a value from the app: which month to report. In the trigger, select Add an input, choose Date, and fill in the input (How to Add an Input to the Power Apps (V2) Trigger in Power Automate):
| Setting | Value |
|---|---|
| Name | Month |
| Description | Any day in the month to report |
| Required | Yes, as new inputs are |
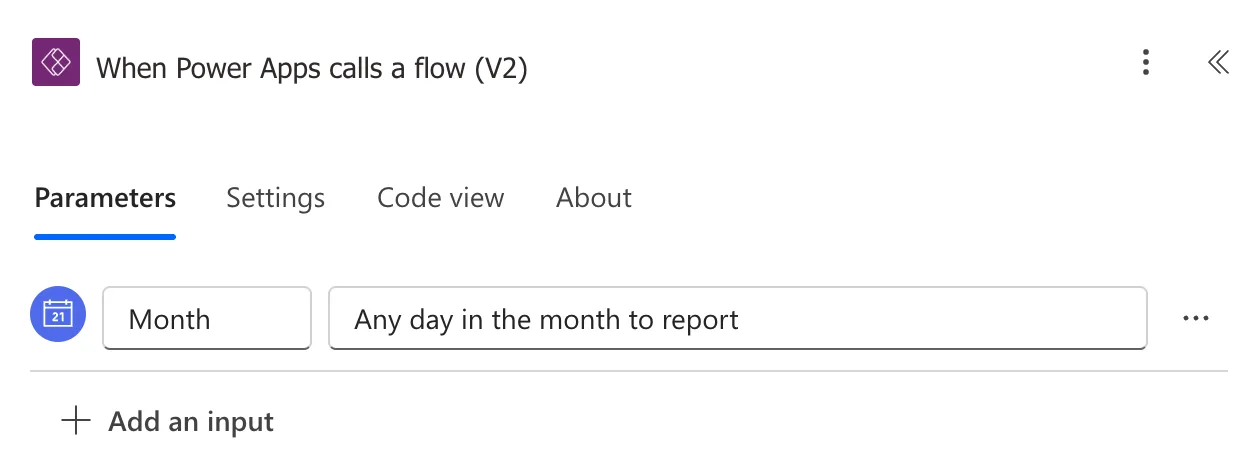
The app will send the first day of the month, but any day works: the flow uses only the year and month. Expressions read the input by its key, date, which the trigger's Code view shows: triggerBody()?['date'].
Step 2: Find the Caller and Their Departments
These actions are Part 9's, with one more list: the names of the departments the caller approves, for the line Showing: … at the top of the screen.
| Action | Name | Settings |
|---|---|---|
| Get my profile (V2) (Office 365 Users) | Get the caller | None (guide) |
| Initialize variable | Initialize MyDepartmentIds | Name MyDepartmentIds; Type Array; Value [] |
| Initialize variable | Initialize MyDepartmentNames | Name MyDepartmentNames; Type Array; Value [] |
| Get items (SharePoint) | Get the departments | Site Address: the Overtime Timesheet Site variable; List Name: the Departments variable; Top Count 5000 |
| Apply to each (How to Loop Through an Array with Apply to Each in Power Automate) | For each department | The body/value of Get the departments |
| Select, inside the loop | Approver emails | From items('For_each_department')?['Approvers']; Map (text mode) toLower(item()?['Email']) |
| Condition, after it | Check the caller approves it | Below |
| Append to array variable (How to Add Items to an Array Variable in Power Automate), in True | Add the department | Name MyDepartmentIds; Value items('For_each_department')?['ID'] |
| Append to array variable, in True | Add the department name | Name MyDepartmentNames; Value items('For_each_department')?['Department'] |
The condition compares with is equal to, true on the right (How to Check If a Person Is in a Multi-Person Column in Power Automate):
contains(body('Approver_emails'), toLower(outputs('Get_the_caller')?['body/mail']))
Three things from Part 9 happened again while I added them, and the fixes were the same:
- The first Initialize variable's name went into the flow's name. The box at the top of the designer took the text, and the flow was briefly called MyDepartmentIds. I typed its name back, removed the half-made action and added it again.
- The first expression showed This expression has a problem until I selected Add a second time (Fixed: "This expression has a problem" in Power Automate).
- Get the departments connected to another solution's SharePoint reference. Change connection reference at the bottom of its pane switched it to Overtime Timesheet SharePoint (How to Change an Action's Connection Reference in Power Automate). Check the same line on the later SharePoint actions: in the pictures below, each says Connected to Overtime Timesheet SharePoint.
Step 3: Find Out Whether the Caller Is in Payroll
Payroll staff are the members of the Overtime Payroll security group, whose ID Part 5 saved in the Settings list. Four actions turn that into true or false (How to Check If a User Is in a Security Group in Power Automate):
| Action | Name | Settings |
|---|---|---|
| Get items (SharePoint) | Get the payroll group setting | The Settings variable; Filter Query Title eq 'PayrollGroupId' (How to Filter SharePoint Items with a Filter Query in Power Automate); Top Count 1 |
| List group members (Office 365 Groups) | List the payroll members | Group Id below; Top 999 |
| Filter array | Caller in payroll | From the value of List the payroll members; id is equal to the Id of Get the caller |
| Compose | Is payroll | Inputs below |
first(body('Get_the_payroll_group_setting')?['value'])?['Value']
greater(length(body('Caller_in_payroll')), 0)
Top 999 is the most the action takes; without it, it returns 100 members. Is payroll is true when the filter kept a member: the caller (How to Use the greater() Function in Power Automate).
List the payroll members asked me to sign in to Office 365 Groups. Signing in created a new connection with my account, and a connection reference for it in the solution, with a name the designer made up, starting new_. Part 8's flow got names like that too, and Part 18 looks at them before the solution is exported.
Step 4: Get the Month's Approved Entries
Get items, named Get the approved entries, reads OvertimeEntries through its environment variables, with Top Count 5000 and this Filter Query (How to Get Only Approved Items from a SharePoint List in Power Automate):
WorkMonth eq '@{formatDateTime(triggerBody()?['date'], 'yyyy-MM')}' and Status eq 'Approved' and OData__ModerationStatus eq 0
WorkMonth eq '…'keeps one month's entries. Part 2 gave each entry its month as text, such as 2026-11, and indexed the column.formatDateTime(triggerBody()?['date'], 'yyyy-MM')writes the input's year and month that way.MMis the month;mmwould be minutes (How to Format a Date in Power Automate with formatDateTime). In the designer, it's an expression token with the rest typed around it.Status eq 'Approved'checks the entry's own column.OData__ModerationStatus eq 0checks SharePoint's Approval Status:0is Approved. The name has two underscores in the middle.
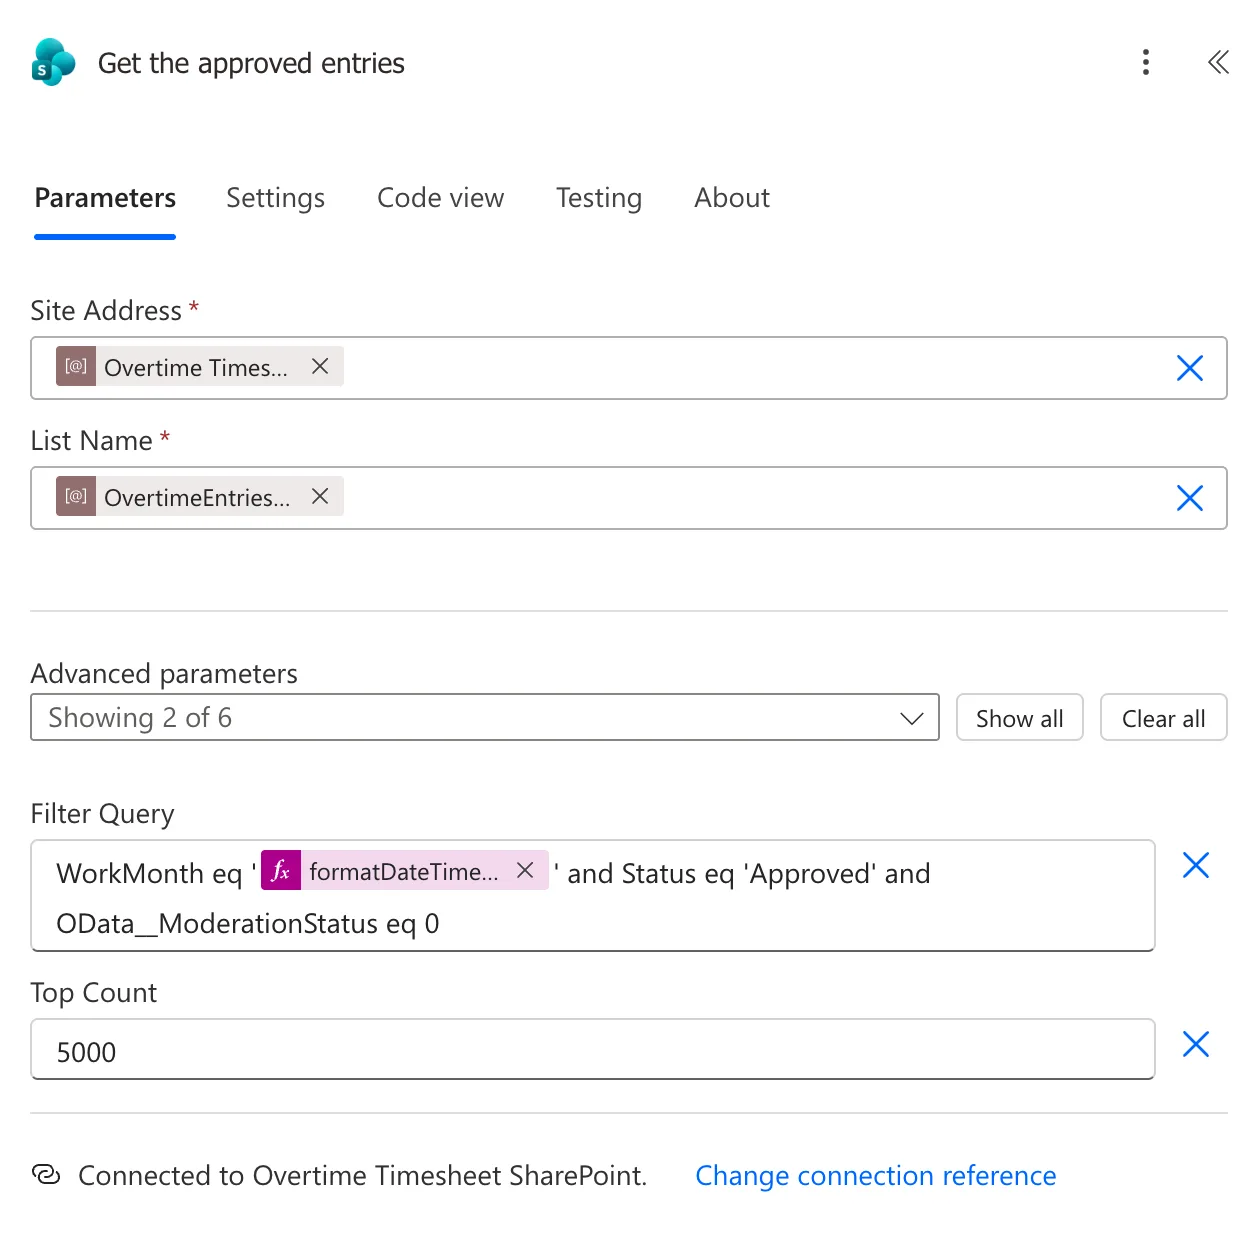
The flow now has the month's approved entries, from every department.
Step 5: Keep What the Caller May See and Answer the App
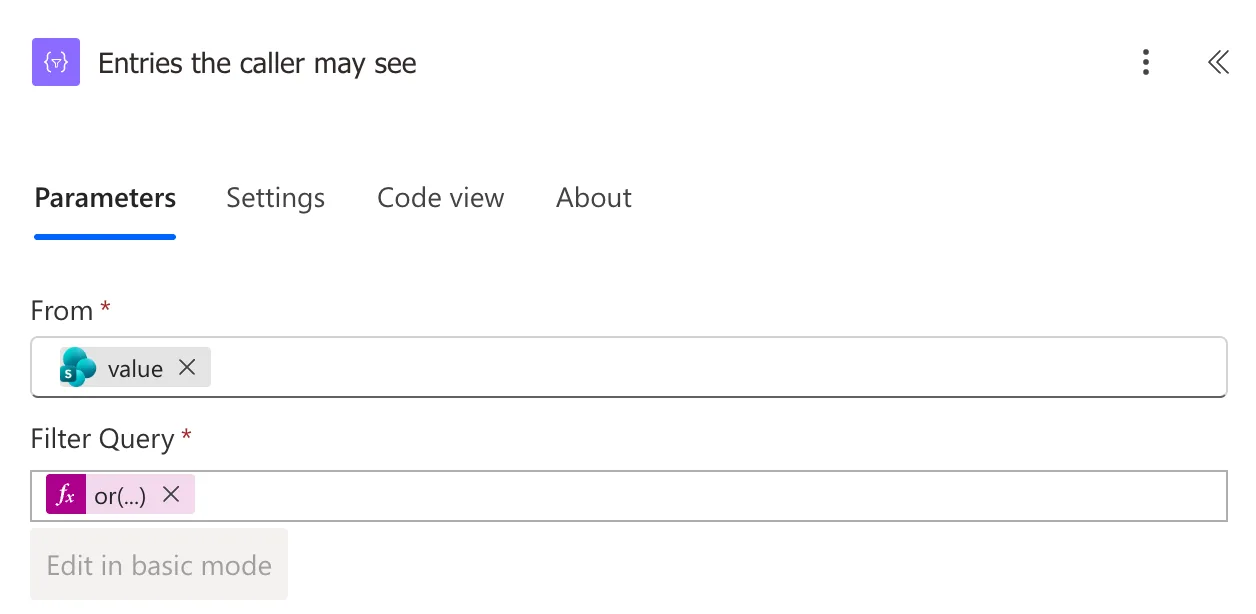
Filter array, named Entries the caller may see, takes the body/value of Get the approved entries. In advanced mode, one expression keeps every entry for payroll, and an approver's departments' entries for everyone else (How to Use the or() Function in Power Automate):
@or(equals(outputs('Is_payroll'), true), contains(variables('MyDepartmentIds'), int(string(item()?['DepartmentId']))))
int(string(...)) is there for the same reason as in Part 9: without it, contains() doesn't match a SharePoint number (Fixed: contains() Returns False for a SharePoint Number in Power Automate). Unlike Part 9's filter, this one keeps the caller's own entries: a report of approved hours includes everyone's.
Select, named Report rows, takes the Body of Entries the caller may see and keeps four fields (How to Keep Several Fields from Each Item with Select in Power Automate):
| Key | Value |
|---|---|
employee | EmployeeName |
email | EmployeeEmail |
department | Department |
hours | Hours |
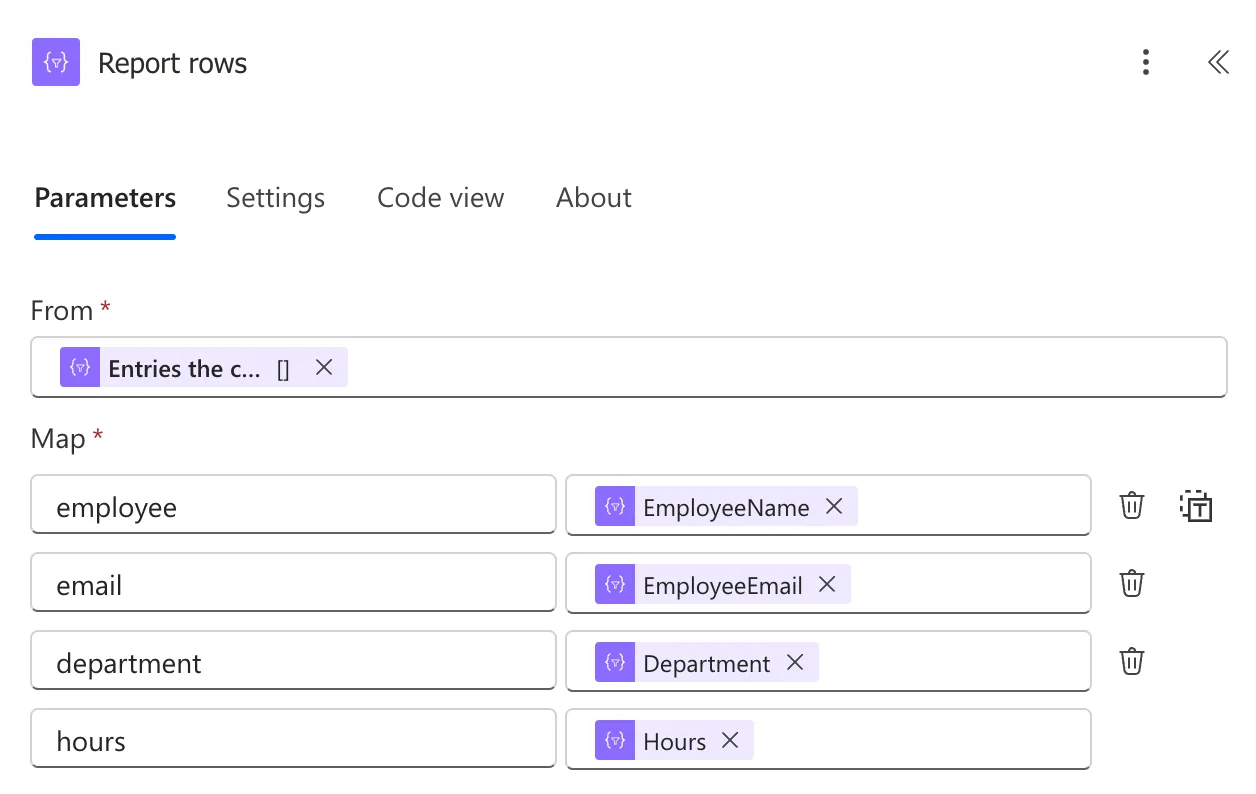
The email is there so the app can tell people apart: two people can share a name.
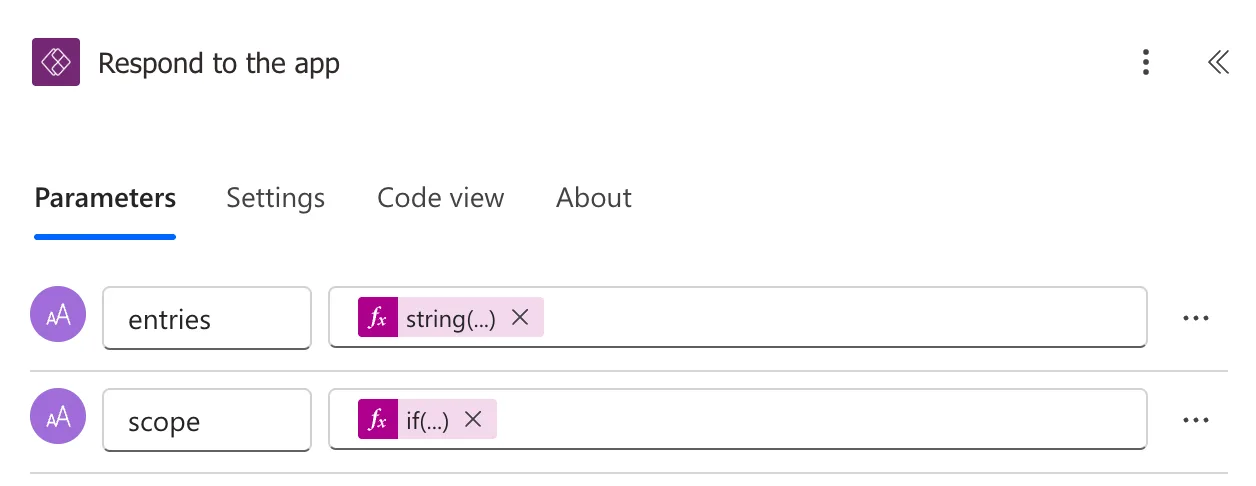
Respond to a Power App or flow, named Respond to the app, has two Text outputs (How to Return a Table from a Flow to Power Apps as JSON in Power Automate):
string(body('Report_rows'))
if(outputs('Is_payroll'), 'All departments', join(variables('MyDepartmentNames'), ', '))
scope says what the report covers: All departments for payroll, or the names of the departments the caller approves, separated by commas (How to Use the if() Function in Power Automate and How to Join an Array into Text in Power Automate). For someone who's neither, it's empty, and the app says so.
Step 6: Check, Publish, Test and Share the Flow
Flow checker (How to Check a Flow for Errors with Flow Checker in Power Automate) found no errors and no warnings, and Publish (How to Save a Draft and Publish a Flow in Power Automate) said Your flow is ready to go. The whole flow:
A manual test. I ran it with Month 2026-11-01 (How to Test a Cloud Flow Manually in Power Automate). It succeeded, and the run showed the filter SharePoint received: WorkMonth eq '2026-11' and Status eq 'Approved' and OData__ModerationStatus eq 0. I'm the approver of Finance only, which had no approved overtime, so Respond to the app returned entries as [] and scope as Finance.
I first read the number of approved entries from the run's table of Get the approved entries' outputs, which showed five rows. November has six. A later run, as payroll, returned six entries to the app while the same table again showed five: the run view's table didn't show every item of the list. Microsoft's run history pages don't mention it, so I count items from what the flow returns, not from that table.
The connections for run-only users. On the flow's details page, select Edit on the Run only users card (How to Choose the Connections Run-Only Users Use in Power Automate):
| Connector | Setting | Why |
|---|---|---|
| Office 365 Users | Provided by run-only user | Get the caller must return the person using the app |
| SharePoint | Use this connection (the owner's) | Nobody else can read every entry |
| Office 365 Groups | Use this connection (the owner's) | Users don't need their own connection for one membership check |
The list offered two of my Office 365 Groups connections: the app's, from Part 5, and the one this flow had just created. Either works, since both are mine.
The run-only users. This share is for testing. In the same panel, I added Leo Martin, the payroll officer, and the two approvers from Part 9, Olivia Bennett and Daniel Brooks (How to Share a Flow with Run-Only Users in Power Automate). Part 15 replaces the three with the Overtime Timesheet Users group:
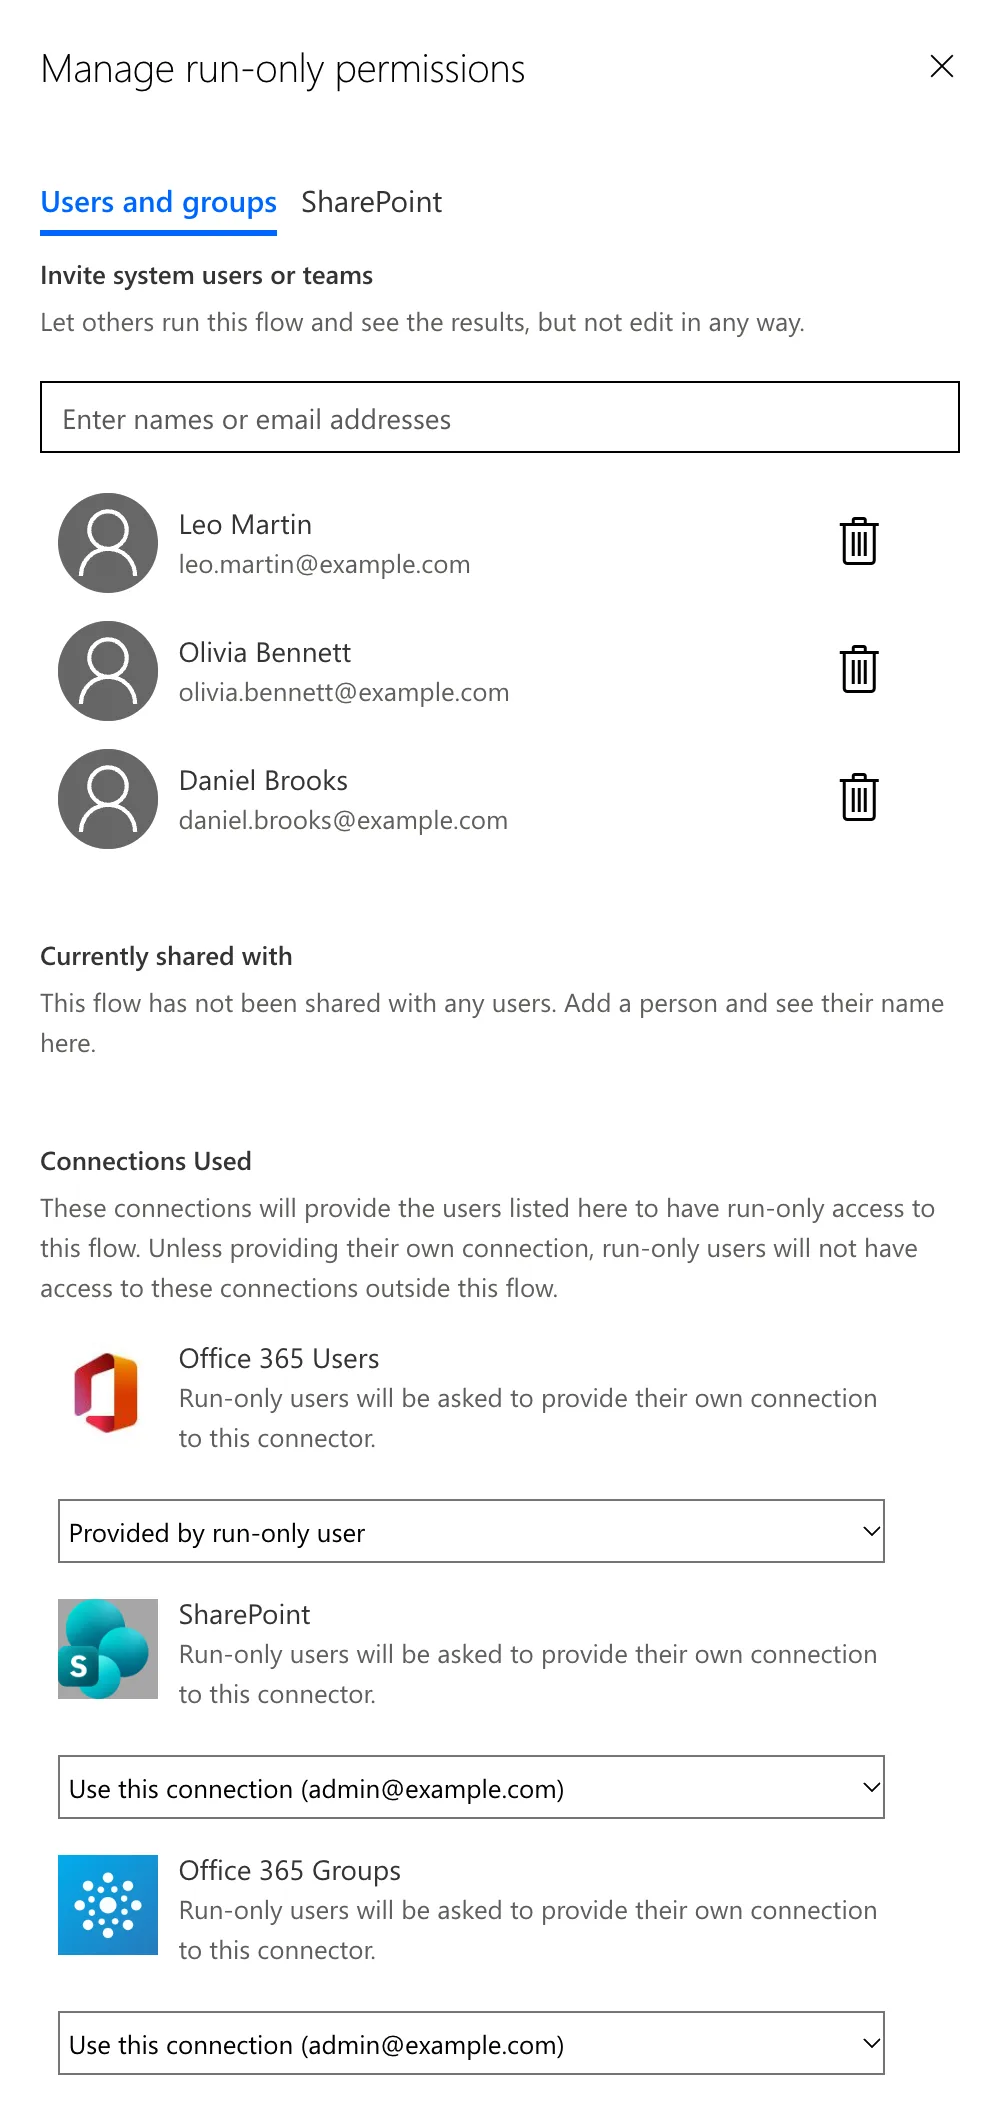
Currently shared with says nobody until the panel is saved. After Save, the card listed all three.
Step 7: Add the Flow to the App and Build the Screen
The flow. In Studio, select More (…) on the left bar, then Power Automate, Add flow, and Get Overtime Report (How to Add a Flow to a Canvas App in Power Apps). Formulas call it as GetOvertimeReport:
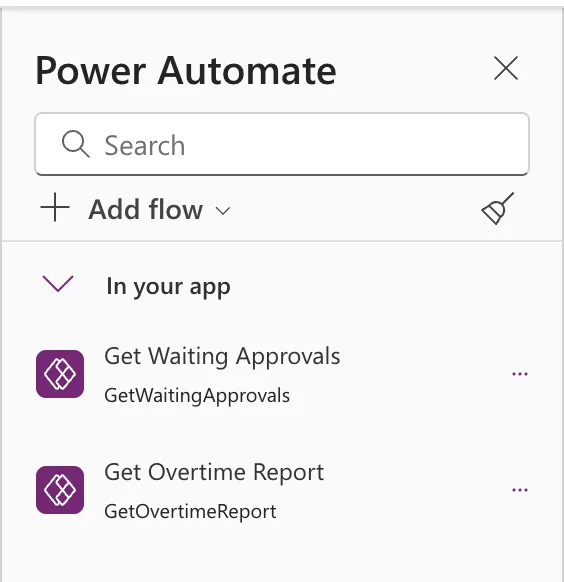
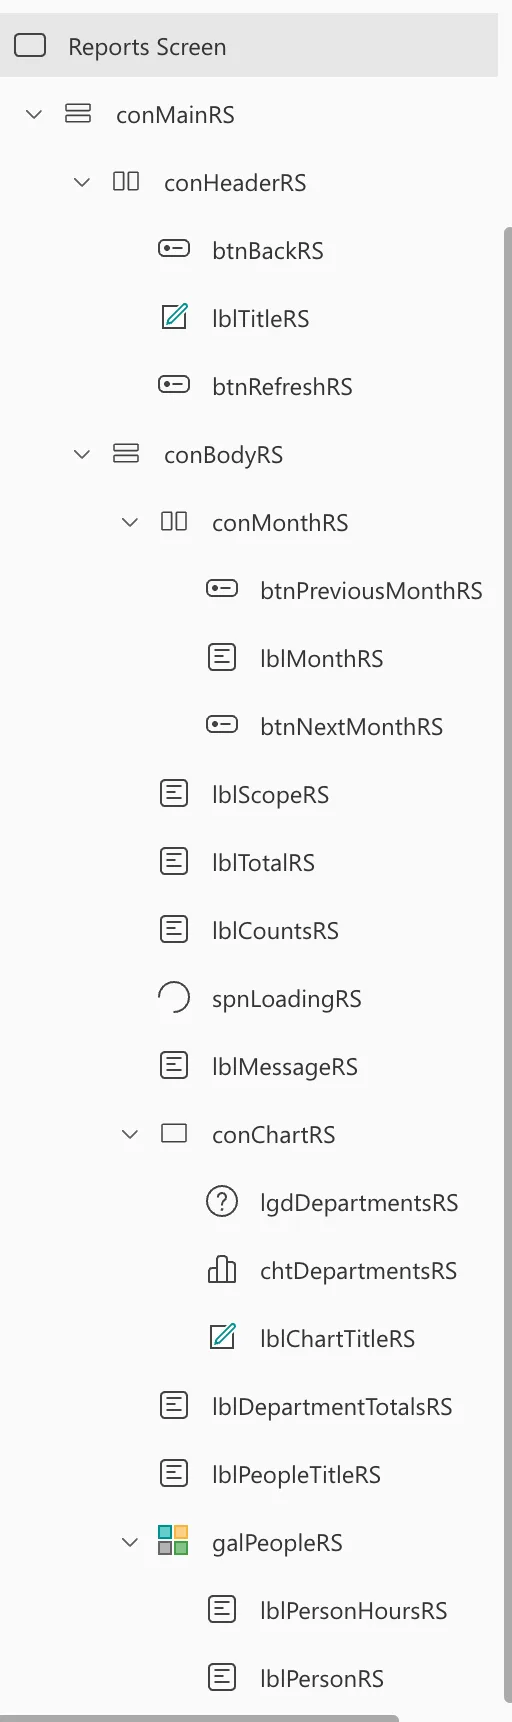
The screen. Add a blank screen named Reports Screen, whose controls end in RS (How to Add a New Screen in Power Apps). Most of it comes from the My Overtime screen of Part 7, which also shows one month at a time:
Reports Screen
└─ conMainRS                     vertical: fills the screen
   ├─ conHeaderRS                horizontal: copied from the My Overtime screen
   │  ├─ btnBackRS
   │  ├─ lblTitleRS              "Reports"
   │  └─ btnRefreshRS            loads the report
   └─ conBodyRS                  vertical: scrolling
      ├─ conMonthRS              copied from My Overtime: the arrows and the month
      ├─ lblScopeRS              what the report covers
      ├─ lblTotalRS              the month's approved hours
      ├─ lblCountsRS             how many entries, from how many people
      ├─ spnLoadingRS            while the flow runs
      ├─ lblMessageRS            nothing approved, or the load failed
      ├─ conChartRS              a plain container
      │  ├─ lblChartTitleRS
      │  ├─ chtDepartmentsRS     a column chart
      │  └─ lgdDepartmentsRS
      ├─ lblDepartmentTotalsRS   each department's name and hours
      ├─ lblPeopleTitleRS        "Approved hours by person"
      └─ galPeopleRS             one card per person
The containers. Insert a vertical container, conMainRS, with the same settings as the other screens': X, Y 0; Width Parent.Width; Height Parent.Height; Align (horizontal) Stretch; Drop shadow None; Border radius 0 (How to Add a Vertical Container in Power Apps). Copy conHeaderMO from the My Overtime screen into it (How to Copy and Paste Controls Between Screens in Power Apps), rename the copies conHeaderRS, btnBackRS, lblTitleRS and btnRefreshRS, and set the title's Text to "Reports". After the header, insert the body, conBodyRS: Flexible height On; Align (horizontal) Start; Gap 16; Padding 24; Vertical overflow Scroll; Drop shadow None; Border radius 0.
The month bar and the text. Copy these from the My Overtime screen into conBodyRS, in this order, and rename them. They keep Part 7's sizes and styles:
| My Overtime control | Copy |
|---|---|
conMonthMO with btnPreviousMonthMO, lblMonthMO and btnNextMonthMO | conMonthRS with btnPreviousMonthRS, lblMonthRS and btnNextMonthRS |
lblTotalsNoteMO | lblScopeRS |
lblTotalMO | lblTotalRS |
lblWeeksMO | lblCountsRS |
spnLoadingMO | spnLoadingRS |
lblEmptyMO | lblMessageRS |
Steps 8 to 11 give each control its formulas.
Step 8: Load the Report
The month. The screen opens on the current month the first time, and keeps the month it was on after that, as My Overtime does. Then it loads the report (How to Run a Formula When a Screen Opens in Power Apps):
If(
    IsBlank(locMonthRS),
    UpdateContext({ locMonthRS: Date(Year(Today()), Month(Today()), 1) })
);
Select(btnRefreshRS)
The arrows move a month and load it again (How to Add Previous and Next Month Buttons in Power Apps). The forward arrow is disabled on the current month:
| Control | Property | Formula |
|---|---|---|
btnPreviousMonthRS | OnSelect | UpdateContext({locMonthRS: DateAdd(locMonthRS, -1, TimeUnit.Months)}); Select(btnRefreshRS) |
btnNextMonthRS | OnSelect | UpdateContext({locMonthRS: DateAdd(locMonthRS, 1, TimeUnit.Months)}); Select(btnRefreshRS) |
btnNextMonthRS | DisplayMode | If(locMonthRS < Date(Year(Today()), Month(Today()), 1), DisplayMode.Edit, DisplayMode.Disabled) |
lblMonthRS | Text | Text(locMonthRS, "mmmm yyyy") |
The loader. Refresh runs the flow with the month and turns its answer into a table, as Part 9's Refresh does (How to Run a Flow and Use Its Result in Power Apps, How to Turn JSON Text into a Table with ParseJSON in Power Apps and How to Handle a Failed Flow Call in Power Apps):
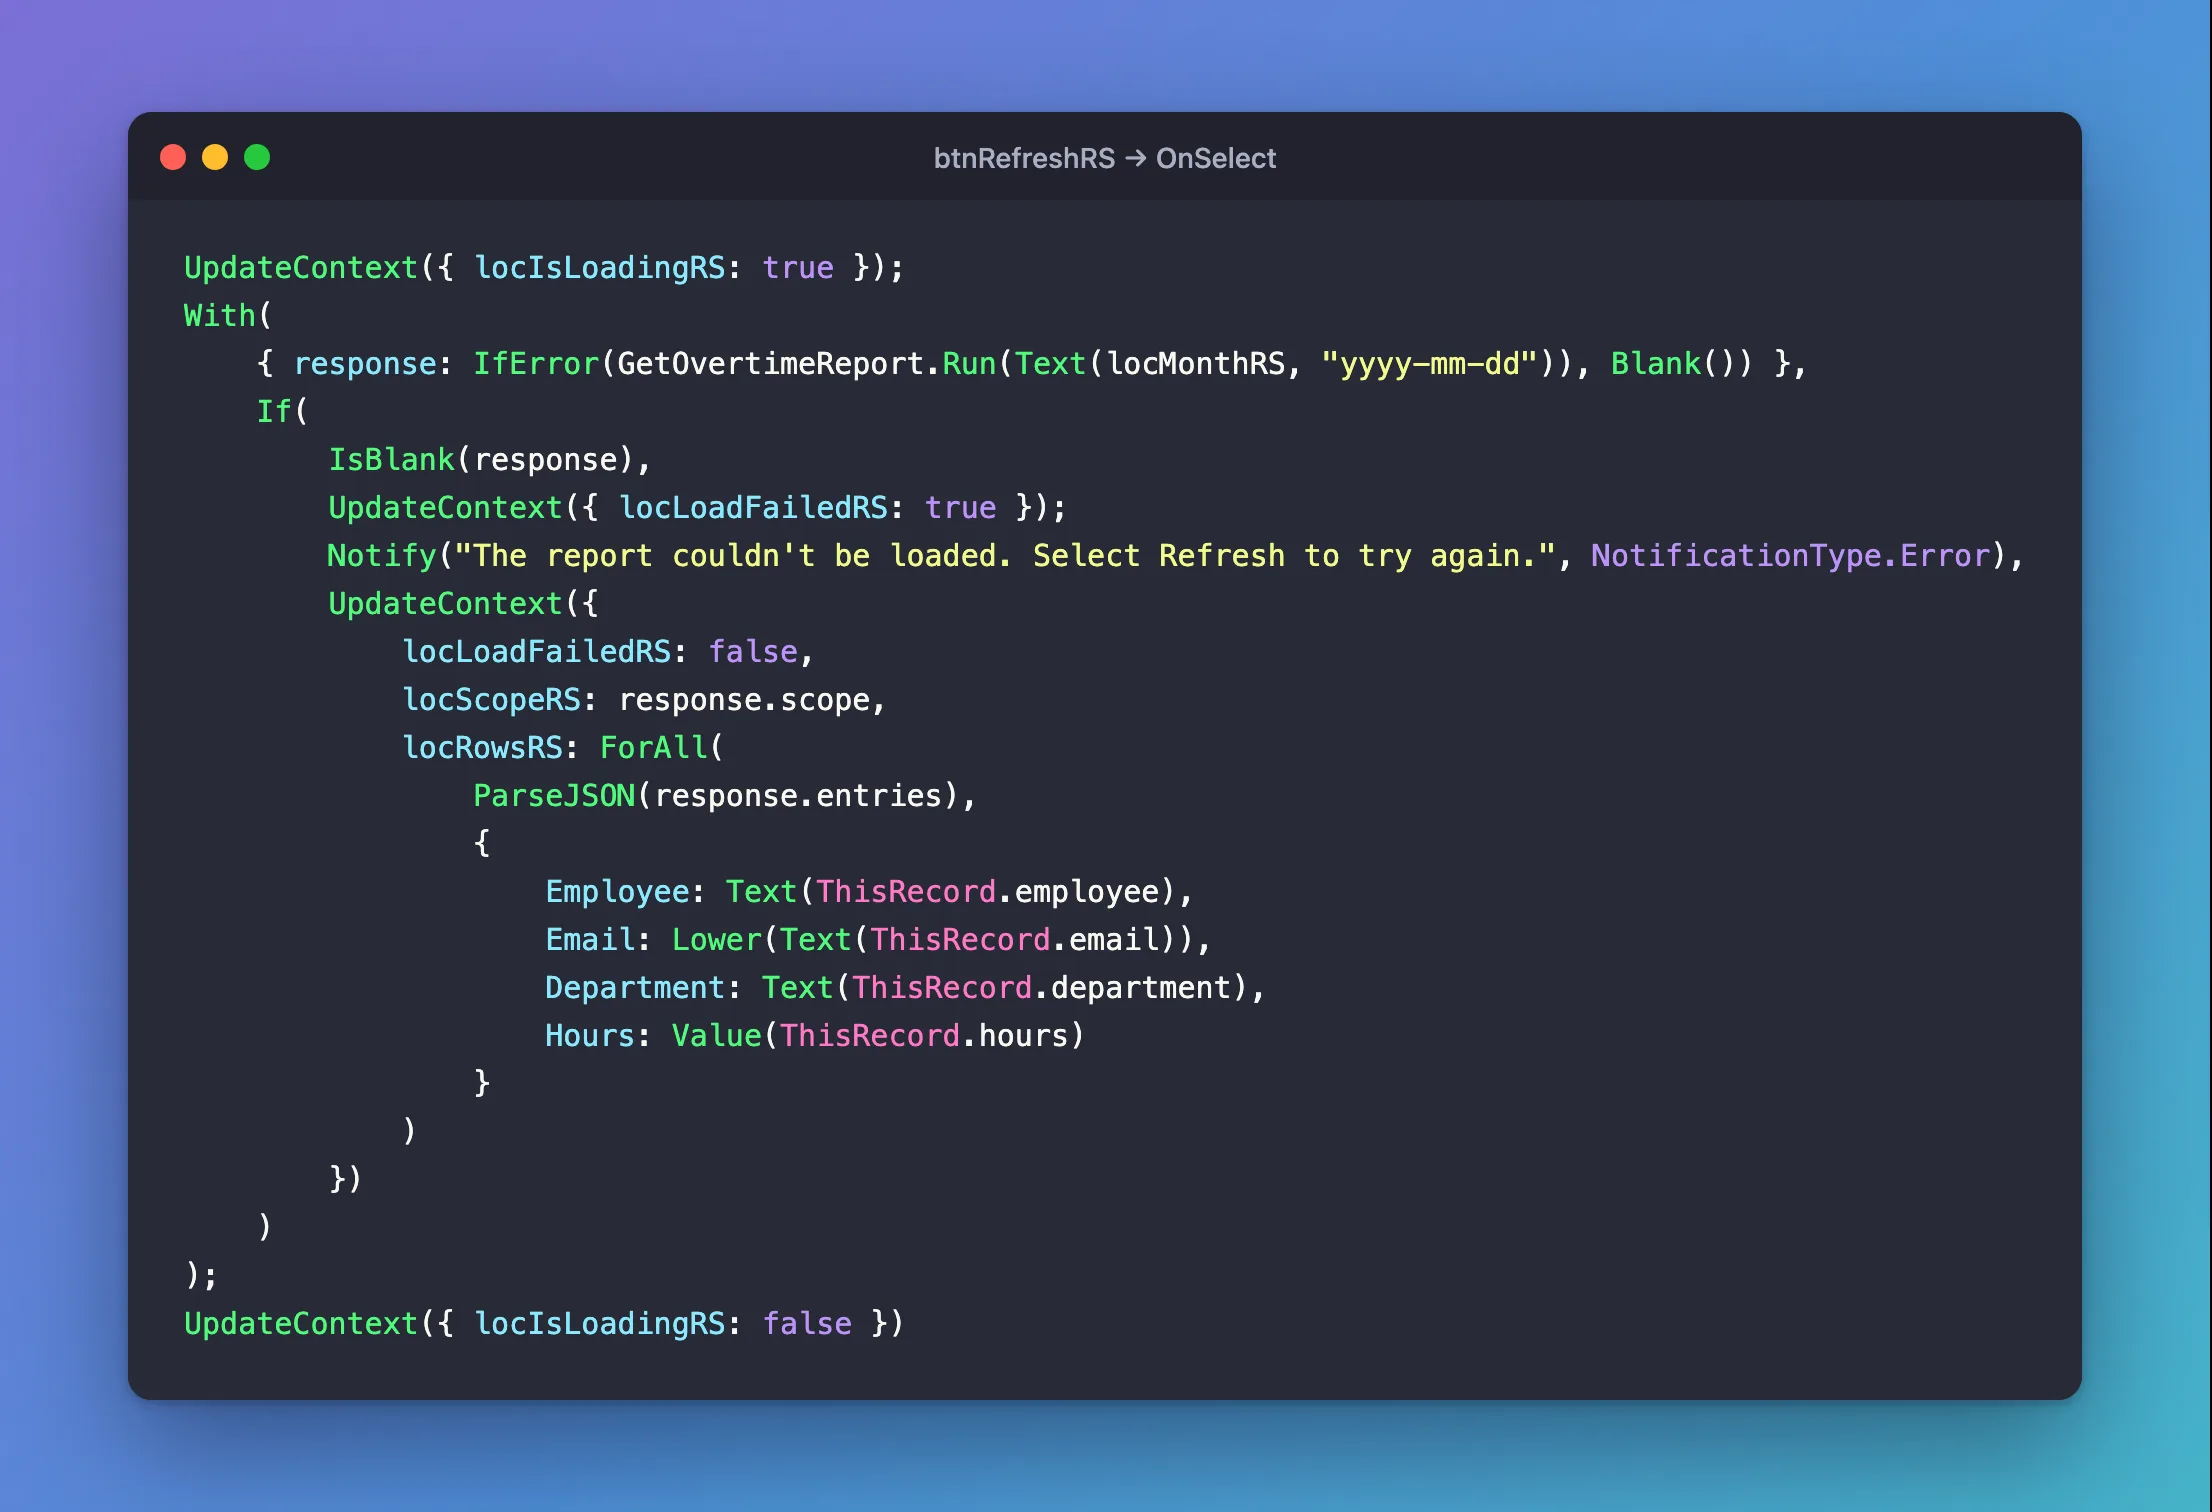
UpdateContext({ locIsLoadingRS: true });
With(
    { response: IfError(GetOvertimeReport.Run(Text(locMonthRS, "yyyy-mm-dd")), Blank()) },
    If(
        IsBlank(response),
        UpdateContext({ locLoadFailedRS: true });
        Notify("The report couldn't be loaded. Select Refresh to try again.", NotificationType.Error),
        UpdateContext({
            locLoadFailedRS: false,
            locScopeRS: response.scope,
            locRowsRS: ForAll(
                ParseJSON(response.entries),
                {
                    Employee: Text(ThisRecord.employee),
                    Email: Lower(Text(ThisRecord.email)),
                    Department: Text(ThisRecord.department),
                    Hours: Value(ThisRecord.hours)
                }
            )
        })
    )
);
UpdateContext({ locIsLoadingRS: false })
Text(locMonthRS, "yyyy-mm-dd")sends the month as the Date input expects it, such as 2026-11-01 (How to Send a Date to a Flow from Power Apps).locScopeRSkeeps what the report covers, andlocRowsRSthe entries, one row each.Lower(...)writes every email in lower case, so the same person always looks the same when the screen counts people (How to Convert Text to Lower Case in Power Apps with Lower).locIsLoadingRSandlocLoadFailedRSshow the spinner and the error message, as in Part 9.
In Studio, Format text in the formula bar lays a long formula like this one out with one argument per line (How to Format a Formula in Power Apps Studio).
The first version failed. It passed the month as it was, GetOvertimeReport.Run(locMonthRS). In Preview, the screen said The report couldn't be loaded, and the flow's run history had no new run. Studio's hint for Run says only that it takes the Month, not in what form. To see the error the loader hides, I changed OnSelect for a moment to show it with a notification that stays until it's closed: IfError(GetOvertimeReport.Run(locMonthRS), Notify(FirstError.Message, NotificationType.Error, 0)):

Power Apps had sent the date in the user's own short format, 01/11/2026, and the trigger accepts only yyyy-mm-dd. I found no page on Microsoft Learn that says how Power Apps writes a Date for a flow's input. The Text function writes a date in whatever form it's given, so the fix is to send the month as text in the form the input asks for (Fixed: TriggerInputSchemaMismatch "String … Does Not Validate Against Format 'date'" When Power Apps Runs a Flow). With Text(locMonthRS, "yyyy-mm-dd"), the call worked, and I put the loader back.
Step 9: Show the Totals and the Messages
The text controls under the month read the two variables:
| Control | Text |
|---|---|
lblScopeRS | If(IsBlank(locScopeRS), "You don't approve any department and you aren't in payroll, so there's no report to show.", "Showing: " & locScopeRS) |
lblTotalRS | $"Approved hours in {Text(locMonthRS, "mmmm yyyy")}: {Text(Coalesce(Sum(locRowsRS, Hours), 0), "0.00")}" |
lblMessageRS | If(locLoadFailedRS, "The report couldn't be loaded. Select Refresh to try again.", $"No approved overtime in {Text(locMonthRS, "mmmm yyyy")}.") |
Sum adds up the hours, and Coalesce turns a blank sum into 0 (How to Add Up a Column in Power Apps with Sum). lblCountsRS says how many entries there are, from how many people. People are counted by their different emails (How to Count Unique Values in Power Apps with Distinct):
With(
    {
        entries: CountRows(locRowsRS),
        people: CountRows(Distinct(locRowsRS, Email))
    },
    $"{entries} {If(entries = 1, "entry", "entries")} from {people} {If(people = 1, "person", "people")}"
)
The spinner, spnLoadingRS (How to Add a Loading Spinner in Power Apps), has Label "Loading the report..." and Visible locIsLoadingRS.
When each one shows. A report shows only after a load that worked:
!locIsLoadingRS && !locLoadFailedRS && !IsBlank(locRowsRS)
!locIsLoadingRS && !locLoadFailedRS && !IsBlank(locRowsRS) && !IsEmpty(locRowsRS)
!locIsLoadingRS && (locLoadFailedRS || (!IsBlank(locScopeRS) && IsEmpty(locRowsRS)))
My first Visible formulas didn't have !IsBlank(locRowsRS). Before the first load, locRowsRS is blank, and in Preview the screen showed You don't approve any department… and a total of 0.00 before any report had loaded. With the check, nothing shows until the flow has answered.
Step 10: Add the Chart by Department
Follow How to Add a Column Chart in Power Apps for each setting. In short:
A plain container first. I inserted the chart straight into conBodyRS at first. Then I found the known issue in Microsoft's guide to responsive apps: charts aren't supported in layout containers, such as the vertical containers this screen is built from. So the chart lives in a plain Container, conChartRS, inside the body (How to Add a Container Control in Power Apps): Width Min(640, Parent.Width - 48), Align in container Start, Height 360, Drop shadow None. It also needed Flexible height off (FillPortions 0): with it on, the container ignored its Height.
The chart. Insert a Column chart, cut its group into conChartRS, ungroup it, and rename the three controls lblChartTitleRS, chtDepartmentsRS and lgdDepartmentsRS. The title says Approved hours by department. The chart's Items is one row per department with its hours, in alphabetical order:
If(
    IsBlank(locRowsRS),
    Blank(),
    Sort(
        ShowColumns(
            AddColumns(GroupBy(locRowsRS, Department, Rows), Hours, Sum(Rows, Hours)),
            Department,
            Hours
        ),
        Department
    )
)
GroupBy puts each department's entries in Rows, AddColumns adds their Hours with Sum (How to Total Each Group in Power Apps with GroupBy and Sum), and ShowColumns keeps the label and the number (How to Keep Only Some Columns of a Table in Power Apps with ShowColumns). For accessibility, the chart has GridStyle GridStyle.All, Markers true, TabIndex 0 and an AccessibleLabel that names the month.
What Leo's first report showed. The chart was right, but hard to read:
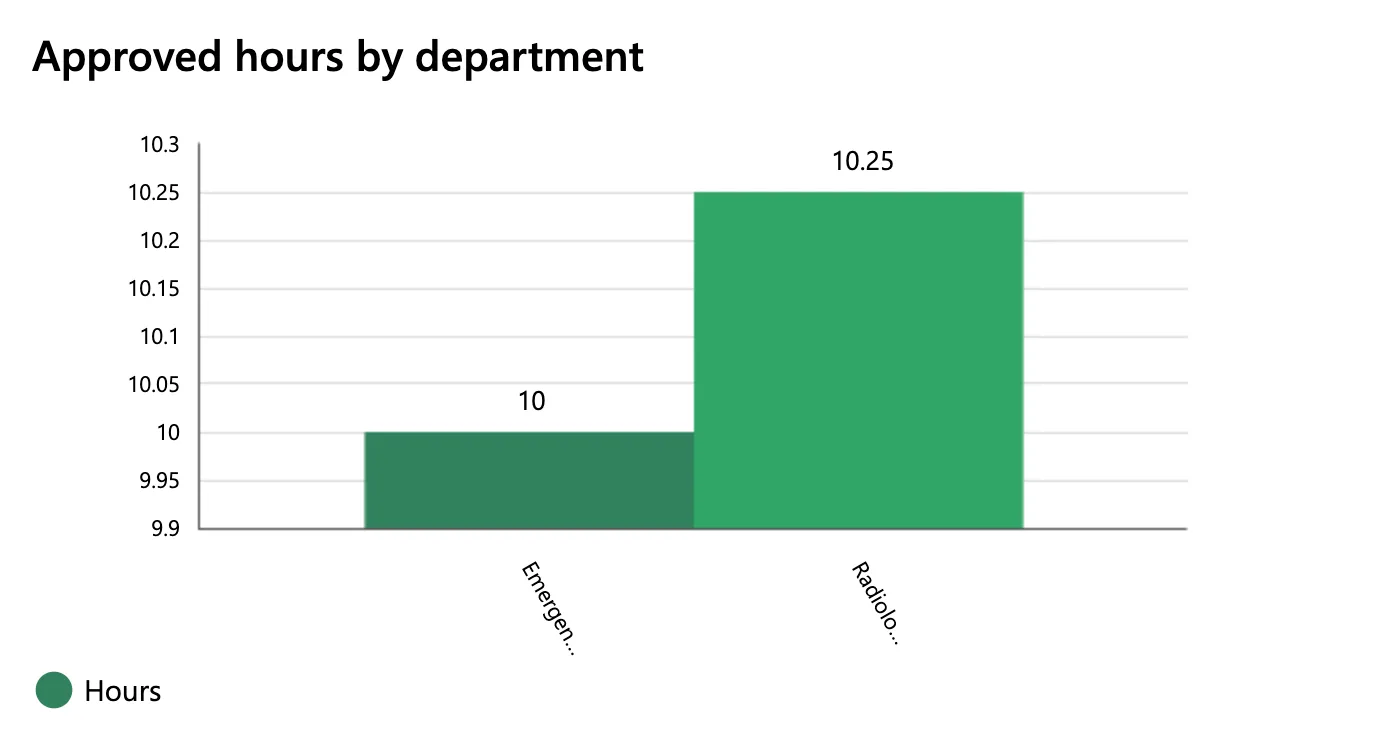
- The axis started at 9.9, so 10.25 hours looked three times as much as 10. SeriesAxisMin
0starts it at zero (Fixed: Column Chart Y-Axis Doesn't Start at Zero in Power Apps). - The names were cut to Emergen… and Radiolo…. Laying the labels flat with XLabelAngle
0didn't help, and the chart's reference has no setting for it. So the chart stays for comparing the columns, and a text list under it gives each department's full name and hours (Fixed: Column Chart Cuts Off Labels with an Ellipsis in Power Apps). I kept the flat labels, which are easier to read.
The totals as text. Copy lblCountsRS into conBodyRS, rename the copy lblDepartmentTotalsRS, and move it to just after conChartRS with Reorder > Move up (How to Reorder Controls in a Container in Power Apps). It has Size 14, Auto height on, Width Min(640, Parent.Width - 48), Align in container Start and AccessibleLabel Self.Text. Its text is a line per department, joined with a line break, Char(10) (How to Join Table Values into Text in Power Apps with Concat):
If(
    IsBlank(locRowsRS),
    "",
    Concat(
        Sort(AddColumns(GroupBy(locRowsRS, Department, Rows), Hours, Sum(Rows, Hours)), Department),
        $"{Department}: {Text(Hours, "0.00")} hours",
        Char(10)
    )
)
Step 11: List the Hours by Person
The title. Copy lblTotalRS into conBodyRS and rename it lblPeopleTitleRS, with Text "Approved hours by person" and Size 16.
The gallery. One card per person, with their name, their hours and the departments they come from, the most hours first. A person who worked in two departments has one card. My first version was a blank vertical gallery with cards 76 pixels high. On a phone, the second line of a person with two departments wrapped, and the card cut off Radiology. I rebuilt it as a Blank flexible height gallery, whose cards grow with their text (How to Show Gallery Rows of Different Heights in Power Apps). Name it galPeopleRS:
If(
    IsBlank(locRowsRS),
    Blank(),
    Sort(
        AddColumns(
            GroupBy(locRowsRS, Email, Rows),
            Employee, First(Rows).Employee,
            Departments, Concat(Distinct(Rows, Department), Value, ", "),
            Hours, Sum(Rows, Hours)
        ),
        Hours,
        SortOrder.Descending
    )
)
GroupBy(locRowsRS, Email, Rows)makes one row per person, by email (How to Group Records in Power Apps with GroupBy).First(Rows).Employeetakes the name from the person's first entry (How to Get the First Record of a Table in Power Apps with First).Concat(Distinct(Rows, Department), Value, ", ")lists each of their departments once.Sort(..., Hours, SortOrder.Descending)puts the most hours first (How to Sort a Table in Power Apps with Sort).
The gallery's other properties:
| Property | Value |
|---|---|
| Width | Min(640, Parent.Width - 48) |
| Align in container | Start |
| TemplateSize | 76 |
| TemplatePadding | 8 |
| TemplateFill | App.Theme.Colors.Lighter80 |
| Flexible height | On, with Minimum height 240 |
| Selectable | false |
| AccessibleLabel | "Approved overtime hours by person" |
| TabIndex | 0 |
The card. Two Text controls in the gallery's template, each with X 16, Width Parent.TemplateWidth - 32 and Auto height on:
| Control | Y | Text | Style |
|---|---|---|---|
lblPersonRS | 12 | ThisItem.Employee | Size 16, Semibold |
lblPersonHoursRS | lblPersonRS.Y + lblPersonRS.Height + 6 | $"{Text(ThisItem.Hours, "0.00")} hours in {ThisItem.Departments}" | Size 14; PaddingBottom 16 |
The second label's Y follows the first, so a long name pushes it down, and its bottom padding keeps the text off the next card.
I started the card from Part 9's name label, lblEmployeeWA. Pasted with the gallery selected, its copy landed beside the gallery, not in it, so I cut it, selected the template with the gallery's pencil icon, and pasted again (Fixed: New Control Lands Outside the Gallery Instead of Inside It in Power Apps). A second copy inside the template became the hours label. The gallery has to be visible on the canvas for its pencil to show, so I set its Visible to true while I worked on it, and back to its formula after. When I rebuilt the gallery with a flexible height, I moved both labels into the new one the same way, deleted the old gallery and gave the new one its name.
The finished screen in the tree view:
Step 12: Open the Screen, Check and Publish
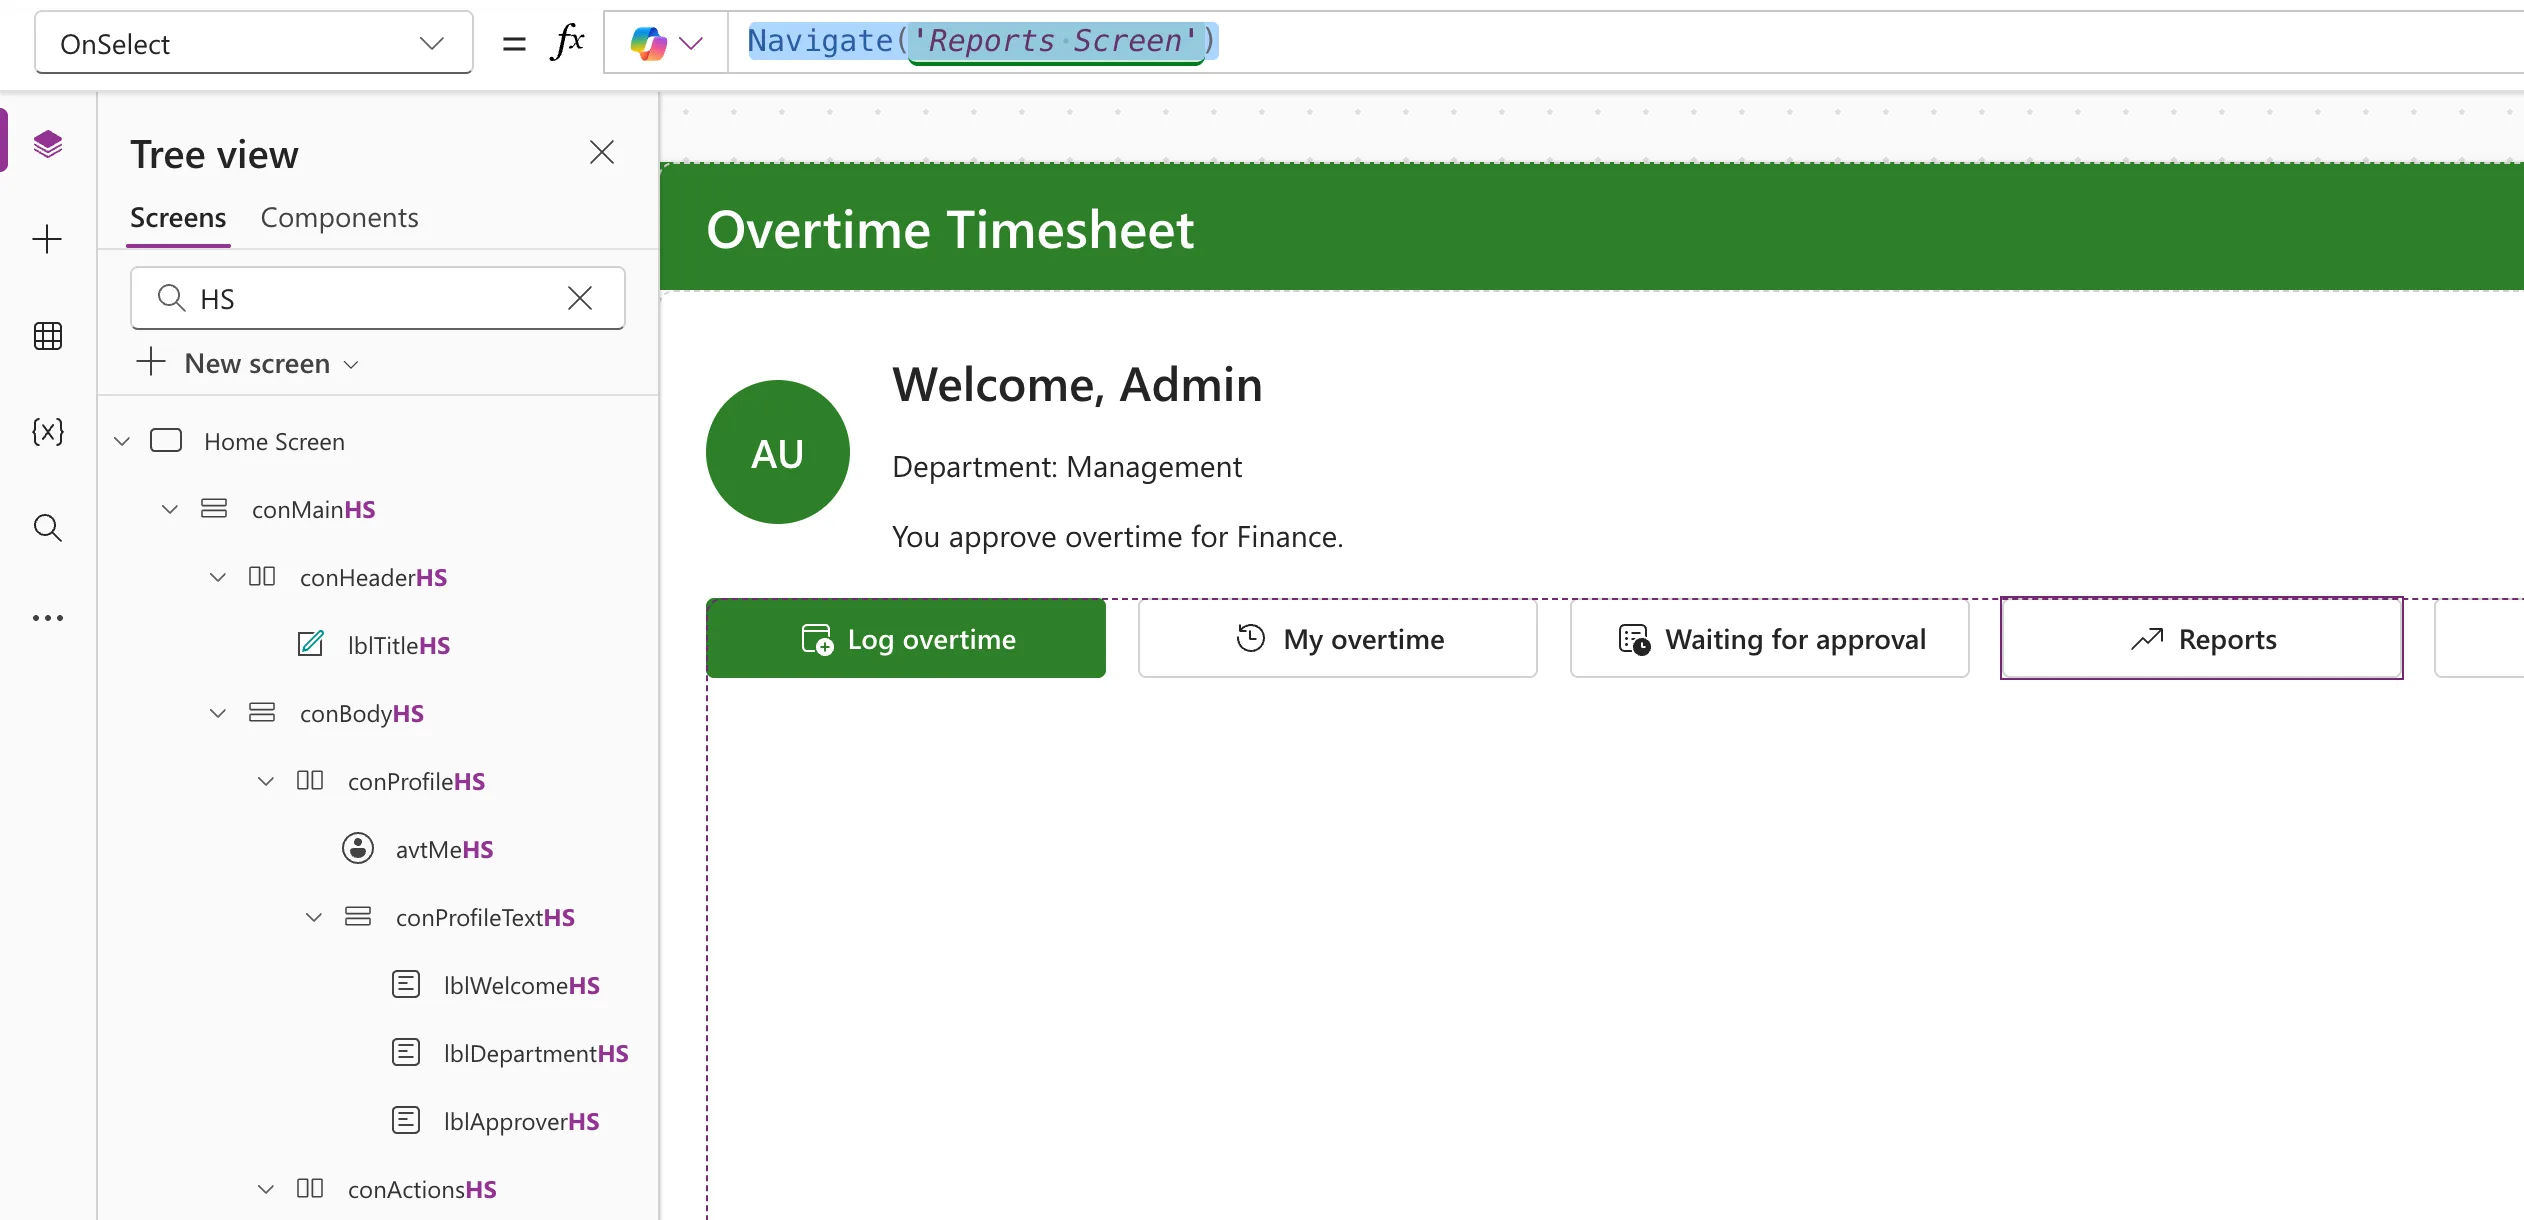
The Home screen's Reports button. btnReportsHS has shown for approvers and payroll staff since Part 5, with OnSelect false. Now it opens the screen (How to Go to Another Screen in Power Apps with Navigate):
Navigate('Reports Screen')
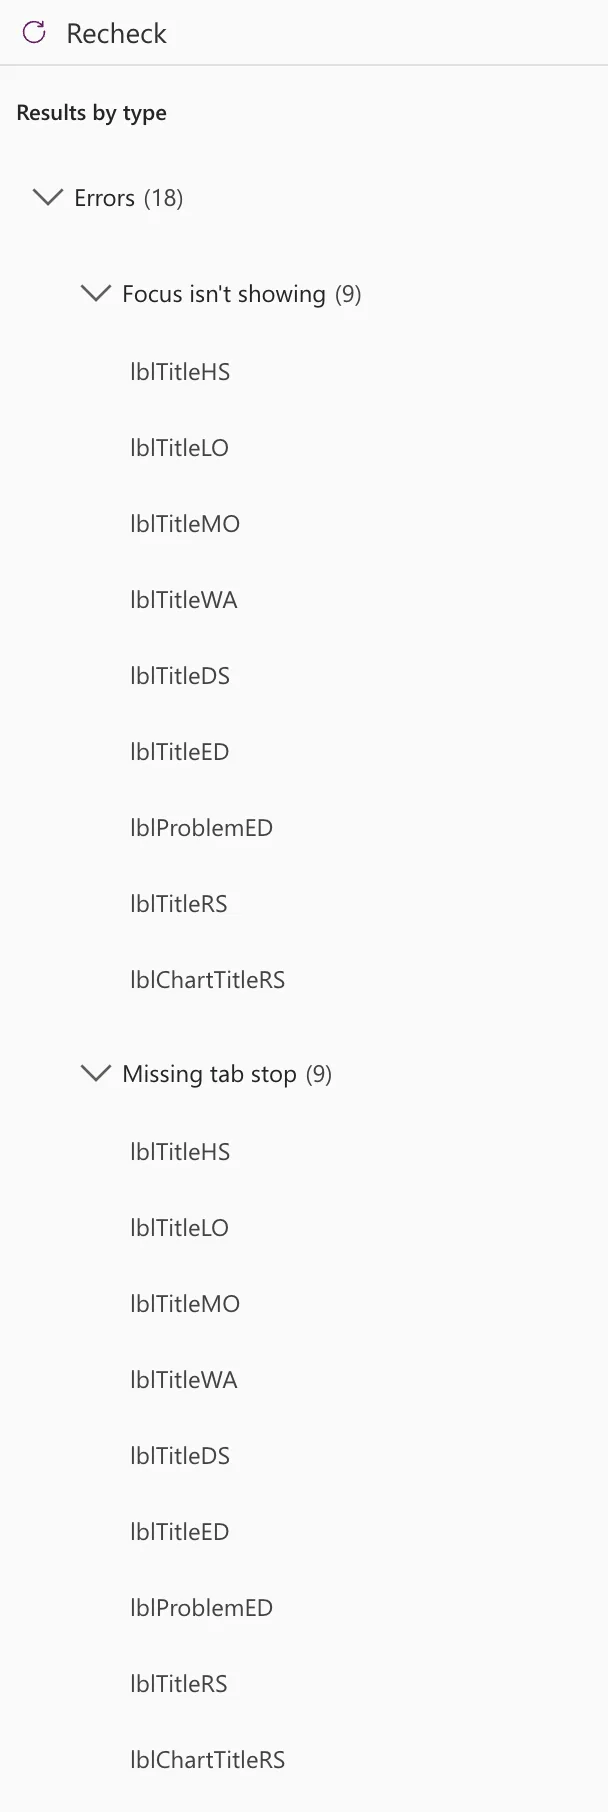
The App checker. Its Accessibility section listed the chart as Missing accessible label, so the chart got the AccessibleLabel from Step 10 (Fixed: "Missing Accessible Label" in the Power Apps App Checker). After Recheck, 18 errors were left, all on headings and messages that do nothing when selected: the titles of the seven screens, lblProblemED and the chart's title. Leave them, as in Parts 5 to 10 (Fixed: "Missing Tab Stop" in the Power Apps App Checker and Fixed: "Focus Isn't Showing" in the Power Apps App Checker):
Try it in Preview, then publish. Save the app, try the screen in Preview, and publish it (How to Publish a Canvas App in Power Apps).
Starting Preview on the Reports screen itself didn't run its OnVisible, so I selected Refresh. The flow ran as me, and the screen said Showing: Finance and No approved overtime in November 2026, because Finance, the only department I approve, had none.
Step 13: Share the App with Payroll and Test It
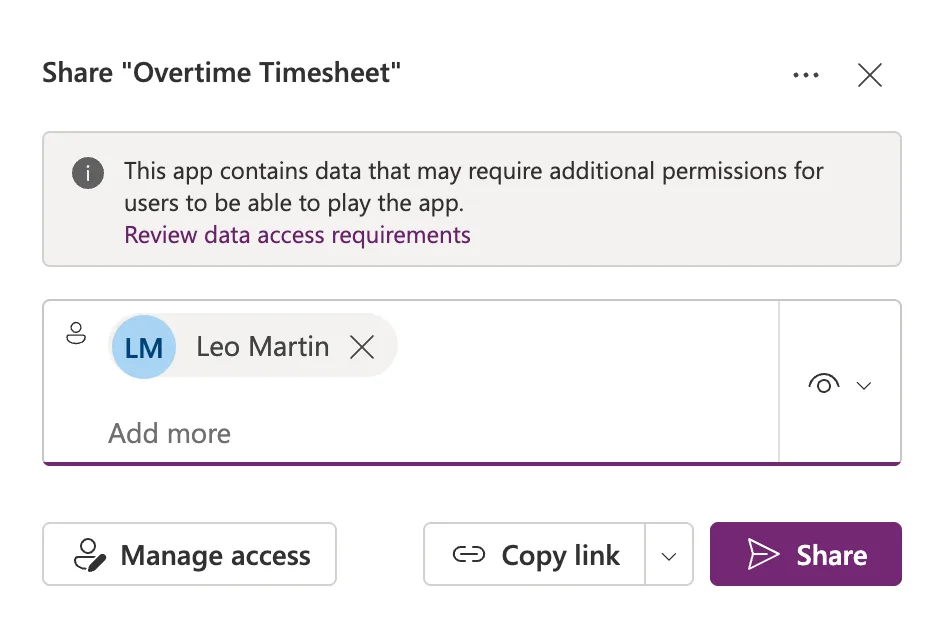
Share the app with Leo. Like the run-only users in Step 6, this share is for testing. Share the app with Leo Martin as User (How to Share a Canvas App with Specific People in Power Apps):
Leo opens the app. I signed in as Leo in his own browser profile. It was his first visit to Power Apps, so it asked for his country or region: I chose United Kingdom, where the demo organization is. My typing in that dialog had ticked the box for tips and offers, so I unticked it before Get started. In Apps > Shared with me, More commands > Play opened the app (How to Find Apps Shared with You in Power Apps), and it asked him to allow its connections (How to Open a Shared Canvas App for the First Time in Power Apps):
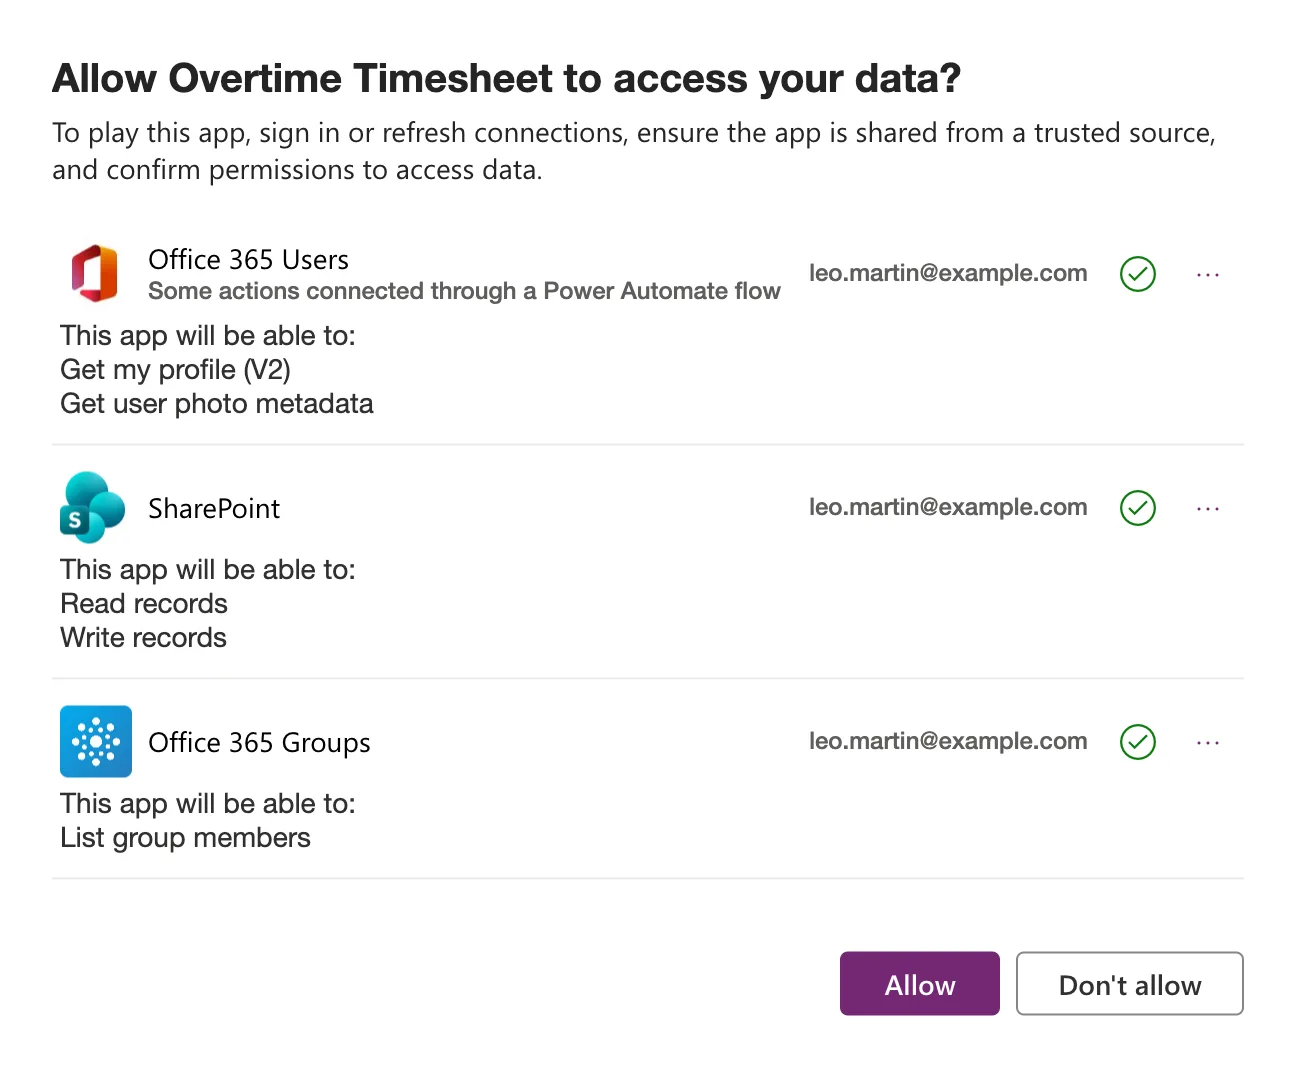
The list matched the app: Office 365 Users, which the app uses and Get Overtime Report uses as him, and the SharePoint and Office 365 Groups connections the app has used since Parts 4 and 5. The flow's SharePoint and Office 365 Groups connections are mine, so they aren't in it. After Allow, his Home screen showed Log overtime, My overtime and Reports.
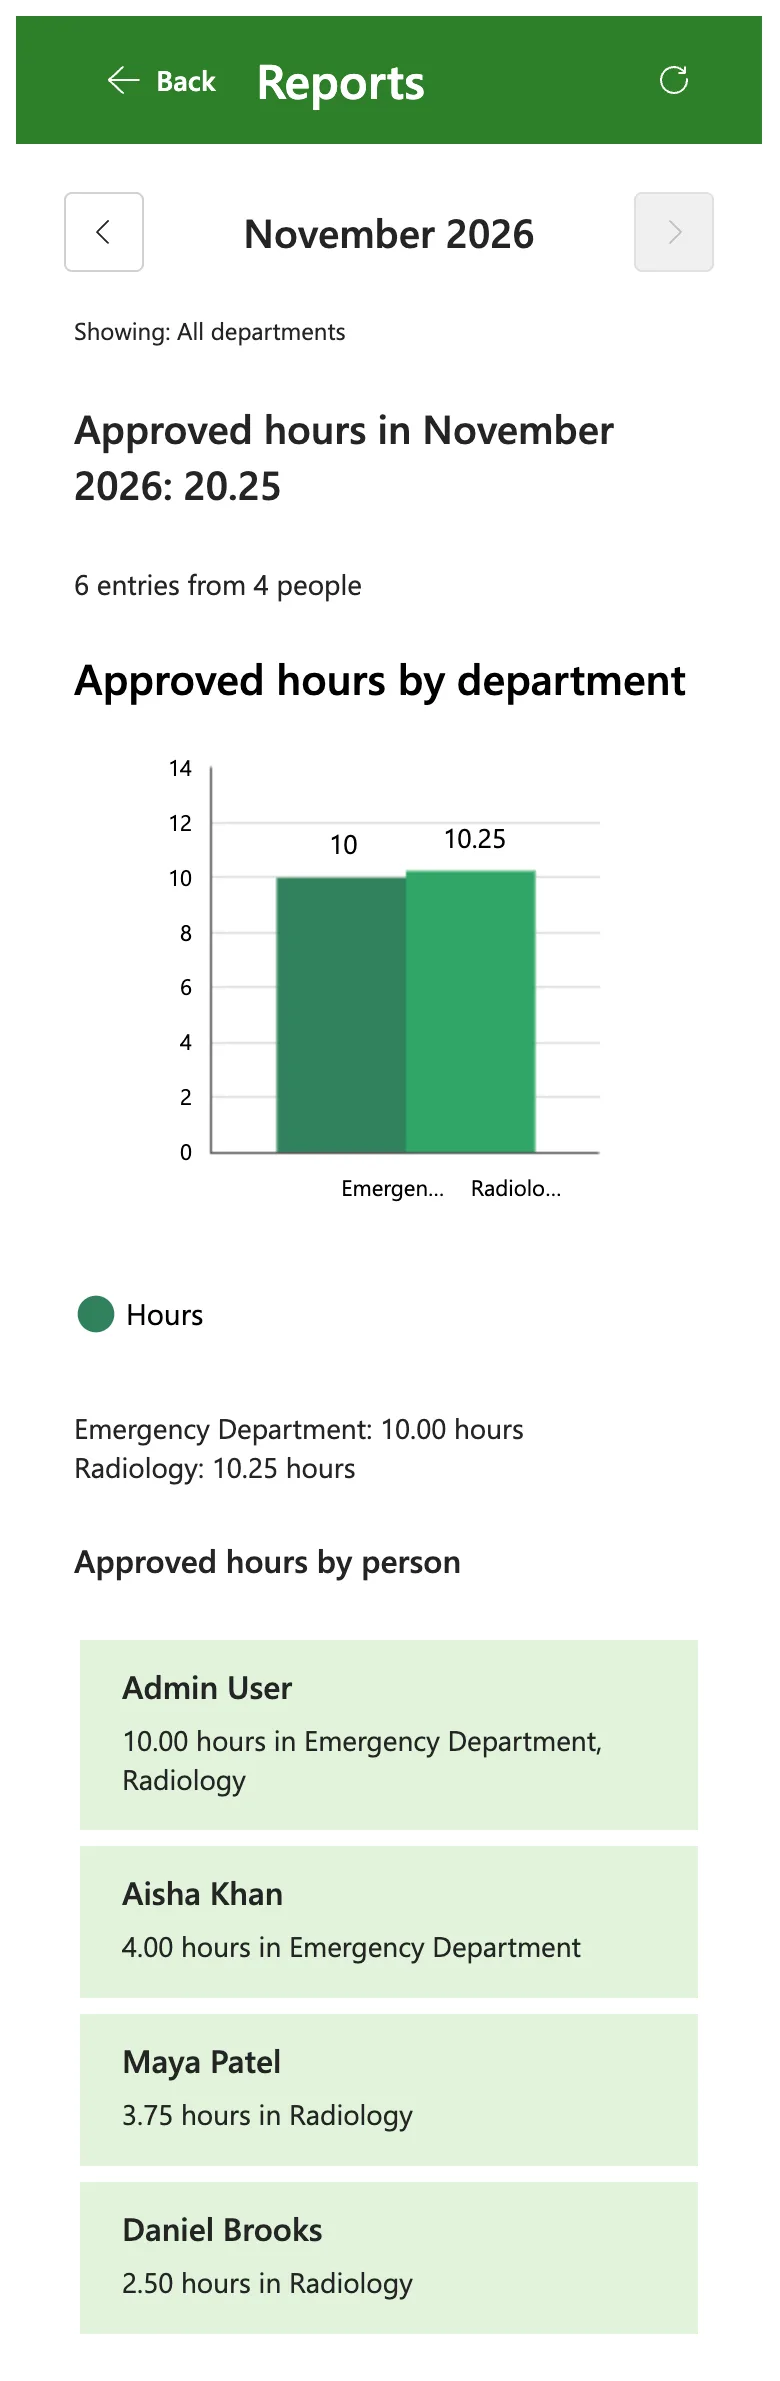
Leo's report. Showing: All departments, 20.25 hours from six entries by four people, as in the picture at the top of this part. In the flow's run history, Is payroll was true in his run.
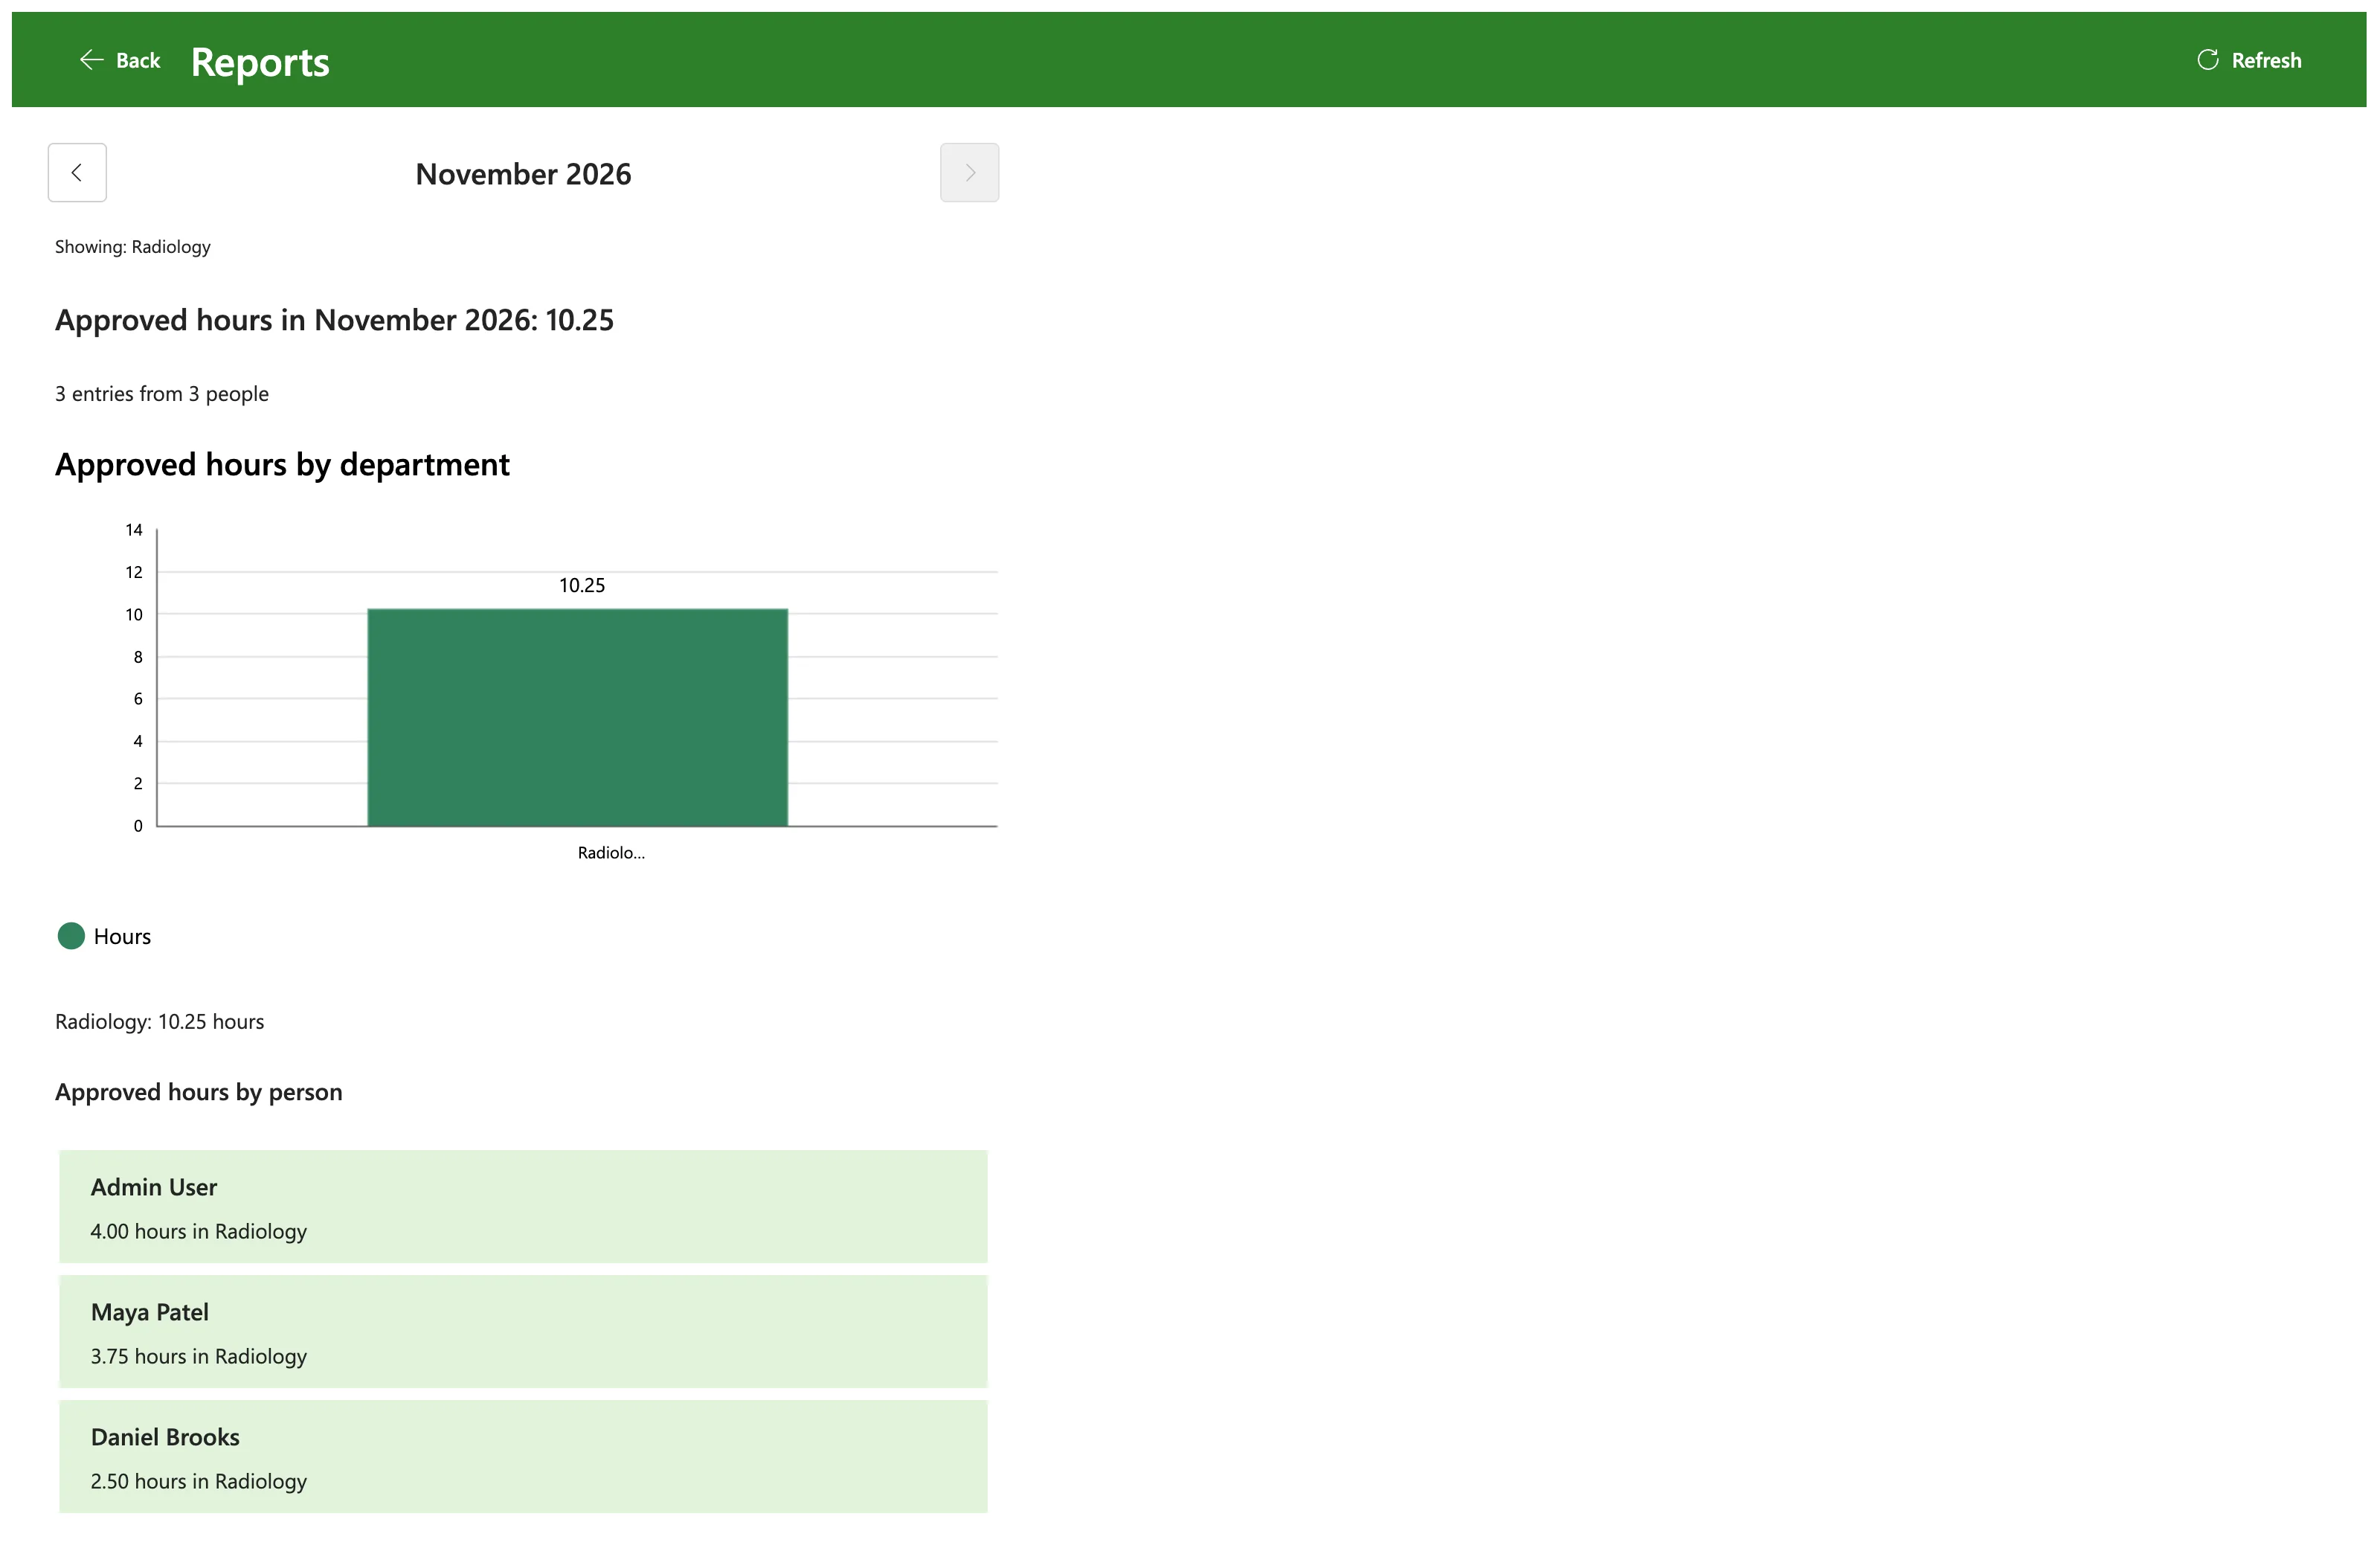
Daniel's report. Daniel Brooks approves Radiology and isn't in payroll. His report showed Radiology only, with his own entry among the three, and Is payroll was false in his run:
Olivia's report. Olivia Bennett approves the Emergency Department and Day Surgery. Her report said Showing: Emergency Department, Day Surgery, with 10.00 hours from three entries by two people. Day Surgery had no approved overtime, so it isn't on the chart.
On a phone. In a browser window 390 pixels wide (How to Test a Power Apps Canvas App on Phone and Tablet Sizes), the header showed only the refresh icon, the total wrapped onto two lines, and the first card grew to fit its two departments:
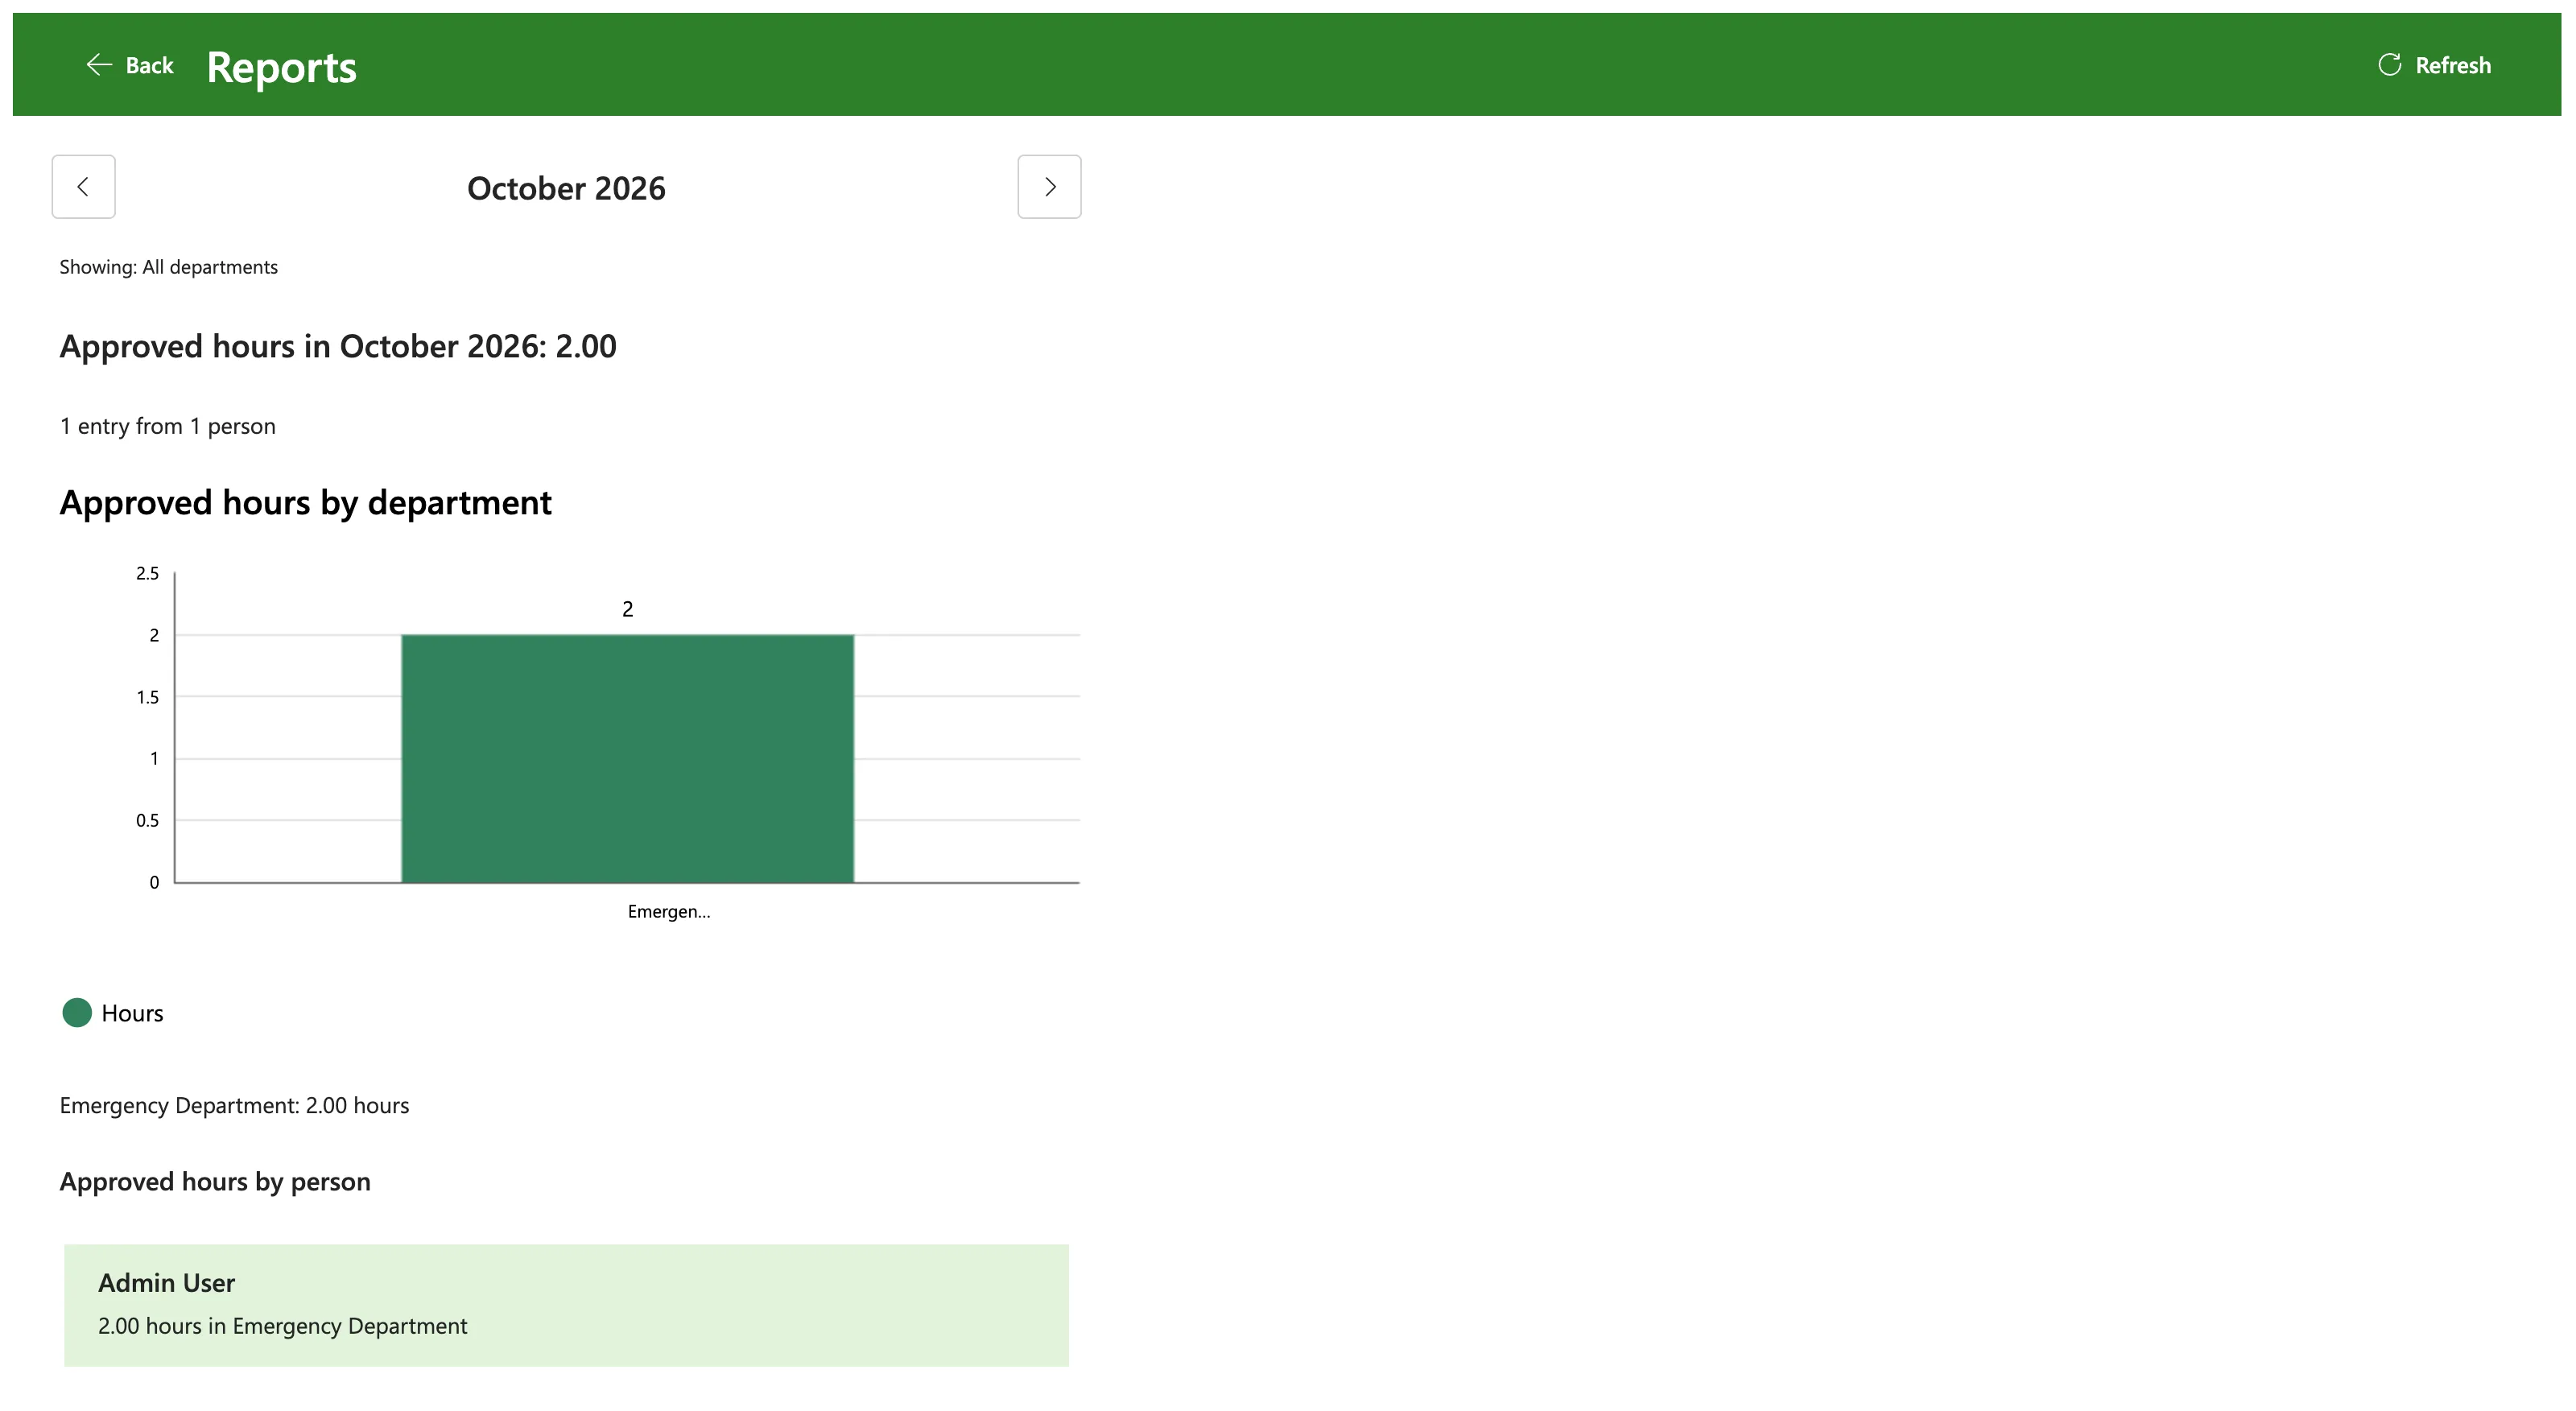
October. One step back, Leo saw 2.00 hours from one entry. My entry of 24 October, whose Status I'd set to Approved by hand in Part 7, wasn't counted: only its Status said Approved, not SharePoint's Approval Status. That's the rule from Step 4 at work:
After each publish. I published four more times while fixing the chart and the gallery. Each time, a tab opened in the first few minutes still ran the version before, and Olivia's first tab still had the one from before this part, where Reports did nothing. A new tab about seven to twelve minutes after publishing got the new version (Fixed: Users Still See the Old Version After You Publish a Canvas App in Power Apps).
What the Report Doesn't Show
- Entries waiting for a decision or rejected. Approvers see what's waiting on the screen from Part 9.
- Entries whose Status was changed by hand. Changing Status in SharePoint leaves Approval Status as it was, so the entry stays out until it's approved.
- Months to come. The forward arrow stops at the current month.
- People's own totals. Staff see their own entries and totals on the My Overtime screen from Part 7, which reads only their own items.
Common Mistakes
| Mistake | What happens | Do this instead |
|---|---|---|
| Counting entries by Status alone | Entries changed by hand in SharePoint count as approved | Check Approval Status too: OData__ModerationStatus eq 0 |
| Passing a Date straight to the flow | TriggerInputSchemaMismatch, and no run in the history | Text(date, "yyyy-mm-dd") |
'yyyy-mm' in formatDateTime | Minutes instead of the month | 'yyyy-MM' |
| Sending the email or the role from the app | Anyone could ask for another department's report | Let the flow find the caller |
| A chart straight in a vertical container | Charts aren't supported in layout containers | A plain Container around it |
| Leaving the axis to the chart | Small differences look huge | SeriesAxisMin 0 |
| A gallery with a fixed row height for wrapping text | The end of a line is cut off on phones | A flexible height gallery with Auto height labels |
| Counting people by name | Two people with the same name count as one | Count their emails with Distinct |
| Counting items from the run view's table | It didn't show every item | Count what the flow returns |
Troubleshooting
| Symptom | Likely cause | Fix |
|---|---|---|
| The report couldn't be loaded and no run in the history | The trigger refused what the app sent | Show FirstError.Message in a Notify for a moment |
| You don't approve any department and you aren't in payroll for a payroll officer | They aren't a direct member of Overtime Payroll, or PayrollGroupId is wrong | Check the group's members and the Settings item |
| An approver sees nothing for a department | They aren't in its Approvers column | Add them on the Departments screen |
| An approved entry is missing | Its Approval Status isn't Approved, or its WorkMonth is another month | Check both columns in SharePoint |
| Run failed with entity Process for a new user | The flow isn't shared with them | Add them as run-only users |
| The chart's names end in … | The chart shortens long labels | Read the totals under the chart |
| A change doesn't show after publishing | The browser has the old version | Open the app again a few minutes later |
FAQ
Why does payroll get everything when they also approve a department?
Is payroll comes first in the or(): when it's true, every entry is kept, whatever else is true. A payroll officer who also approves a department sees all departments, and scope says All departments.
Can a month have too many entries?
Get the approved entries returns up to 5,000. Past that, Microsoft documents turning on pagination in the action's settings (How to Sort SharePoint Items and Get More Than 100 in Power Automate).
Does every report call the group's API?
Yes: each run lists the payroll members once, with my Office 365 Groups connection. Microsoft's connector reference limits it to 100 calls per connection every 60 seconds, which is 100 reports a minute.
Does this need premium licenses?
No. SharePoint, Office 365 Users and Office 365 Groups are standard connectors. As in Part 9, the flow runs on the license of the person using the app.
Why work out the totals in the app instead of in the flow?
The app has the rows anyway, and GroupBy, Sum and Distinct in the app keep the flow short. The flow returns four fields per entry, so the data is small.
Conclusion
Approvers and payroll now have a Reports screen:
- Get Overtime Report, a flow with a Month input, which finds out who's asking and whether they're in Overtime Payroll;
- entries counted only when both Status and Approval Status say Approved, read with the owner's SharePoint connection;
- every department for payroll, and their own departments for approvers, decided in the flow;
- a screen that loads a month at a time, with the month's total, the number of entries and people, a column chart by department with the totals as text under it, and a card per person;
- the flow and the app shared with the payroll officer and two approvers for testing, and checked as each of them and on a phone.
Part 12 imports the old Excel timesheet into SharePoint, and Part 13 adds the payroll workbook to this screen.
Additional Resources
- Use Power Automate pane: adding and running flows in canvas apps.
- Text function: dates as text, and the placeholders
yyyy,mmanddd. - In-depth analysis into Get items and Get files: filter queries and item limits.
- Office 365 Groups connector: List group members and its limits.
- Column chart and line chart controls: properties and accessibility guidelines.
- Building responsive canvas apps: layout containers and their known issues.
- Show items of different heights in a canvas app gallery: flexible height galleries.
← Previous: Part 10: Build the Departments Screen Next → Part 12: Import the Old Excel Timesheet (coming soon)
