How to View a Run's Artifacts in the MLflow UI

Every file a run logs, with log_artifact, log_table, log_dict, log_text or log_figure, appears on the run's Artifacts tab in the MLflow UI. There you can browse its folders, preview most common file types, copy a file's address and download it, and on the compare page you can read the same file from several runs side by side. This guide walks through each, with real screens from MLflow 3.18.0.
Step 1: Open the Artifacts Tab
Open a run, from its link in your script's output or from the runs table, and click Artifacts, next to Overview, Model metrics, System metrics and Traces. You can also go straight there by adding /artifacts to the run page's address.
The left side is a tree of the run's files. Folders have an arrow: click a folder to expand it, and a file to preview it. Until you pick one, the right side reads "Select a file to preview" and lists the kinds the UI can show: "image, text, markdown, html, pdf, audio, video, geojson files".
Step 2: Preview a File
The run below logged houses.csv twice, at the top level and in a data folder. With data/houses.csv selected:
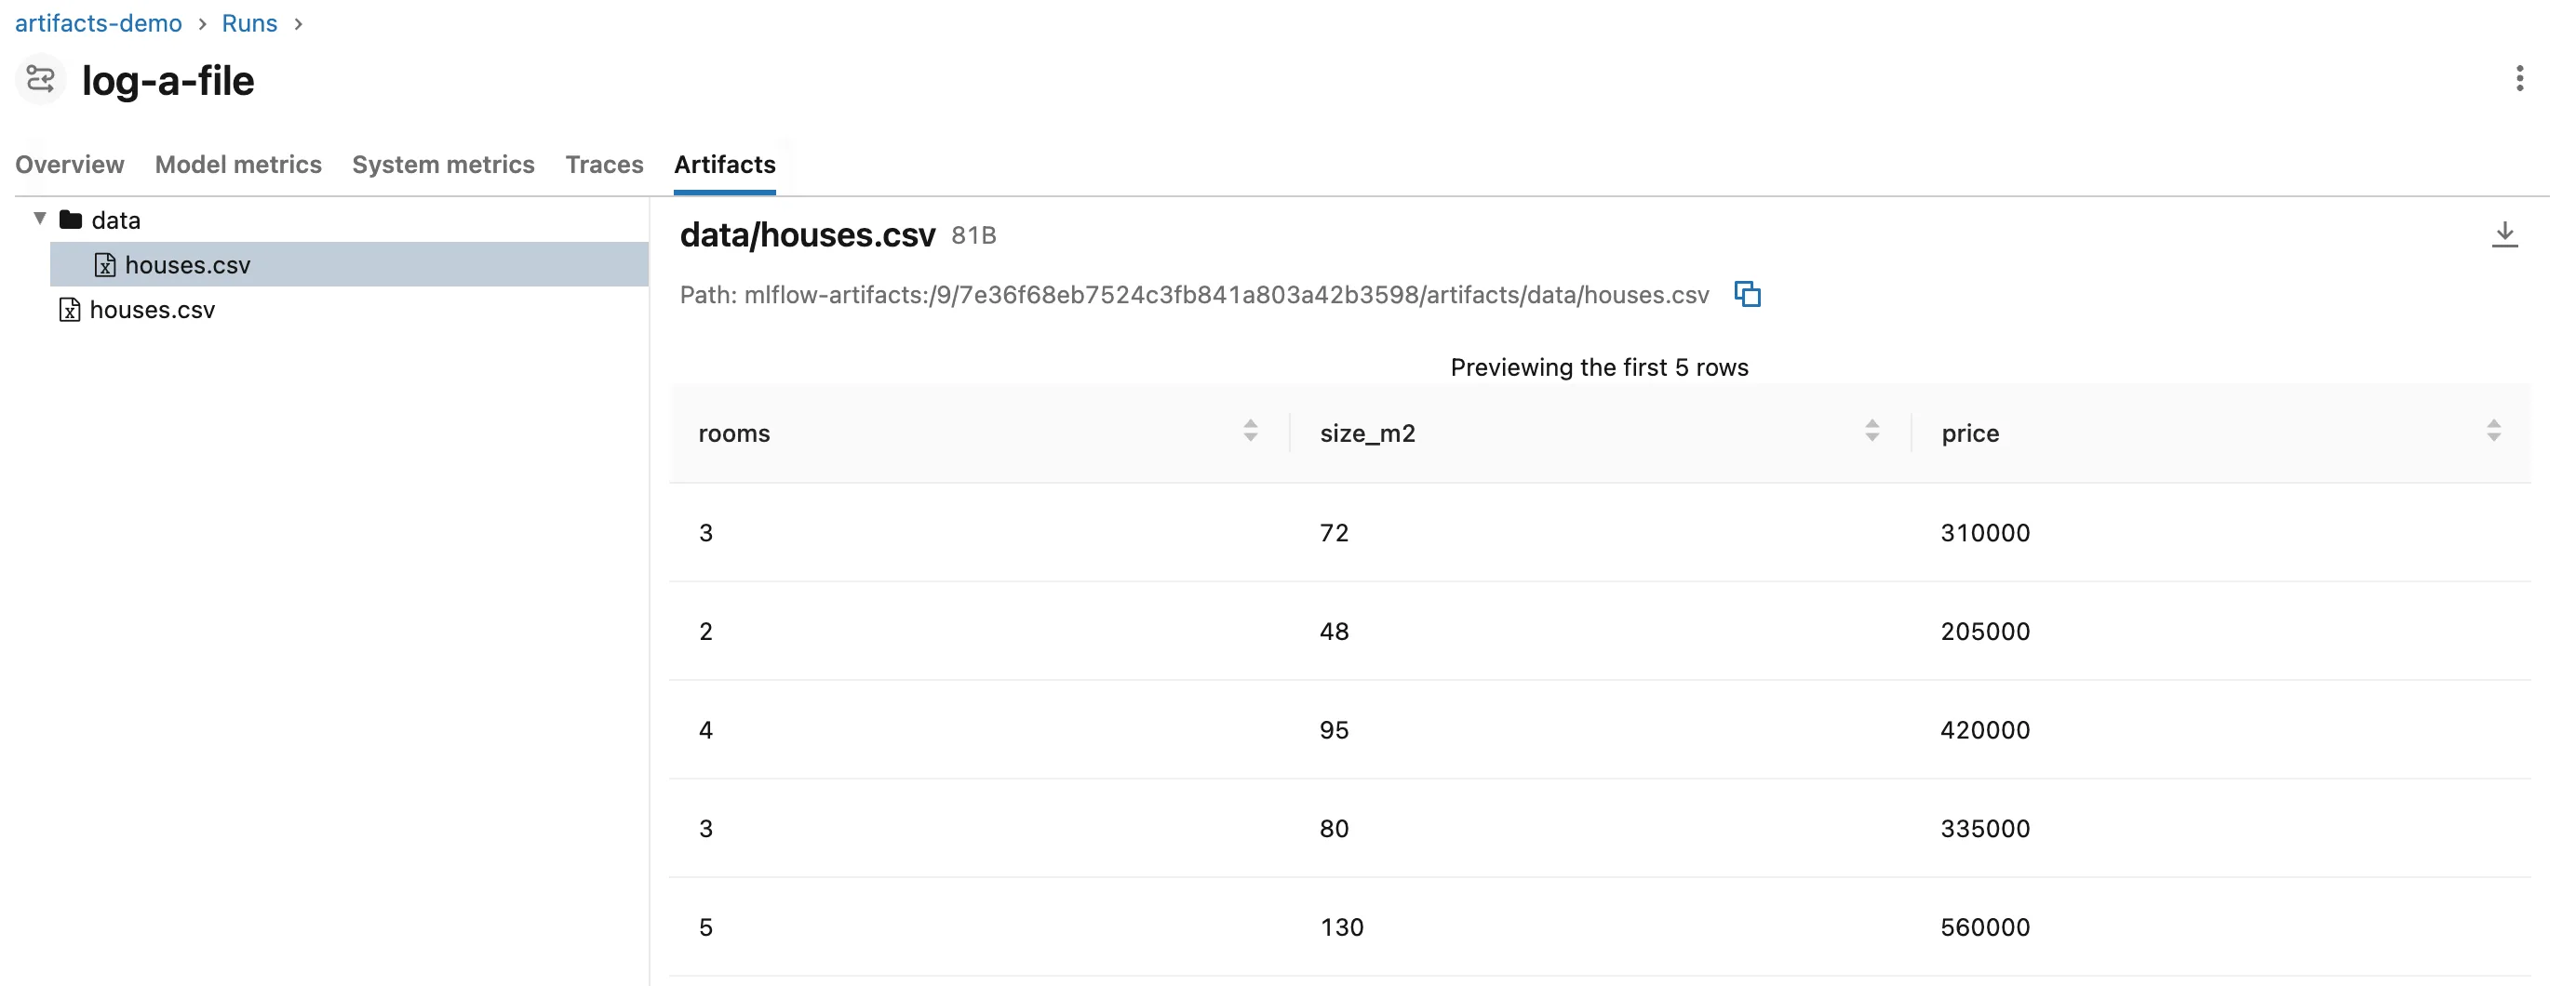
Every preview has the same header:
- The file's name and size, here
data/houses.csvand 81 bytes. - Path, the file's address on the tracking server:
mlflow-artifacts:/followed by the experiment ID, the run ID,artifactsand the file's place in the run. The button next to it copies it. - The download button at the top right, "Download artifact", which saves the file to your computer.
How the file itself is shown depends on its type:
- CSV files become a table, "Previewing the first 500 rows" at most, and each column's arrows sort by it.
- JSON and YAML files show as formatted, coloured text.
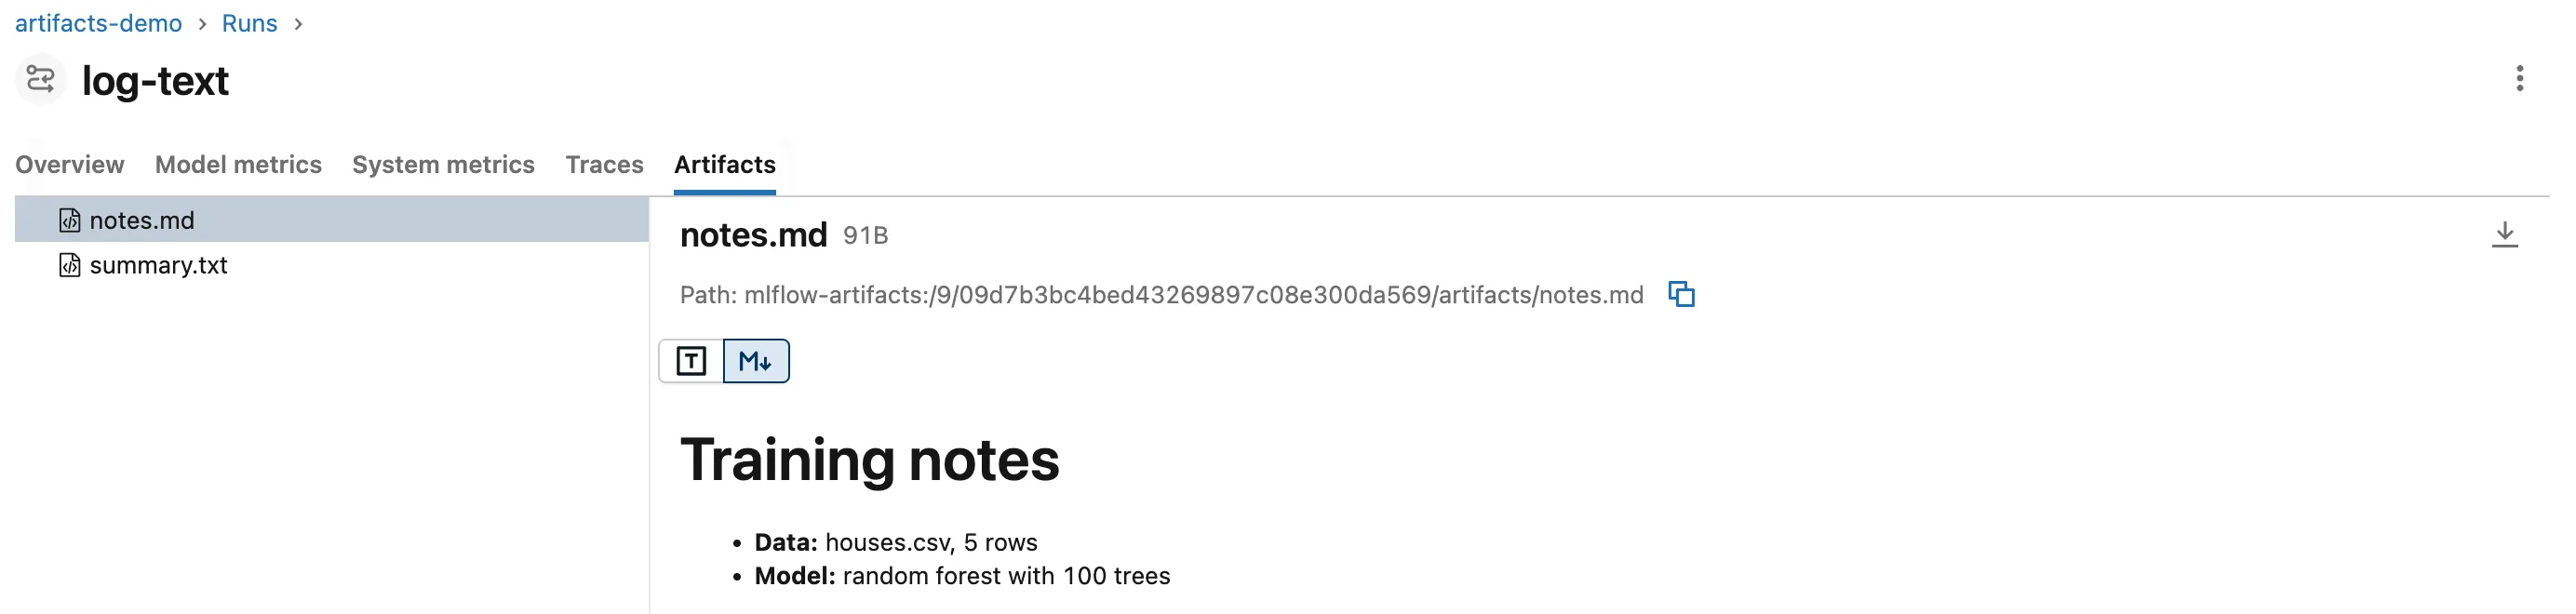
- Markdown files are rendered, with a switch between the plain text (T) and the rendered page (M↓):
- Images, such as charts logged with
log_figure, show as the picture itself.
Step 3: View a Logged Table as a Table
A JSON file saved with mlflow.log_table() gets a View as table box above it, ticked by default:
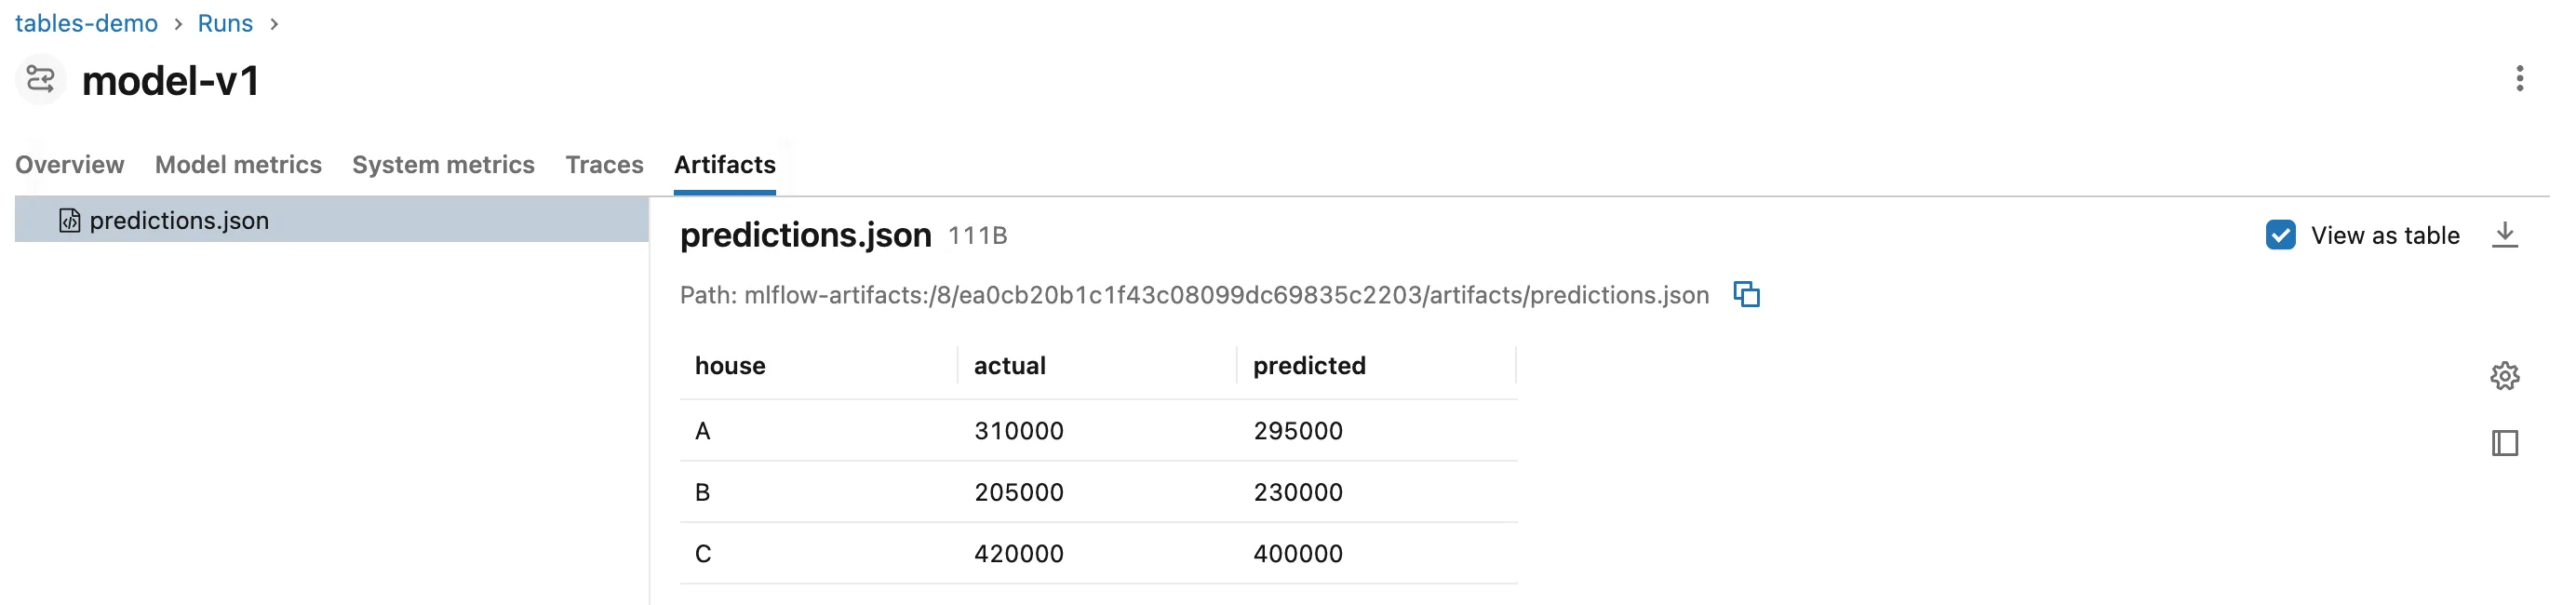
Untick it to see the JSON as it's stored. Other JSON files, such as those from log_dict, have no such box, because MLflow only marks files from log_table as tables.
Step 4: Compare a File Across Runs
Select two or more runs in the runs table and click Compare. Near the bottom of the compare page, the Artifacts section lists the runs' files; click one to see it from every run, side by side:
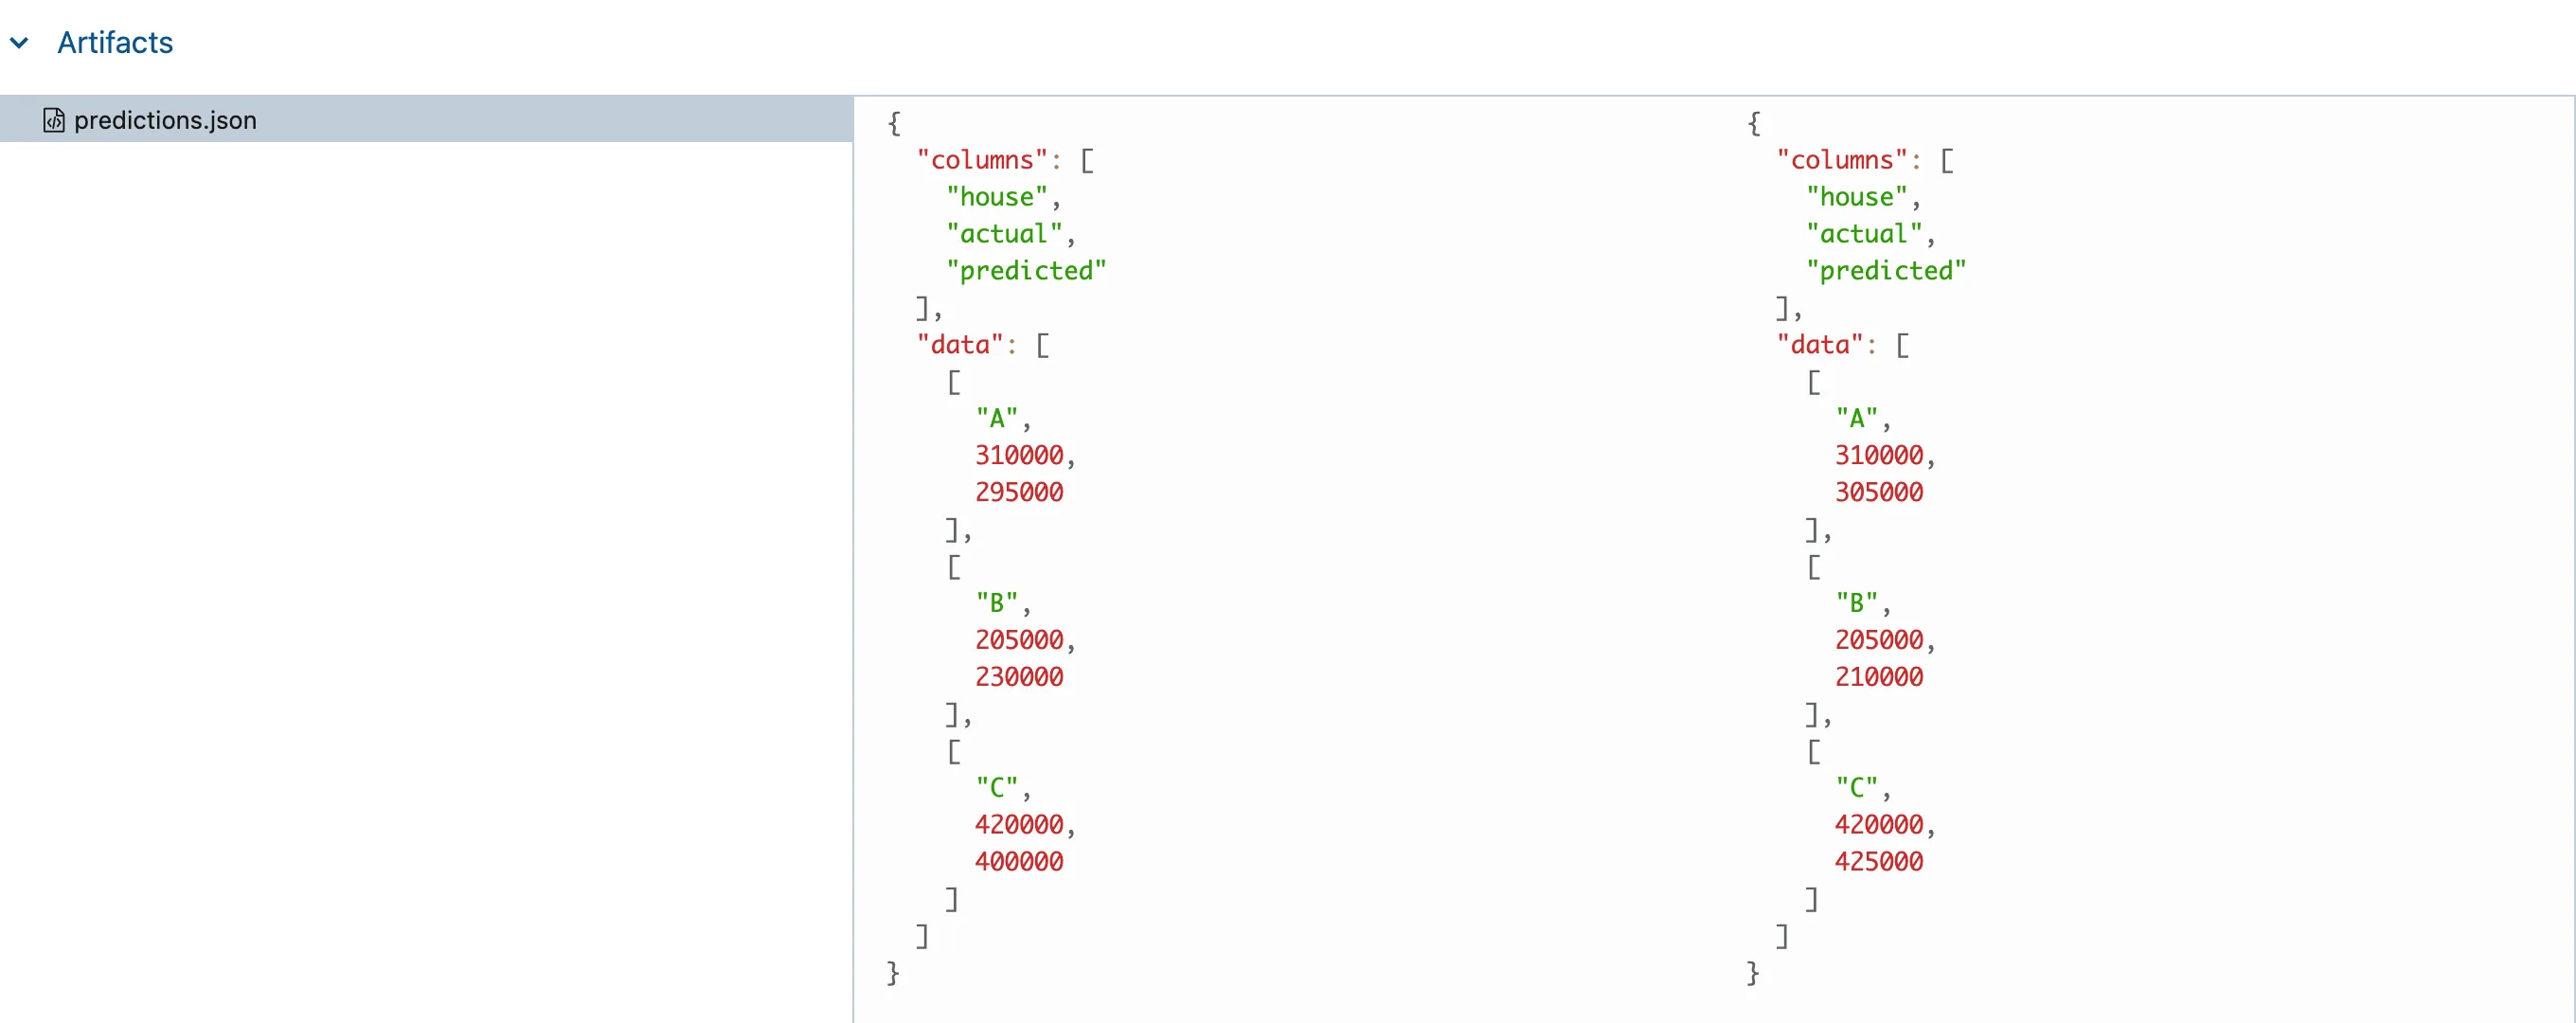
Two things to know about this section: it lists only files at the top level of the runs' artifacts, not files inside folders, and it shows logged tables as JSON. For tables, the runs page has a dedicated view: How to Compare a Logged Table Across Runs in the MLflow UI.
Common Mistakes
| Mistake | What happens | Do this instead |
|---|---|---|
| Looking for a file inside a folder on the compare page | Only top-level files are listed there | Log files you'll compare at the top level, or open each run's Artifacts tab |
| Looking for logged datasets on the Artifacts tab | A dataset logged with log_input is a description, not a file | Find it under Datasets on the run page |
| Expecting the CSV preview to show a whole large file | It shows the first 500 rows | Download the file to see all of it |
Troubleshooting
| Symptom | Likely cause | Fix |
|---|---|---|
| The Artifacts tab is empty | The run logged no files, or logged them to another run | Check that the logging calls ran inside this run |
| A JSON table has no View as table box | It was saved with log_artifact or log_dict | Save tables with log_table |
FAQ
Where are the files stored?
On the tracking server's artifact storage; the Path shows the address. For a local server started with mlflow server, that's its mlartifacts folder: How to See Where MLflow Stores Runs and Artifacts.
Can I download a whole folder?
The UI's button downloads one file at a time. To get a folder, use mlflow artifacts download or Python: How to Download Artifacts from an MLflow Run.
Can I preview a file without opening the run?
The runs page's artifact view shows logged tables from many runs at once; for other files, open the run's Artifacts tab.
Conclusion
The Artifacts tab shows a run's files as a folder tree, previews CSV, JSON, YAML, Markdown and images, gives each file's mlflow-artifacts: path and a download button, and shows log_table files as tables. The compare page puts the same top-level file from several runs side by side.
Additional Resources
- MLflow Tracking: artifacts — MLflow's overview of what a run records.
- Artifact stores — where a tracking server keeps the files.
