How to Turn On System Metrics Logging in MLflow

MLflow can record what the computer is doing while a run works: CPU use, memory, disk and network. On a long training job, that shows whether the model is starved for memory or using every core. It's off by default and needs one extra package. This guide turns it on three ways and reads the results, with real output from MLflow 3.18.0.
Syntax
import mlflow

with mlflow.start_run(log_system_metrics=True):  # this run only
    ...

mlflow.enable_system_metrics_logging()  # every run this program starts from now on
| Part | What it means |
|---|---|
log_system_metrics=True | Records system metrics for this one run. False turns them off for this run, whatever else is set |
mlflow.enable_system_metrics_logging() | Turns them on "globally" for the program. MLflow's reference adds that you "can still opt out" one run with log_system_metrics=False |
mlflow.disable_system_metrics_logging() | Turns them off again |
MLflow samples the computer every 10 seconds by default; How to Change the System Metrics Sampling Interval in MLflow changes that.
Prerequisites
- MLflow and psutil in a uv project:
uv add mlflow psutil. MLflow's documentation says: "To log system metrics in MLflow, please install psutil. We explicitly don't include psutil in MLflow's dependencies". How to Check CPU and Memory Usage in Python with psutil introduces psutil itself. - A running tracking server at
http://127.0.0.1:8080: How to Start an MLflow Tracking Server on Your Computer.
Step 1: Turn It On for One Run
The example keeps one CPU core busy for five seconds, the stand-in for a short training job. Create system_metrics_demo.py:
import time

import mlflow

mlflow.set_tracking_uri("http://127.0.0.1:8080")
mlflow.set_experiment("system-metrics-demo")
mlflow.set_system_metrics_sampling_interval(1)

with mlflow.start_run(run_name="busy-for-5-seconds", log_system_metrics=True) as run:
    end = time.time() + 5
    while time.time() < end:
        sum(i * i for i in range(10_000))  # keep one CPU core busy

metrics = mlflow.MlflowClient().get_run(run.info.run_id).data.metrics
for key in sorted(metrics):
    print(f"{key}: {metrics[key]}")
| Line | What it does |
|---|---|
mlflow.set_system_metrics_sampling_interval(1) | Samples every second instead of every 10, so a five-second run gets several samples |
log_system_metrics=True | Turns system metrics on for this run |
The while loop | Keeps the CPU busy until five seconds have passed |
| The last three lines | Print the latest value of every metric the run recorded |
Step 2: Run It
uv run python system_metrics_demo.py
2026/11/18 11:04:21 INFO mlflow.tracking.fluent: Experiment with name 'system-metrics-demo' does not exist. Creating a new experiment.
2026/11/18 11:04:21 INFO mlflow.system_metrics.system_metrics_monitor: Skip logging GPU metrics. Set logger level to DEBUG for more details.
2026/11/18 11:04:21 INFO mlflow.system_metrics.system_metrics_monitor: Started monitoring system metrics.
🏃 View run busy-for-5-seconds at: http://127.0.0.1:8080/#/experiments/3/runs/e5595bb8307142d49a66cb6123db3079
🧪 View experiment at: http://127.0.0.1:8080/#/experiments/3
2026/11/18 11:04:26 INFO mlflow.system_metrics.system_metrics_monitor: Stopping system metrics monitoring...
2026/11/18 11:04:26 INFO mlflow.system_metrics.system_metrics_monitor: Successfully terminated system metrics monitoring!
system/cpu_utilization_percentage: 79.2
system/disk_available_megabytes: 137535.8
system/disk_usage_megabytes: 12641.8
system/disk_usage_percentage: 8.4
system/network_receive_megabytes: 0.2877440000002025
system/network_transmit_megabytes: 0.16691199999996797
system/system_memory_usage_megabytes: 6210.6
system/system_memory_usage_percentage: 36.2
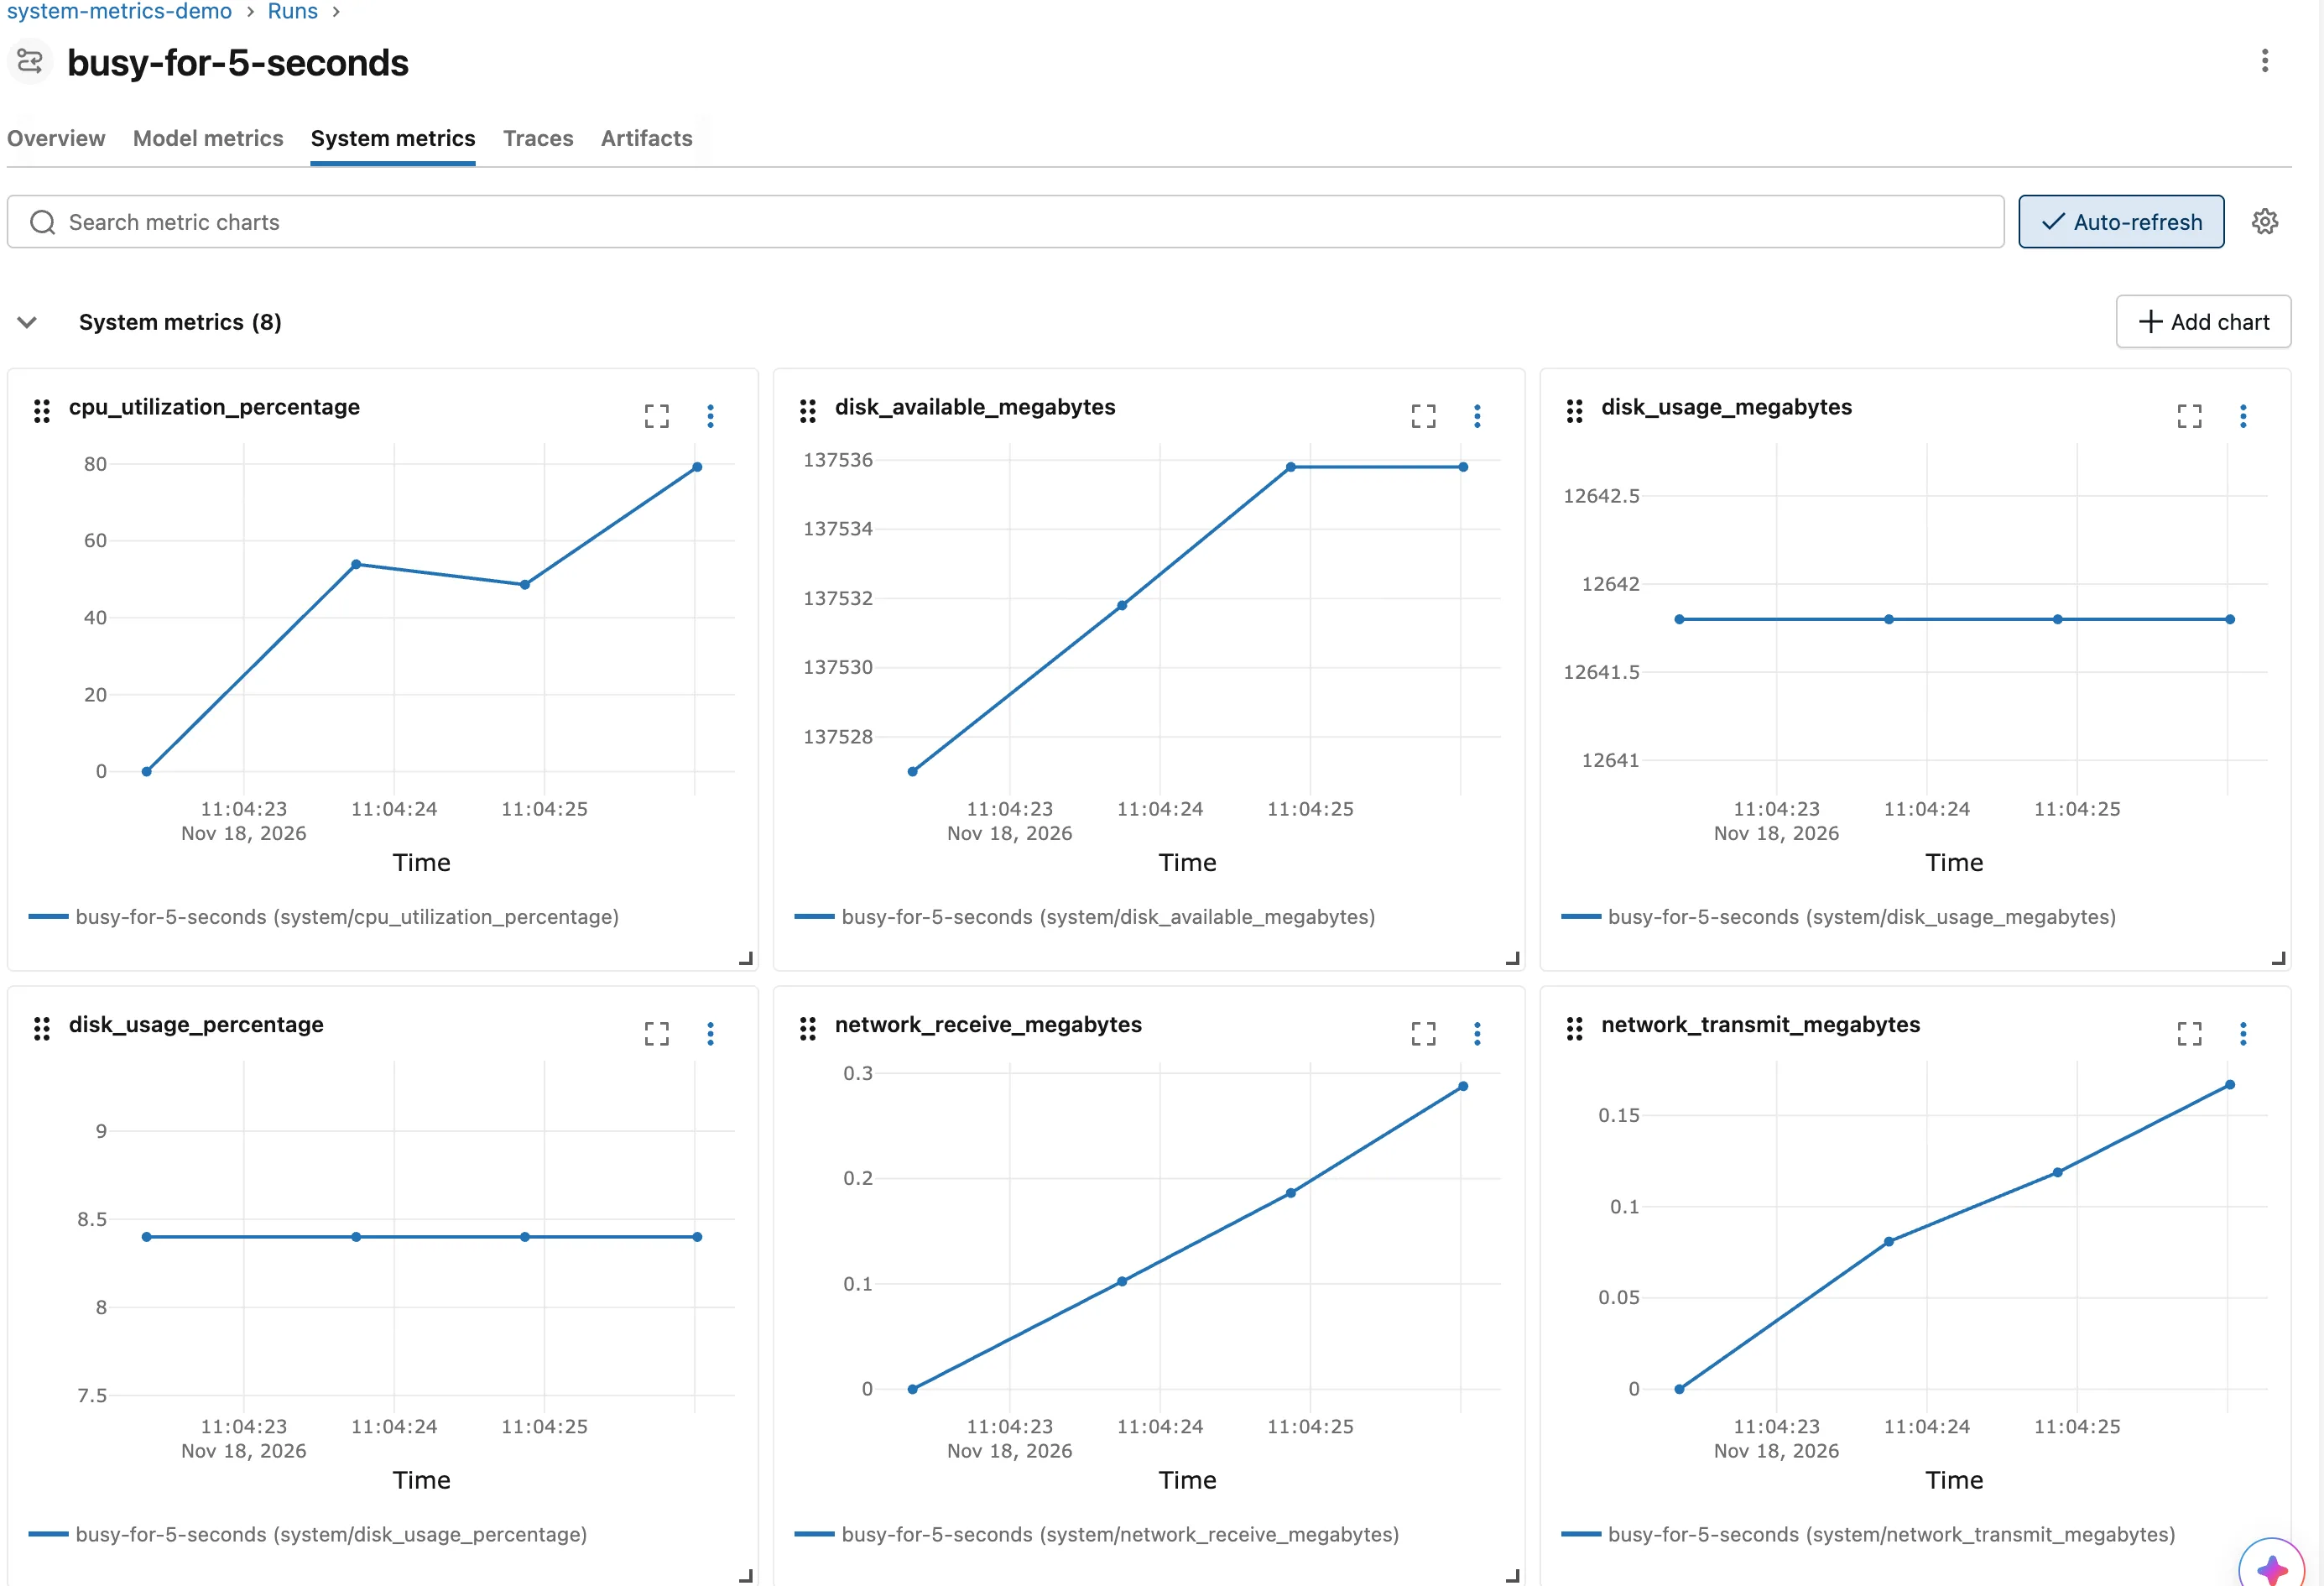
MLflow started a monitor when the run began and stopped it when the run ended. In between, it recorded eight metrics, each named with a system/ prefix. "Skip logging GPU metrics" means MLflow couldn't start a monitor for an NVIDIA or an AMD graphics card, which is expected on a Mac.
Step 3: See the Charts
Open the run and click System metrics. Each metric gets a chart, with Time along the bottom, not Step:
Step 4: Turn It On for Every Run
To record system metrics for every run a program starts, call mlflow.enable_system_metrics_logging() once before the runs. To do it without touching the code, set the environment variable MLflow reads, MLFLOW_ENABLE_SYSTEM_METRICS_LOGGING, before you start the program:
- macOS / Linux
- Windows (PowerShell)
MLFLOW_ENABLE_SYSTEM_METRICS_LOGGING=true uv run python train.py
$env:MLFLOW_ENABLE_SYSTEM_METRICS_LOGGING = "true"
uv run python train.py
Remove-Item Env:MLFLOW_ENABLE_SYSTEM_METRICS_LOGGING
Here train.py stands for your own script. Both ways recorded system metrics for runs that never passed log_system_metrics=True, and a run with neither recorded none.
What the Numbers Mean
The first CPU sample is always 0.0. MLflow reads CPU use with psutil's cpu_percent(), and psutil's documentation says its first call "will return a meaningless 0.0 value which you are supposed to ignore". psutil keeps that "first call" separately for every thread, and MLflow starts a new monitoring thread for every run, so every run's chart starts at 0.
CPU use is the whole computer's. cpu_utilization_percentage covers everything running, not only your program. Here it read 79.2% while the demo kept one core busy, because other programs were working too.
Memory percentage comes from psutil's used figure. In MLflow 3.18.0, system_memory_usage_percentage is used divided by total memory. psutil calls used "designed for informational purposes only" and recommends available for monitoring, so MLflow's 36% here is far lower than the 80% psutil's own percent reported on the same Mac a few minutes later.
Common Mistakes
| Mistake | What happens | Do this instead |
|---|---|---|
| Turning it on without psutil | The run doesn't start: MlflowException: Failed to start system metrics monitoring as package psutil is not installed | uv add psutil |
| Keeping the default 10-second interval for a short run | The run ends before a sample is logged, and the tab stays empty | Sample more often than the run lasts: Fixed: "No charts in this section" on the MLflow System Metrics Tab |
| Reading the first CPU sample as real | It's always 0.0 | Read from the second sample on |
| Comparing MLflow's memory percentage with the task manager | They're calculated differently | Compare the trend over time, not the exact figure |
Troubleshooting
| Symptom | Likely cause | Fix |
|---|---|---|
mlflow.exceptions.MlflowException: Failed to start system metrics monitoring as package `psutil` is not installed. | psutil is missing from the project | uv add psutil. MLflow's message also offers turning system metrics off |
| System metrics (0), "No charts in this section" | The run ended before the first sample was logged | A shorter interval: see the fix above |
Skip logging GPU metrics | MLflow couldn't start a monitor for an NVIDIA or AMD graphics card | Expected on a computer without one |
FAQ
Does it slow the run down?
It samples in a separate thread, once per interval. Each sample also asks the tracking server whether the run is still going, so a very short interval means more requests to the server.
Can I record GPU use?
MLflow's documentation lists extra packages for NVIDIA and AMD cards. On a computer without one, MLflow skips GPU metrics, as the output above shows.
Do system metrics count as model metrics?
No. They appear on their own System metrics tab, named with system/, and the Model metrics tab doesn't include them.
Conclusion
With psutil installed, log_system_metrics=True recorded eight system/ metrics for one run, and mlflow.enable_system_metrics_logging() or MLFLOW_ENABLE_SYSTEM_METRICS_LOGGING=true did the same for every run. The charts plot against time, every run's first CPU sample is a meaningless 0.0, and the CPU figure covers the whole computer.
Additional Resources
- System Metrics — MLflow's guide to system metrics.
- psutil.cpu_percent — how psutil measures CPU use.
