How to Total Each Group in Power Apps with GroupBy and Sum

To total each group of records, group them with GroupBy, then add a column with AddColumns whose value is Sum over the group's nested table. Microsoft's own GroupBy reference describes this pattern. Grouping a person's overtime by week gives totals such as 26/10/2026: 6.00 hours.
The example is the Overtime Timesheet app, whose My Overtime screen shows each week's total, Monday to Sunday.
Prerequisites
- Grouping: How to Group Records in Power Apps with GroupBy.
- Adding up: How to Add Up a Column in Power Apps with Sum.
- Adding a column: How to Add a Column to a Table in Power Apps with AddColumns.
Step 1: Group the Records
The entries grouped by the Monday of their week, as in the GroupBy guide:
GroupBy(AddColumns(locLoadedMO, WeekStart, MondayOf(WorkDate)), WeekStart, WeekEntries)
Each row is a week: its WeekStart, and its entries in WeekEntries.
Step 2: Add Each Group's Total
AddColumns works out a formula for each row. In a grouped table, WeekEntries is that row's own table of entries, so Sum(WeekEntries, Hours) is the week's total:
AddColumns(
    GroupBy(AddColumns(locLoadedMO, WeekStart, MondayOf(WorkDate)), WeekStart, WeekEntries),
    WeekHours,
    Sum(WeekEntries, Hours)
)
To see the result in Studio's preview strip, I joined the weeks into one line with Concat in a text control for a moment:
Concat(
    AddColumns(
        GroupBy(AddColumns(locLoadedMO, WeekStart, MondayOf(WorkDate)), WeekStart, WeekEntries),
        WeekHours,
        Sum(WeekEntries, Hours)
    ),
    $"{Text(WeekStart, "dd/mm/yyyy")}: {Text(WeekHours, "0.00")} hours",
    "; "
)
The week of 26 October has 2 and 4 hours, and the week of 2 November 3 and 4:

How the Example Uses It
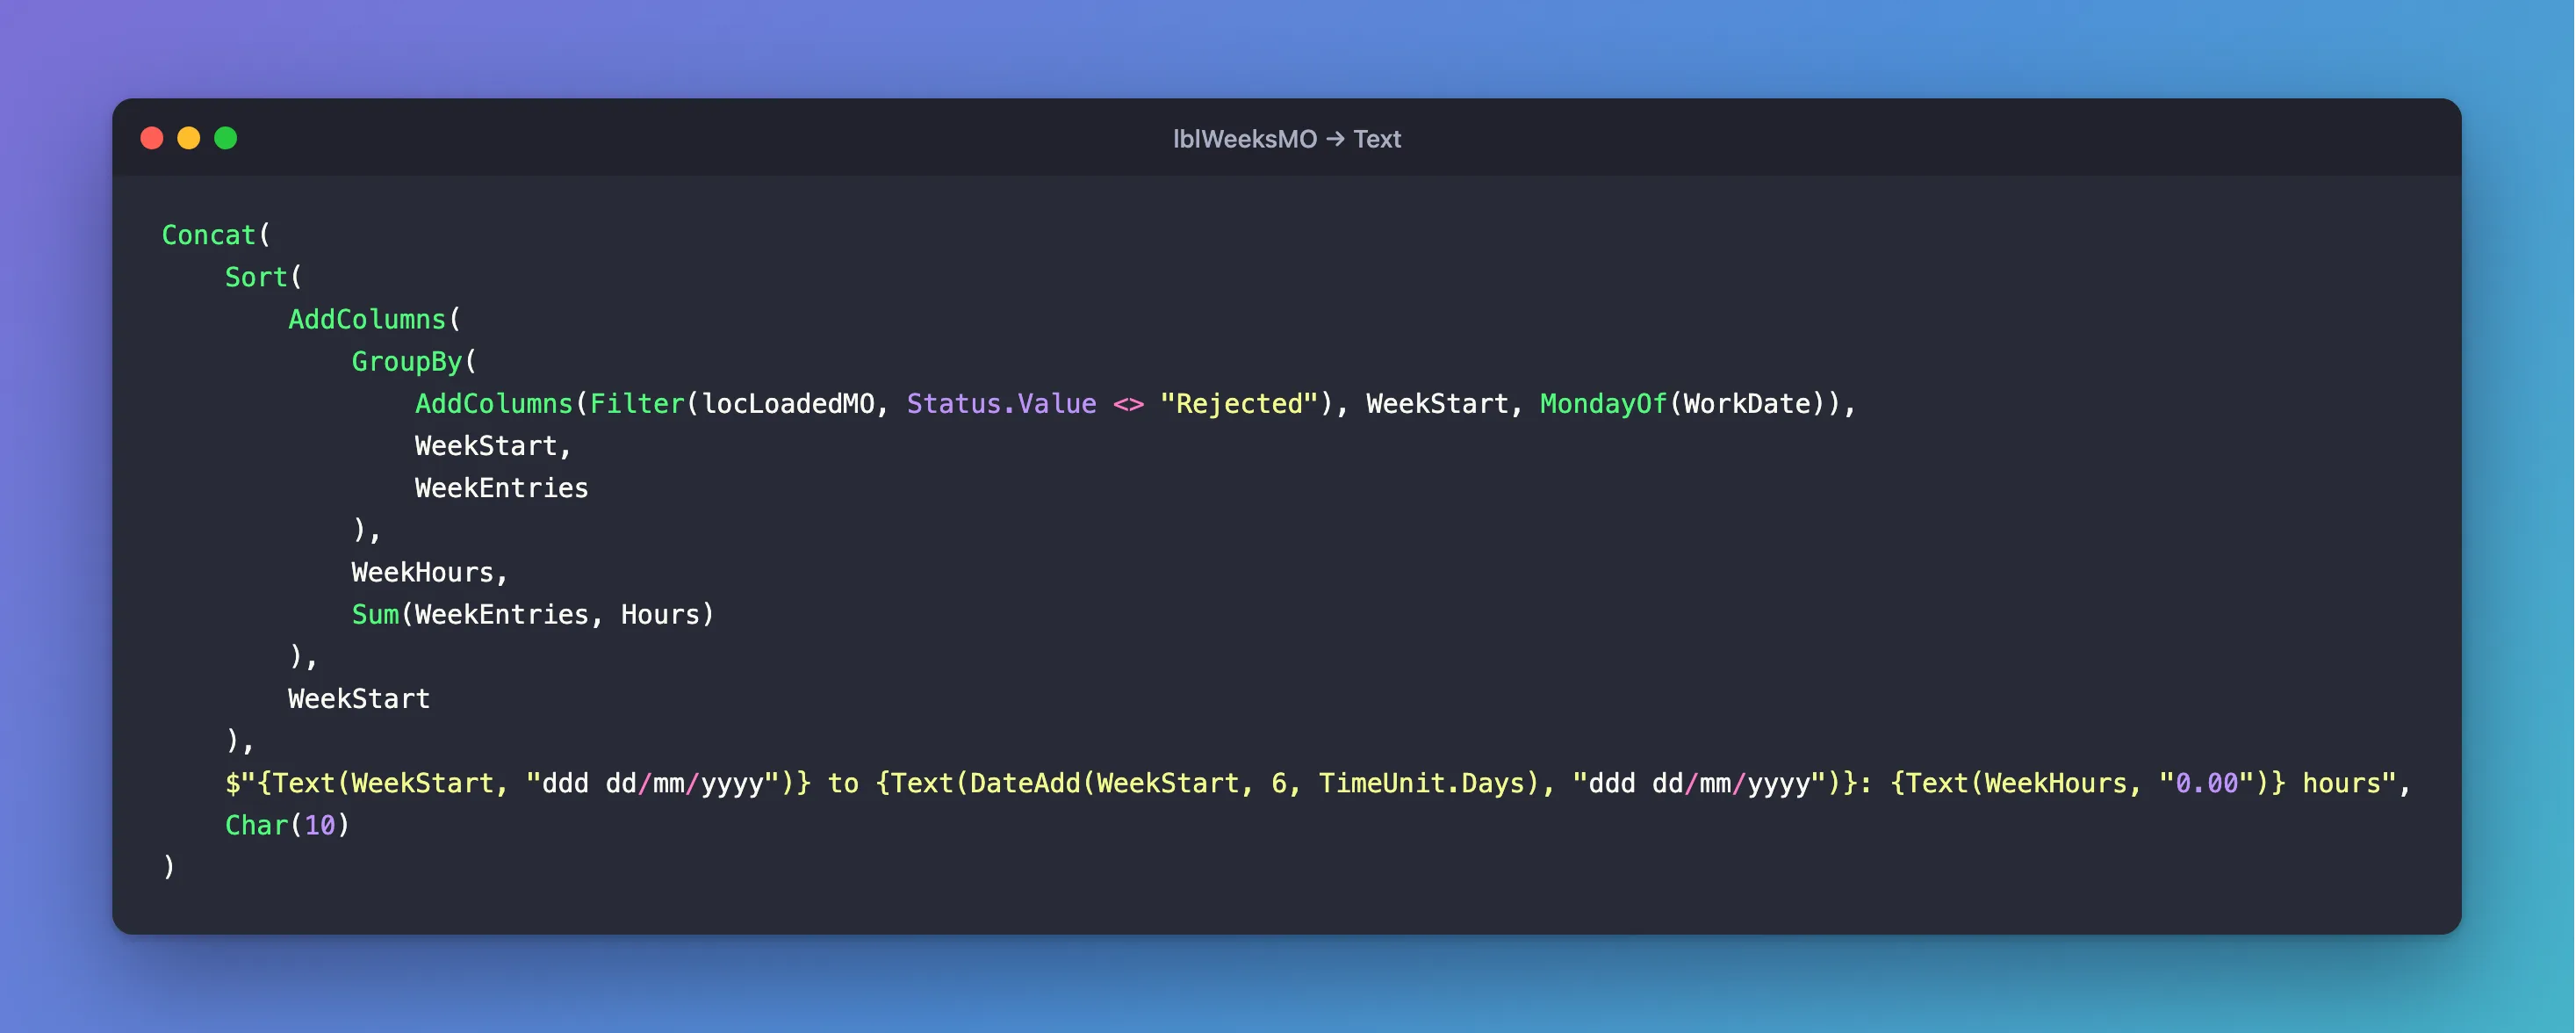
The My Overtime screen writes one line per week, in date order, and leaves rejected entries out of the totals:
Concat(
    Sort(
        AddColumns(
            GroupBy(
                AddColumns(Filter(locLoadedMO, Status.Value <> "Rejected"), WeekStart, MondayOf(WorkDate)),
                WeekStart,
                WeekEntries
            ),
            WeekHours,
            Sum(WeekEntries, Hours)
        ),
        WeekStart
    ),
    $"{Text(WeekStart, "ddd dd/mm/yyyy")} to {Text(DateAdd(WeekStart, 6, TimeUnit.Days), "ddd dd/mm/yyyy")}: {Text(WeekHours, "0.00")} hours",
    Char(10)
)
- Filter first leaves rejected entries out of every week's total.
- Sort by WeekStart puts the weeks in date order (How to Sort a Table in Power Apps with Sort).
Char(10)between the lines is a line break, so each week is on its own line.
In Preview, for November 2026:
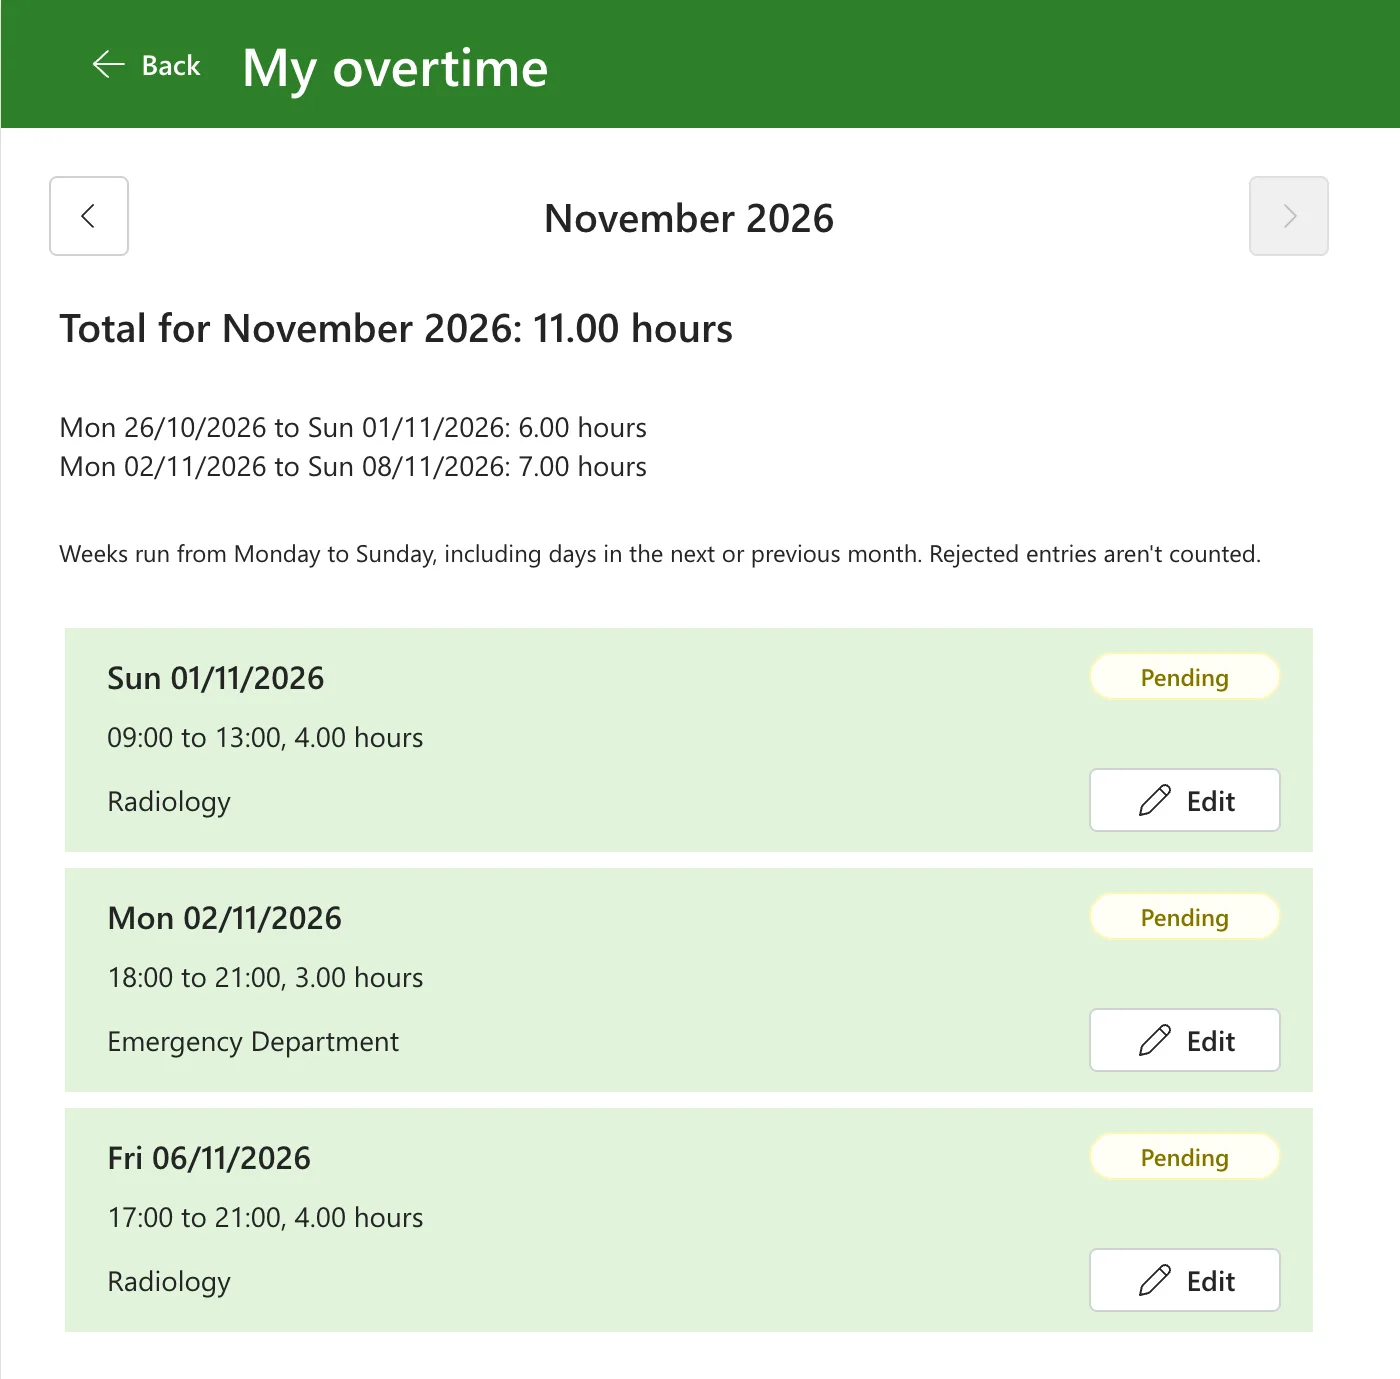
The first week starts in October: its total counts Thursday 29 October as well as Sunday 1 November, because the screen loads whole weeks.
Common Mistakes
| Mistake | What happens | Do this instead |
|---|---|---|
Sum(locLoadedMO, Hours) inside AddColumns | Every group gets the total of all records | Sum the group's own table: Sum(WeekEntries, Hours) |
| Filtering after grouping to drop some records | The groups' tables still hold them | Filter before GroupBy |
| Grouping a SharePoint list directly | Only the first 500 rows are grouped | Group a filtered copy held in a variable |
Troubleshooting
| Symptom | Likely cause | Fix |
|---|---|---|
| All the groups show the same total | Sum reads the whole table, not the group | Use the group column's name in Sum |
| The weeks are out of order | The result isn't sorted | Sort by the grouping column |
| A week is missing | It has no records, so GroupBy has no group for it | Expected: only weeks with records appear |
FAQ
Can I show the totals in a gallery instead?
Yes: use the AddColumns(GroupBy(...)) table as the gallery's Items, and show ThisItem.WeekStart and ThisItem.WeekHours in each row. The example uses one Text control because the list is short.
How does Excel do this?
SUMIFS adds up the rows that match each group: How to Total Hours by Person and Month in Excel with SUMIFS.
Conclusion
AddColumns(GroupBy(Table, Column, Group), Total, Sum(Group, Value)) totals each group. Filter before grouping, sort the result, and keep a SharePoint table in memory before grouping it.
Additional Resources
- GroupBy and Ungroup functions: the aggregate example.
- AddColumns, DropColumns, RenameColumns, and ShowColumns functions: adding calculated columns.
