How to Show Data Labels on a Power BI Chart

A chart's axis shows roughly how big each bar is; a data label shows exactly. With data labels on, every bar carries its value. Here's how to turn them on.
Microsoft's Customize X-axis and Y-axis properties gives the steps: In the Format visual pane, select Visual. Expand Data labels and set to On. The example is a clustered bar chart of Total amount by Category (How to Add a Bar Chart to a Power BI Report).
Step 1: Open the Chart's Format Settings
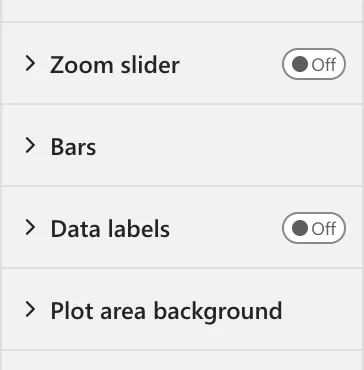
In Editing mode, select the chart. In the Visualizations pane, select Format visual, the brush icon, and its Visual tab. The settings are grouped in sections, from the axes to Plot area background. Data labels is Off:
Step 2: Turn Data Labels On
Select the toggle next to Data labels:
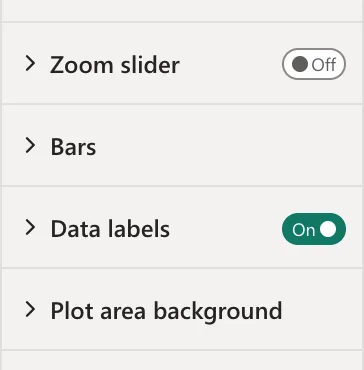
Expand Data labels to change their position, font or colour.
Step 3: Check the Chart
Each bar now ends with its value, 183.70, 75.00 and 35.00:
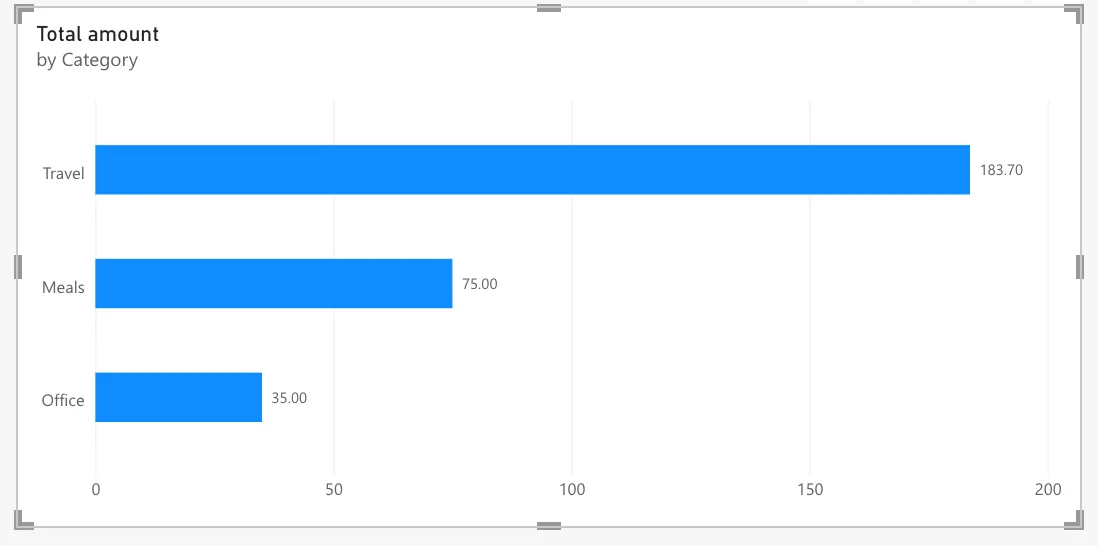
The labels show two decimals because the measure has its own format in the model (How to Show a Measure with Two Decimal Places in Power BI). With the General format, labels can round: 44.50 showed as 45 in another report (Fixed: Power BI Data Labels Show 45 Instead of 44.50).
Common Mistakes
| Mistake | What happens | Do this instead |
|---|---|---|
| Looking for Data labels on the General tab | It's on the Visual tab | Format visual > Visual |
| Leaving the measure's format General | Labels can round | Format the measure in the model |
| Data labels on a small visual | Power BI shrinks the labels' font and warns about it | Make the visual bigger (Fixed: "Data Label Font Reduced" on a Power BI Visual) |
Troubleshooting
| Symptom | Likely cause | Fix |
|---|---|---|
| No Data labels section | The selected visual is a card or table | Select a chart |
| Labels show 45 instead of 44.50 | The measure's format is General | Decimal number, 2 places |
| Data label font reduced | The visual is too small for the labels | Enlarge the visual |
FAQ
Can I hide the axis once the labels are on?
Yes: the article says data labels can be used instead of a value axis for a cleaner design, or with it.
Do labels follow slicers?
Yes: they show the values of the bars on screen.
Conclusion
Select the chart, Format visual > Visual, and switch Data labels On. The example's bars show 183.70, 75.00 and 35.00, in the measure's format.
