How to Show Column Totals in a SharePoint List View

A SharePoint view can show a total under a column: select the column's heading, then Totals and a calculation such as Sum. In a grouped view, each group gets its own total, and the list gets one at the bottom. Save the view to keep it.
The example is the OvertimeEntries list of the Overtime Timesheet app, where the total of the Hours column per month checks the totals the app shows.
Prerequisites
- A SharePoint list with a column to total. Sum needs a Number column; here it's Hours.
- Permission to create views in the list.
- For totals per group, a grouped view: How to Group Items in a SharePoint List View.
Microsoft's view article describes the setting: Totals displays summary calculations for the columns in the view, such as: count, average, maximum, minimum, and the columns that are available for totals and the settings available for each column differ depending on the type of column.
Step 1: Add a Total
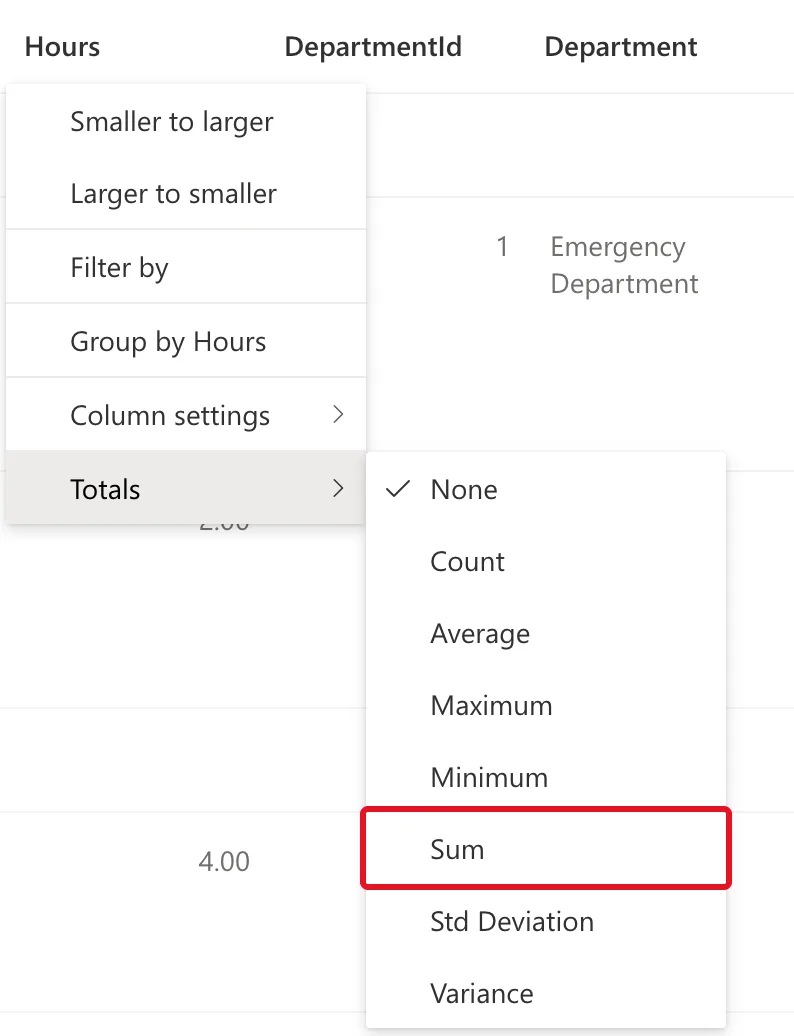
Select the heading of the column, here Hours, then Totals. For a Number column, the choices were None, Count, Average, Maximum, Minimum, Sum, Std Deviation and Variance. Select Sum:
Step 2: Read the Totals
The view was grouped by WorkMonth, so each month got a Sum under the Hours column. October's two entries add up to 10.00:
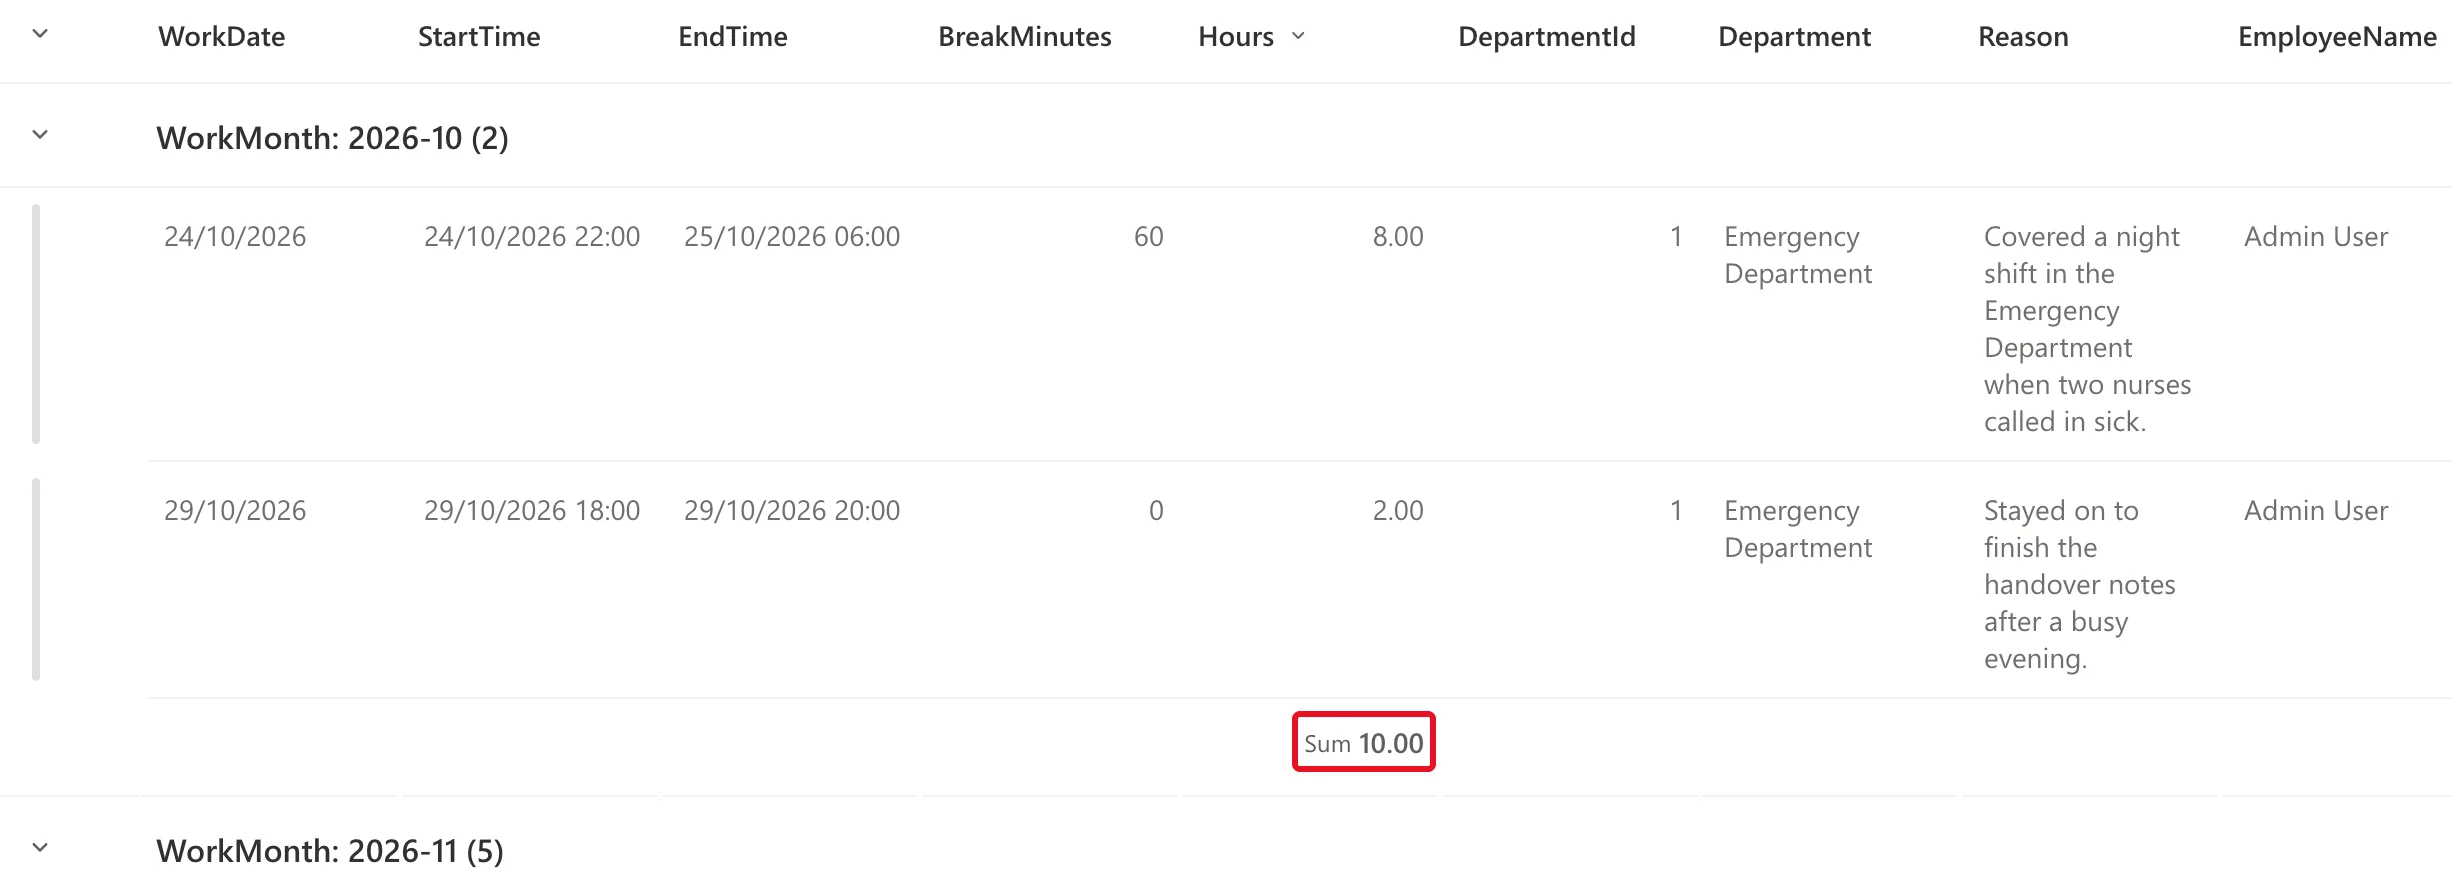
At the bottom of the list, a Sum of every item showed 28.75. The view article says the same of Count: totals show in the view and in the groups in the view.
Step 3: Save the View
Like grouping, a total changes the view you're looking at until you save it. In the example, the view was saved as a new public view, By month, with Save view as (How to Group Items in a SharePoint List View).
The Same Setting on the Classic Page
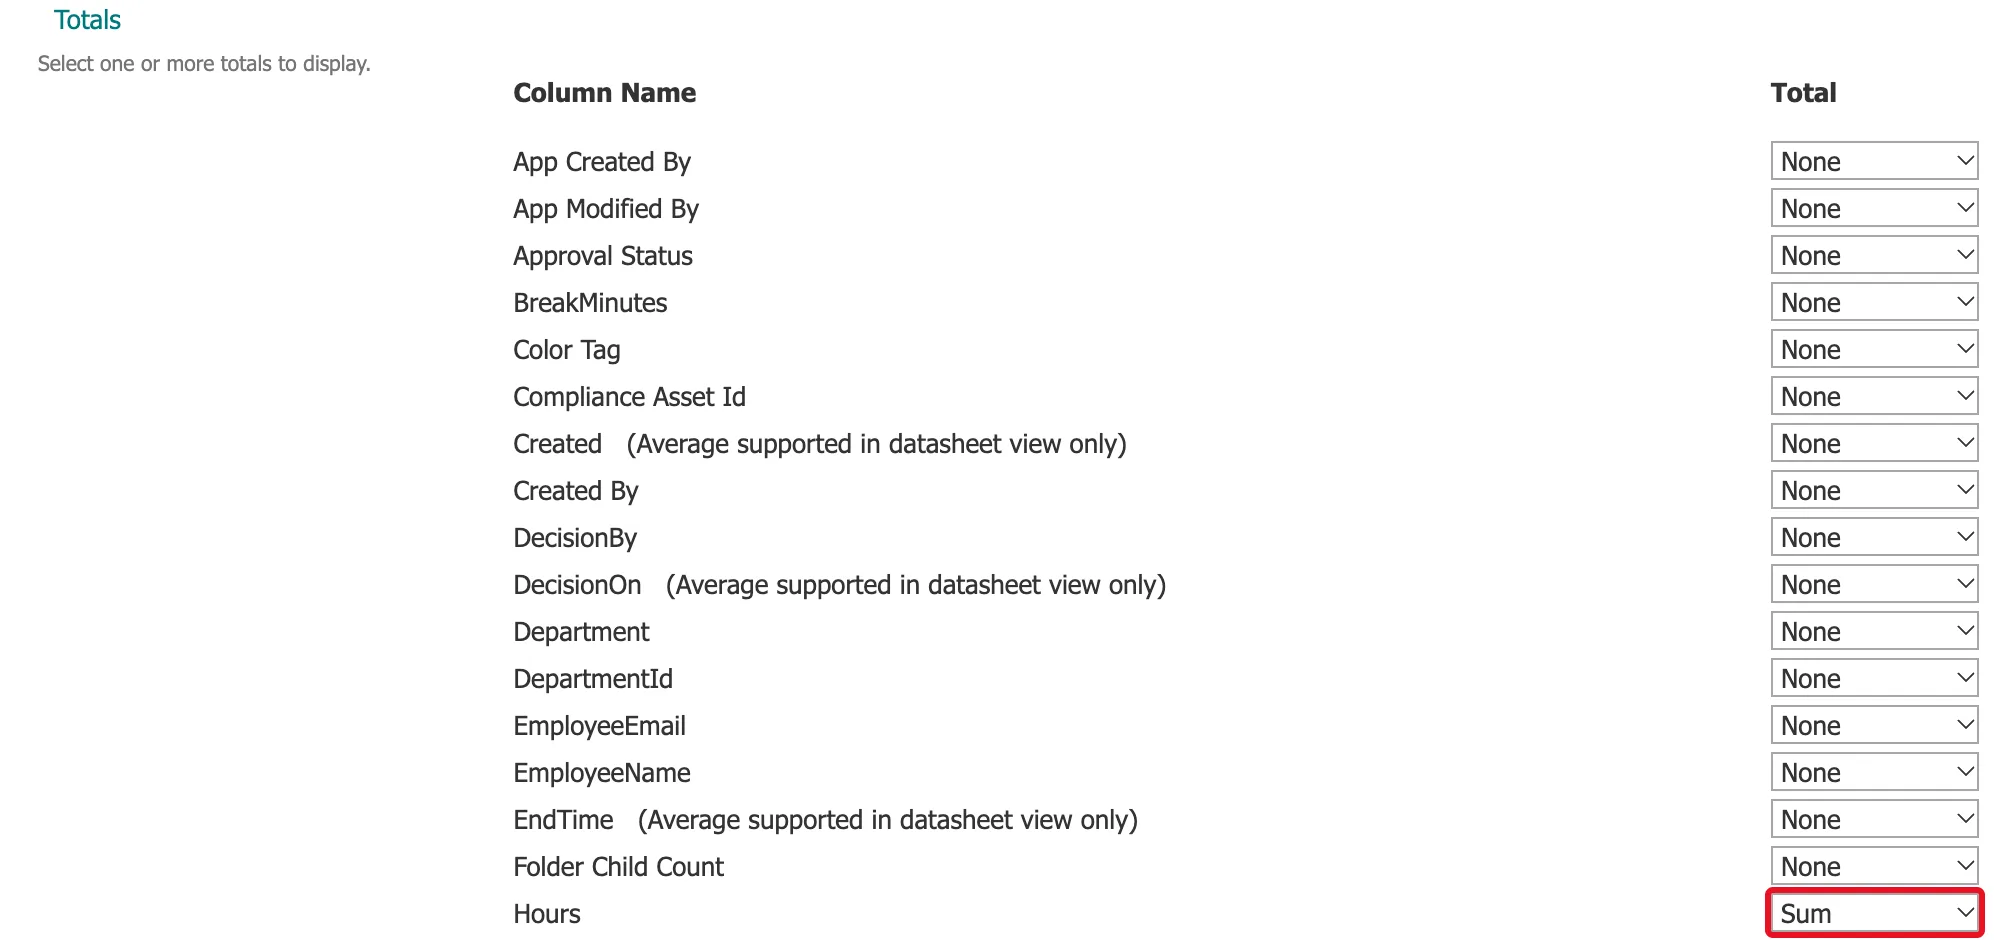
The view's menu → Edit current view opens the classic Edit View page. Its Totals section lists every column with a Total choice, and Hours showed the Sum chosen in Step 1. Some date columns note Average supported in datasheet view only:
Change a total there and select OK to save it.
How the Example Uses It
The By month view groups by month and then by person, so each person's monthly total is in the list itself. The maker's November entries added up to 11.00, the same total the app's My Overtime screen showed for that month: Build an Overtime Timesheet App in Power Apps — Part 7.
Common Mistakes
| Mistake | What happens | Do this instead |
|---|---|---|
| Looking for Sum on a text column | Text columns offer only Count, as the Edit View page lists | Total a Number column |
| Adding a total and leaving the list | The total is gone, like any unsaved change to a view | Save view as |
| Expecting the total to change the data | A total is only displayed in the view | Use a calculation in the app or a flow to store totals |
Troubleshooting
| Symptom | Likely cause | Fix |
|---|---|---|
| Only Count is offered | The column isn't a Number column | Total a Number column |
| No total under a group | The view isn't grouped, or the total wasn't saved with it | Group the view, add the total, save it |
| The total includes items you didn't expect | The view shows them | Filter the view, or group it so each group has its own total |
FAQ
Who sees the view?
Everyone who can open the list, if it's a public view, but each person sees only the items their permissions allow. In the example, staff can only see their own entries (Build an Overtime Timesheet App in Power Apps — Part 3); the totals in this post were checked as the list's owner.
Can I total more than one column?
Yes: each column has its own Totals choice.
Conclusion
Totals in a column's menu adds a calculation under the column, per group in a grouped view and for the whole list at the bottom. Save the view to keep it.
Additional Resources
- Create, change, or delete a view of a list or library: the Totals setting.
- Use grouping to modify a list or library view: grouping, which totals follow.
