How to Set the Exact Size and Position of a Visual in Power BI

Dragging visuals gets them roughly in place; typing their size and position gets them exactly in place, so edges line up and gaps are even. Here's how.
Microsoft's Optimize visual formatting, written for mobile layouts, describes the same position and size settings for when you need to control the exact size and position of the visual. The example fits a text box, Approved expenses over 10.00, to its text: 70 pixels high, at 40 from the left and 940 from the top of the page (How to Add a Text Box to a Power BI Report).
Step 1: Select the Visual and Open Its Properties
In Editing mode, select the visual. A click on the page can select the wrong visual, so selecting it in the Selection pane is the sure way (How to Open the Selection Pane in Power BI).
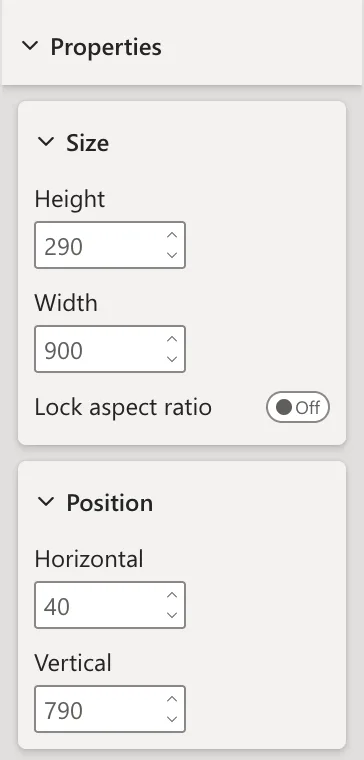
In the Visualizations pane, select Format, the brush icon, then its General tab, and expand Properties. Size and Position show the visual's current values in pixels:
Step 2: Type the New Values
Select each box, type the value and press Enter:
| Setting | Before | After |
|---|---|---|
| Height | 290 | 70 |
| Width | 900 | 900 |
| Horizontal | 40 | 40 |
| Vertical | 790 | 940 |
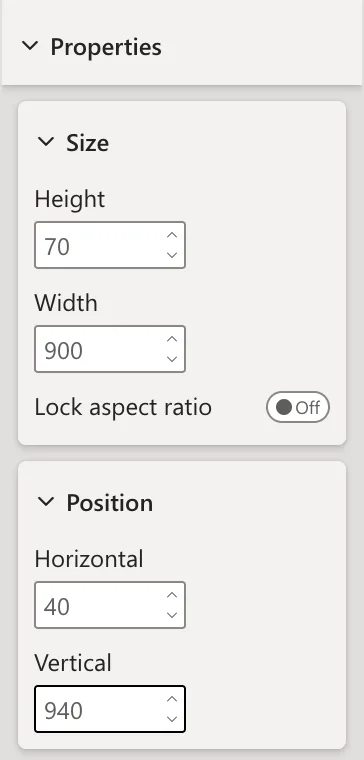
The visual moves and resizes at once. Horizontal and Vertical count from the page's top-left corner, so two visuals with the same Vertical line up along the top.
Common Mistakes
| Mistake | What happens | Do this instead |
|---|---|---|
| Dragging the visual after typing its values | It leaves the exact position | Type the values last |
| Lock aspect ratio on | Changing the height changes the width too | Turn it off for a free size |
| Positions past the page's size | The visual hangs off the page | Keep it inside the page, or make the page bigger (How to Change the Page Size of a Power BI Report) |
Troubleshooting
| Symptom | Likely cause | Fix |
|---|---|---|
| No Properties section | The Visual tab is open | Select the General tab |
| The values change another visual | The wrong visual was selected | Select it in the Selection pane |
| The text box's text is cut | The height is too small for the font | Make it taller |
FAQ
Why not just drag?
Dragging is fine for rough placement. Typed values make edges line up exactly, for example every visual in a row at the same Vertical.
What units are the values?
Pixels of the report page, the same as the page size in Canvas settings.
Conclusion
Select the visual, Format > General > Properties, and type Height, Width, Horizontal and Vertical, pressing Enter after each. The example's text box became 900 by 70 at 40, 940.
