How to See Where MLflow Stores Runs and Artifacts

An MLflow tracking server keeps your work in two places: a database for experiments, runs, parameters, metrics and tags, and a folder for the files your runs log, such as charts and models. With the default settings, both sit in the folder you started the server from. This guide finds them, follows one run from the UI to its files and database rows, and reads the database safely, with real output from MLflow 3.18.0.
The Layout
A tracking server started with the default settings keeps everything in the folder you start it from, in two places:
mlflow-server/
├── mlflow.db                  experiments, runs, parameters, metrics and tags
└── mlartifacts/               the files that runs log
    └── <experiment ID>/
        └── <run ID>/
            └── artifacts/
                └── <the path you logged>
| Place | What it is |
|---|---|
mlflow.db | The backend store: a SQLite database with a row for every experiment, run, parameter, metric and tag |
mlartifacts/ | The artifact store: an ordinary folder with a subfolder for each experiment, then one for each run |
The steps below find both, follow one run into each, and look inside the database.
Prerequisites
- A tracking server started with the default storage settings, from a folder of its own. Here the folder is
mlflow-server: see How to Start an MLflow Tracking Server on Your Computer. - A few runs that logged a file. This guide uses the four runs from Part 1 of the MLflow series, random forests that each logged a chart.
- Python 3.12 or newer, for the
sqlite3command line used in Step 4.
Step 1: Find the Two Places in the Server's Folder
Open a terminal in the server's folder, the one you ran mlflow server from, and list what's in it:
- macOS / Linux
- Windows (PowerShell)
ls -F
Get-ChildItem -Name
On macOS:
mlartifacts/ mlflow.db pyproject.toml uv.lock
mlflow.dbis the database, which MLflow's documentation calls the backend store: "SQLite is the default backend store. When you start MLflow without specifying a backend, it automatically creates and usessqlite:///mlflow.dbin the current directory."mlartifacts/holds the files, the artifact store: "By default, the tracking server stores artifacts in its local filesystem under./mlartifactsdirectory."pyproject.tomlanduv.lockbelong to uv, which installed MLflow in this folder.
Because both paths are relative to where the server starts, starting it from another folder gives you a new, empty database there.
Step 2: See the Locations in the UI
The UI doesn't show folder paths. It shows addresses that start with mlflow-artifacts:. Open an experiment and click the ⓘ icon next to Runs:
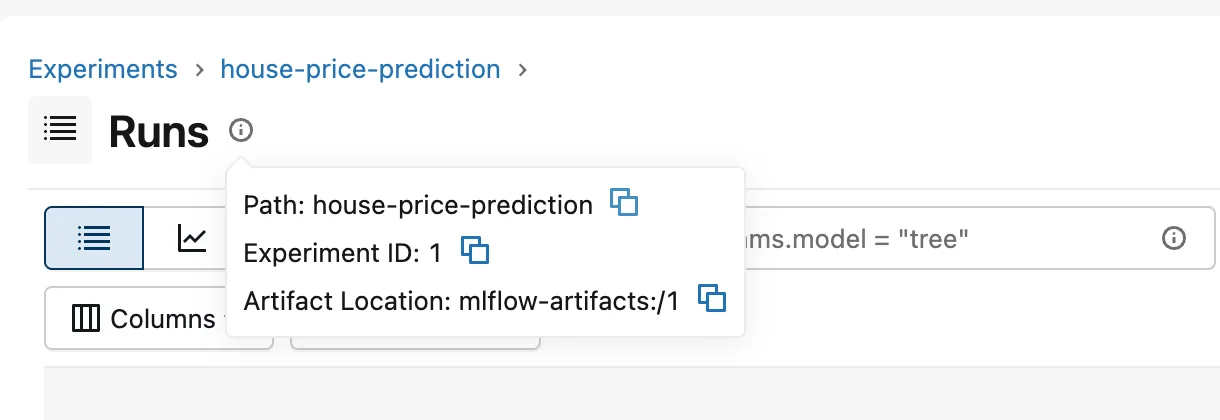
The experiment's Artifact Location is mlflow-artifacts:/1, after its ID. A run's Artifacts tab shows each file's full address. For the run smiling-moose-157:
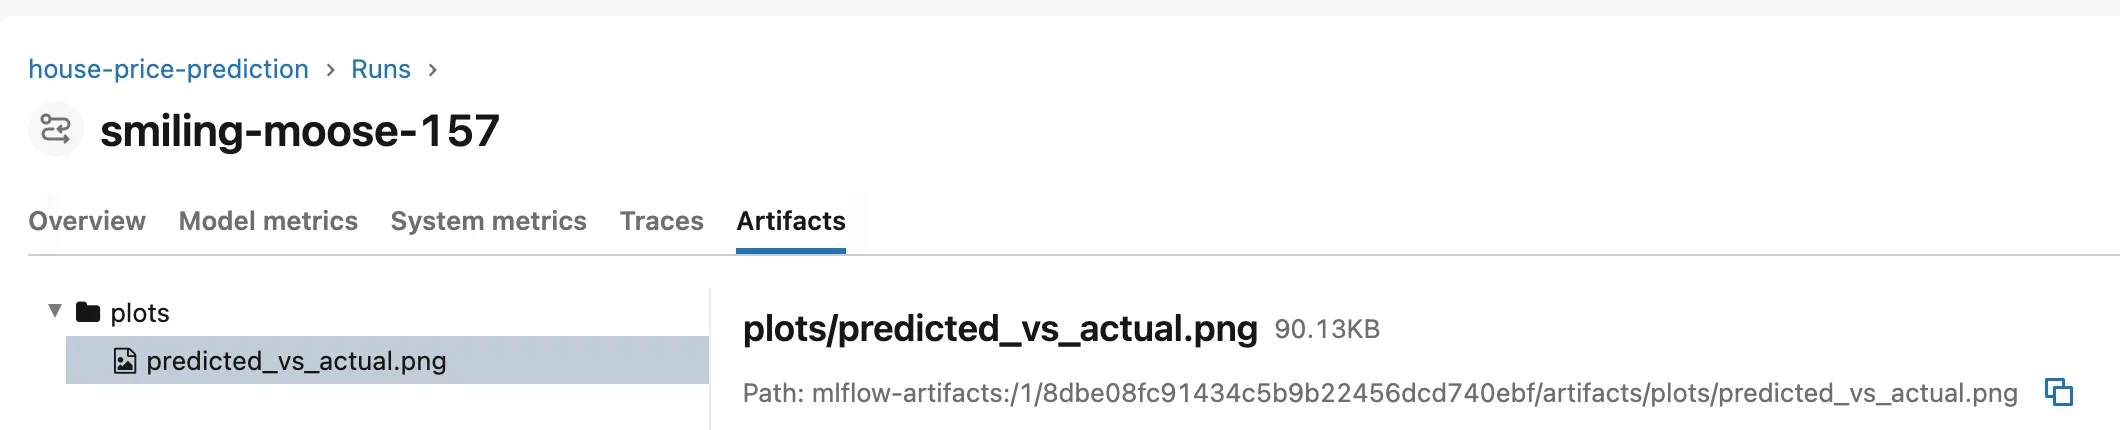
mlflow-artifacts:/ means "the server's artifact store". Your code never writes into mlartifacts itself: it sends files to the server, and the server stores them. In the documentation's words, "The tracking server resolves the uri mlflow-artifacts:/ in tracking request from the client to an otherwise explicit object store destination", here the local mlartifacts folder.
Step 3: Follow a Run to Its Files
List every file in the artifact store:
- macOS / Linux
- Windows (PowerShell)
find mlartifacts -type f
Get-ChildItem mlartifacts -Recurse -File | Resolve-Path -Relative
On macOS:
mlartifacts/1/09c7c9012ca74eafaf16c8766226d6b7/artifacts/plots/predicted_vs_actual.png
mlartifacts/1/7cb465b94f2e426f9af5a12c55326cbe/artifacts/plots/predicted_vs_actual.png
mlartifacts/1/8dbe08fc91434c5b9b22456dcd740ebf/artifacts/plots/predicted_vs_actual.png
mlartifacts/1/ec7ccb942d66407490b3aee0cb4d9b62/artifacts/plots/predicted_vs_actual.png
PowerShell prints the same paths with ./ in front on macOS; on Windows they start with .\ and use backslashes, as in Microsoft's Resolve-Path examples.
Every file follows the same pattern:
mlartifacts/<experiment ID>/<run ID>/artifacts/<the path you logged>
The third line is the file from Step 2: experiment 1, run 8dbe08fc91434c5b9b22456dcd740ebf (smiling-moose-157), and plots/predicted_vs_actual.png, the path the training code gave mlflow.log_figure(). Replace mlflow-artifacts: with mlartifacts and the UI's address becomes the file's location on disk.
Step 4: Look Inside mlflow.db
Python 3.12 added a command line to its built-in sqlite3 module: python -m sqlite3 <database> "<query>" runs one query and prints each row. It needs nothing extra to install, and the commands below are the same in every shell.
Start with the experiments:
uv run python -m sqlite3 mlflow.db "SELECT experiment_id, name, artifact_location FROM experiments;"
(0, 'Default', 'mlflow-artifacts:/0')
(1, 'house-price-prediction', 'mlflow-artifacts:/1')
Default is experiment 0, which MLflow creates when it sets up the database. Next, the runs in experiment 1:
uv run python -m sqlite3 mlflow.db "SELECT name, status, artifact_uri FROM runs WHERE experiment_id = 1;"
('smiling-moose-157', 'FINISHED', 'mlflow-artifacts:/1/8dbe08fc91434c5b9b22456dcd740ebf/artifacts')
('50-trees-depth-8', 'FINISHED', 'mlflow-artifacts:/1/ec7ccb942d66407490b3aee0cb4d9b62/artifacts')
('200-trees-depth-16', 'FINISHED', 'mlflow-artifacts:/1/09c7c9012ca74eafaf16c8766226d6b7/artifacts')
('300-trees', 'FINISHED', 'mlflow-artifacts:/1/7cb465b94f2e426f9af5a12c55326cbe/artifacts')
Each run's artifact_uri is its folder in the artifact store. Now one run's parameters, metrics and tags, here 300-trees. Use a run ID of your own, from the query above or the run page:
uv run python -m sqlite3 mlflow.db "SELECT key, value FROM params WHERE run_uuid = '7cb465b94f2e426f9af5a12c55326cbe';"
uv run python -m sqlite3 mlflow.db "SELECT key, value, step FROM metrics WHERE run_uuid = '7cb465b94f2e426f9af5a12c55326cbe';"
uv run python -m sqlite3 mlflow.db "SELECT key, value FROM tags WHERE run_uuid = '7cb465b94f2e426f9af5a12c55326cbe';"
('n_estimators', '300')
('max_depth', 'None')
('test_size', '0.2')
('random_state', '42')
('mae', 0.3267739603762923, 0)
('rmse', 0.503821166676639, 0)
('r2', 0.8062927130336361, 0)
('mlflow.user', 'you')
('mlflow.source.name', '/Users/you/source/dewiride-house-price-prediction/.venv/bin/train')
('mlflow.source.type', 'LOCAL')
('mlflow.runName', '300-trees')
('model_type', 'random_forest')
('dataset', 'california_housing')
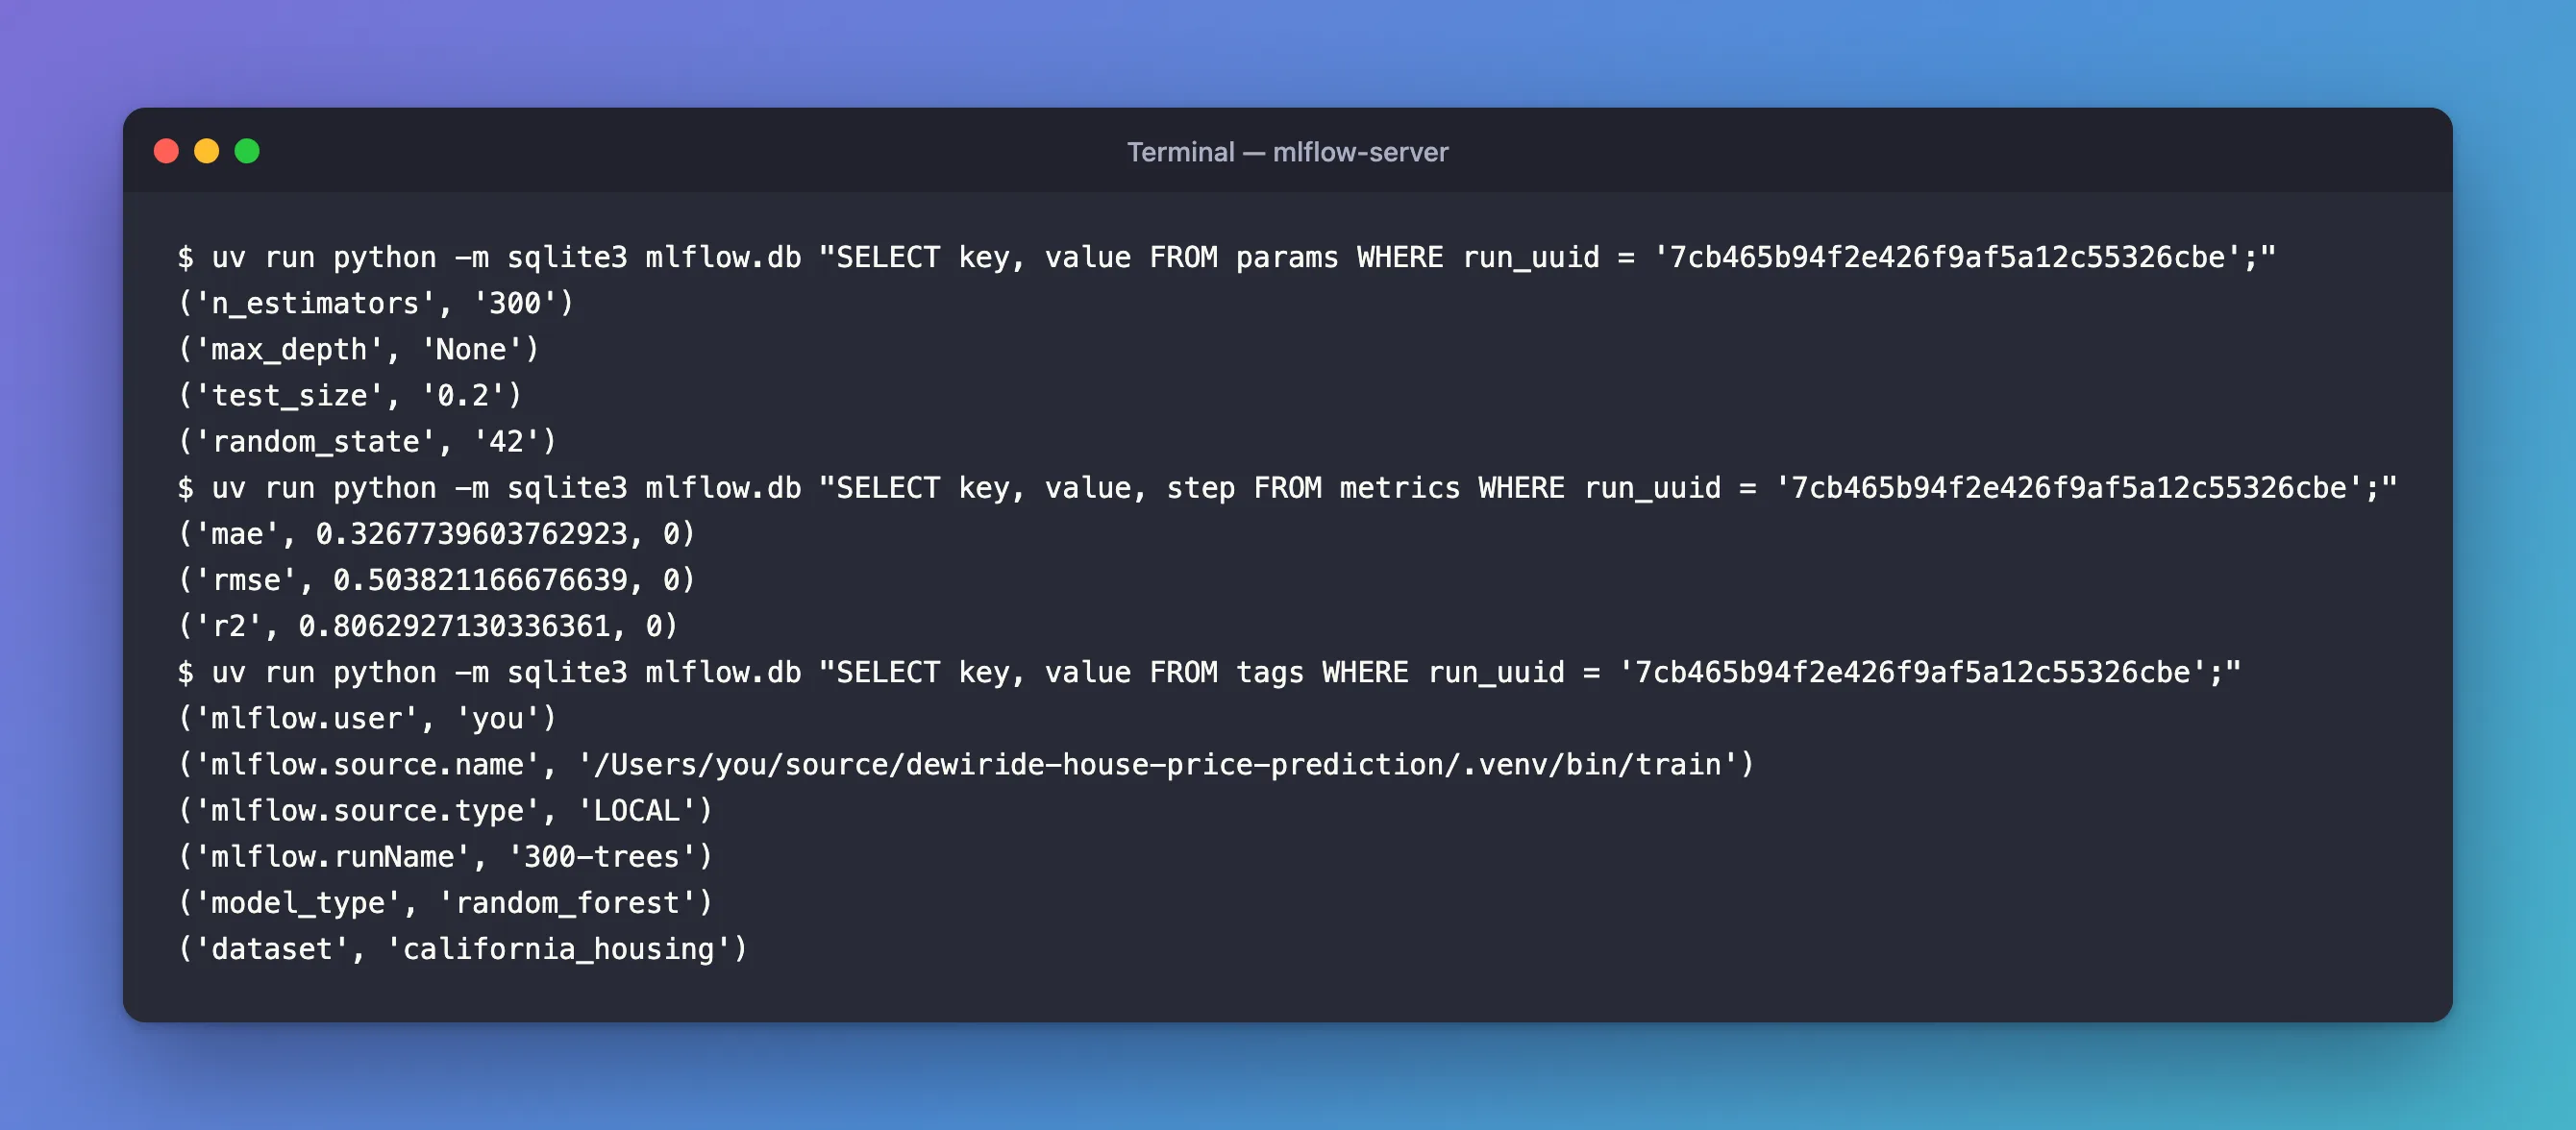
- Parameters are text:
'300', even'None'. That's why parameters compare as text in searches. - Metrics are numbers at full precision, each with a step,
0when none was given. The UI rounds them for display. - Tags include MLflow's system tags, such as
mlflow.userandmlflow.source.name, next to the run's ownmodel_typeanddataset.
The metrics table keeps every value ever logged. A second table, latest_metrics, keeps one row per run and metric name:
uv run python -m sqlite3 mlflow.db "SELECT key, value, step FROM latest_metrics WHERE run_uuid = '7cb465b94f2e426f9af5a12c55326cbe';"
('mae', 0.3267739603762923, 0)
('rmse', 0.503821166676639, 0)
('r2', 0.8062927130336361, 0)
The same three values here, because each metric was logged once. For a metric logged at many steps, such as a training loss, metrics holds a row per step, and latest_metrics keeps the one with the highest step.
What the Other Tables Hold
The database has many more tables than these:
uv run python -m sqlite3 mlflow.db "SELECT count(*) FROM sqlite_master WHERE type = 'table';"
(71,)
MLflow creates all 71 when it sets up a new database, whether you use them or not. The ones for experiment tracking:
| Table | What it holds |
|---|---|
experiments | One row per experiment: its ID, name and artifact location |
experiment_tags | Tags on experiments |
runs | One row per run: its ID, name, status, times and artifact URI |
params | Run parameters, as text |
metrics | Every logged metric value, with its step and time |
latest_metrics | The latest value of each metric, one row per run and metric name |
tags | Run tags, including MLflow's system tags |
datasets, inputs, input_tags | Datasets logged as run inputs |
logged_models and the logged_model_… tables | Models logged with MLflow 3, with their own parameters, metrics and tags |
registered_models, model_versions and their …_tags and …_aliases tables | The Model Registry |
alembic_version | The version of the database layout, which mlflow db upgrade uses |
Most of the rest serve MLflow's GenAI features, such as traces (trace_info, spans) and evaluations (assessments, scorers). List every name with SELECT name FROM sqlite_master WHERE type = 'table' ORDER BY name;.
Every query on this page only reads. Changing rows by hand can leave the database inconsistent with the files in mlartifacts, or with what MLflow expects. Change runs through MLflow: its Python API, its command line or the UI.
Common Mistakes
| Mistake | What happens | Do this instead |
|---|---|---|
| Starting the server from another folder | A new, empty mlflow.db and mlartifacts appear there, and your runs seem to vanish | Always start the server from the same folder |
| Logging with no tracking URI set | The run goes to an mlflow.db in your project's folder, not the server's | Set the tracking URI: How to Set the MLflow Tracking URI in Python |
Looking for files in mlflow.db | The database only stores the files' location | Look in mlartifacts/<experiment ID>/<run ID>/artifacts |
Editing mlflow.db by hand | The data can end up inconsistent | Change runs through MLflow |
Troubleshooting
| Symptom | Likely cause | Fix |
|---|---|---|
mlartifacts doesn't exist | No run has logged a file yet | Log one; the folder appears with the first file |
A run is in the UI but its files aren't in mlartifacts | The run was logged to another server or folder | Compare the run's artifact address with the server you started |
FAQ
Is it safe to query mlflow.db while the server is running?
For reading, yes. Every query on this page ran while the server was running. Don't write to it.
Where do runs go when I don't run a server?
With no tracking URI set, MLflow 3.18 logs to an mlflow.db in the folder you run your code from, and puts files in an mlruns folder there: How to Set the MLflow Tracking URI in Python.
What happens to mlflow.db when I upgrade MLflow?
A newer MLflow can need a newer database layout. MLflow's documentation says "mlflow server will fail against a database with an out-of-date schema", and to run mlflow db upgrade after backing the database up.
Conclusion
The tracking server kept everything in the folder it started from: mlflow.db, a SQLite database with experiments, runs, parameters, metrics and tags, and mlartifacts, with each run's files under <experiment ID>/<run ID>/artifacts. The UI's mlflow-artifacts:/1/… addresses pointed at the same files, and python -m sqlite3 read the database without changing it.
Additional Resources
- Backend Stores — the default SQLite database and other databases.
- Tracking Server — proxied artifact access and
mlflow-artifacts:/. - sqlite3 command-line interface — Python's built-in SQLite shell.
