How to See Thread Pool Starvation with dotnet-counters

When requests block threads, the .NET thread pool can't keep up, because it only adds a couple of threads a second. The app gets slow for no visible reason. dotnet-counters shows you what's happening, and here it is on a real API, right up until it crashed.
What You Need
The .NET 10 SDK, and an app running on your machine.
Step 1: Install the Tool
dotnet tool install --global dotnet-counters
dotnet-counters --version
10.0.750501+ad724c4b85e7ae775e42f393c6e95a7557a57954
Step 2: Find Your App
dotnet-counters ps
That lists running .NET processes with their ids:
 38639  Dewiride.Inventory.Api  /Users/you/projects/dewiride-inventory-api/src/Dewiride.Inventory.Api/bin/Debug/net10.0/Dewiride.Inventory.Api
 34635  VBCSCompiler            /usr/local/share/dotnet/sdk/10.0.403/Roslyn/bincore/VBCSCompiler
 13147  dotnet                  /usr/local/share/dotnet/dotnet
 38622  dotnet                  /usr/local/share/dotnet/dotnet
With dotnet run, pick the one named after your app, and not dotnet itself. Its id here is 38639.
Step 3: Watch It Live
Use your own process id in place of 38639:
dotnet-counters monitor --process-id 38639 --counters System.Runtime
It draws a live table in your terminal. Press q to stop. Watch two lines:
| Counter | What it means | In trouble, it |
|---|---|---|
dotnet.thread_pool.thread.count | Threads in the pool | Climbs slowly and steadily |
dotnet.thread_pool.queue.length | Work waiting for a thread | Stays above zero |
Step 4: Record It to a File
For something you can read afterwards, use collect. This records just those two counters, once a second:
dotnet-counters collect --process-id 38639 --format csv --refresh-interval 1 --output counters.csv --counters "System.Runtime[dotnet.thread_pool.thread.count,dotnet.thread_pool.queue.length]"
The file has a line per counter, per second:
Timestamp,Provider,Counter Name,Counter Type,Mean/Increment
11/06/2026 11:57:27,System.Runtime,dotnet.thread_pool.thread.count ({thread} / 1 sec),Rate,0
11/06/2026 11:57:27,System.Runtime,dotnet.thread_pool.queue.length ({work_item} / 1 sec),Rate,0
11/06/2026 11:57:28,System.Runtime,dotnet.thread_pool.thread.count ({thread} / 1 sec),Rate,5
11/06/2026 11:57:28,System.Runtime,dotnet.thread_pool.queue.length ({work_item} / 1 sec),Rate,4
In this format, these two are written as Rate: the change over that second. So they show how many threads were added, and not the total.
A Real Case
I ran that while sending 600 requests, 150 at a time, at a .NET API whose MySql.Data pool holds 100. The driver blocks a thread while it waits for a connection:
Time      Threads added  Change in queued work
11:57:27              0                      0
11:57:28              5                      4
11:57:29              1                     36
11:57:30              2                     -2
11:57:31              2                     -2
11:57:32              1                     -1
11:57:33              1                     -1
11:57:34              1                     -1
11:57:35              2                     18
11:57:36              1                     -1
11:57:37              1                     -1
11:57:38              2                     -2
11:57:39              2                     -2
11:57:40              2                     -2
11:57:41              2                     -2
11:57:42              2                     -2
11:57:43              2                     -2
11:57:44              2                     97
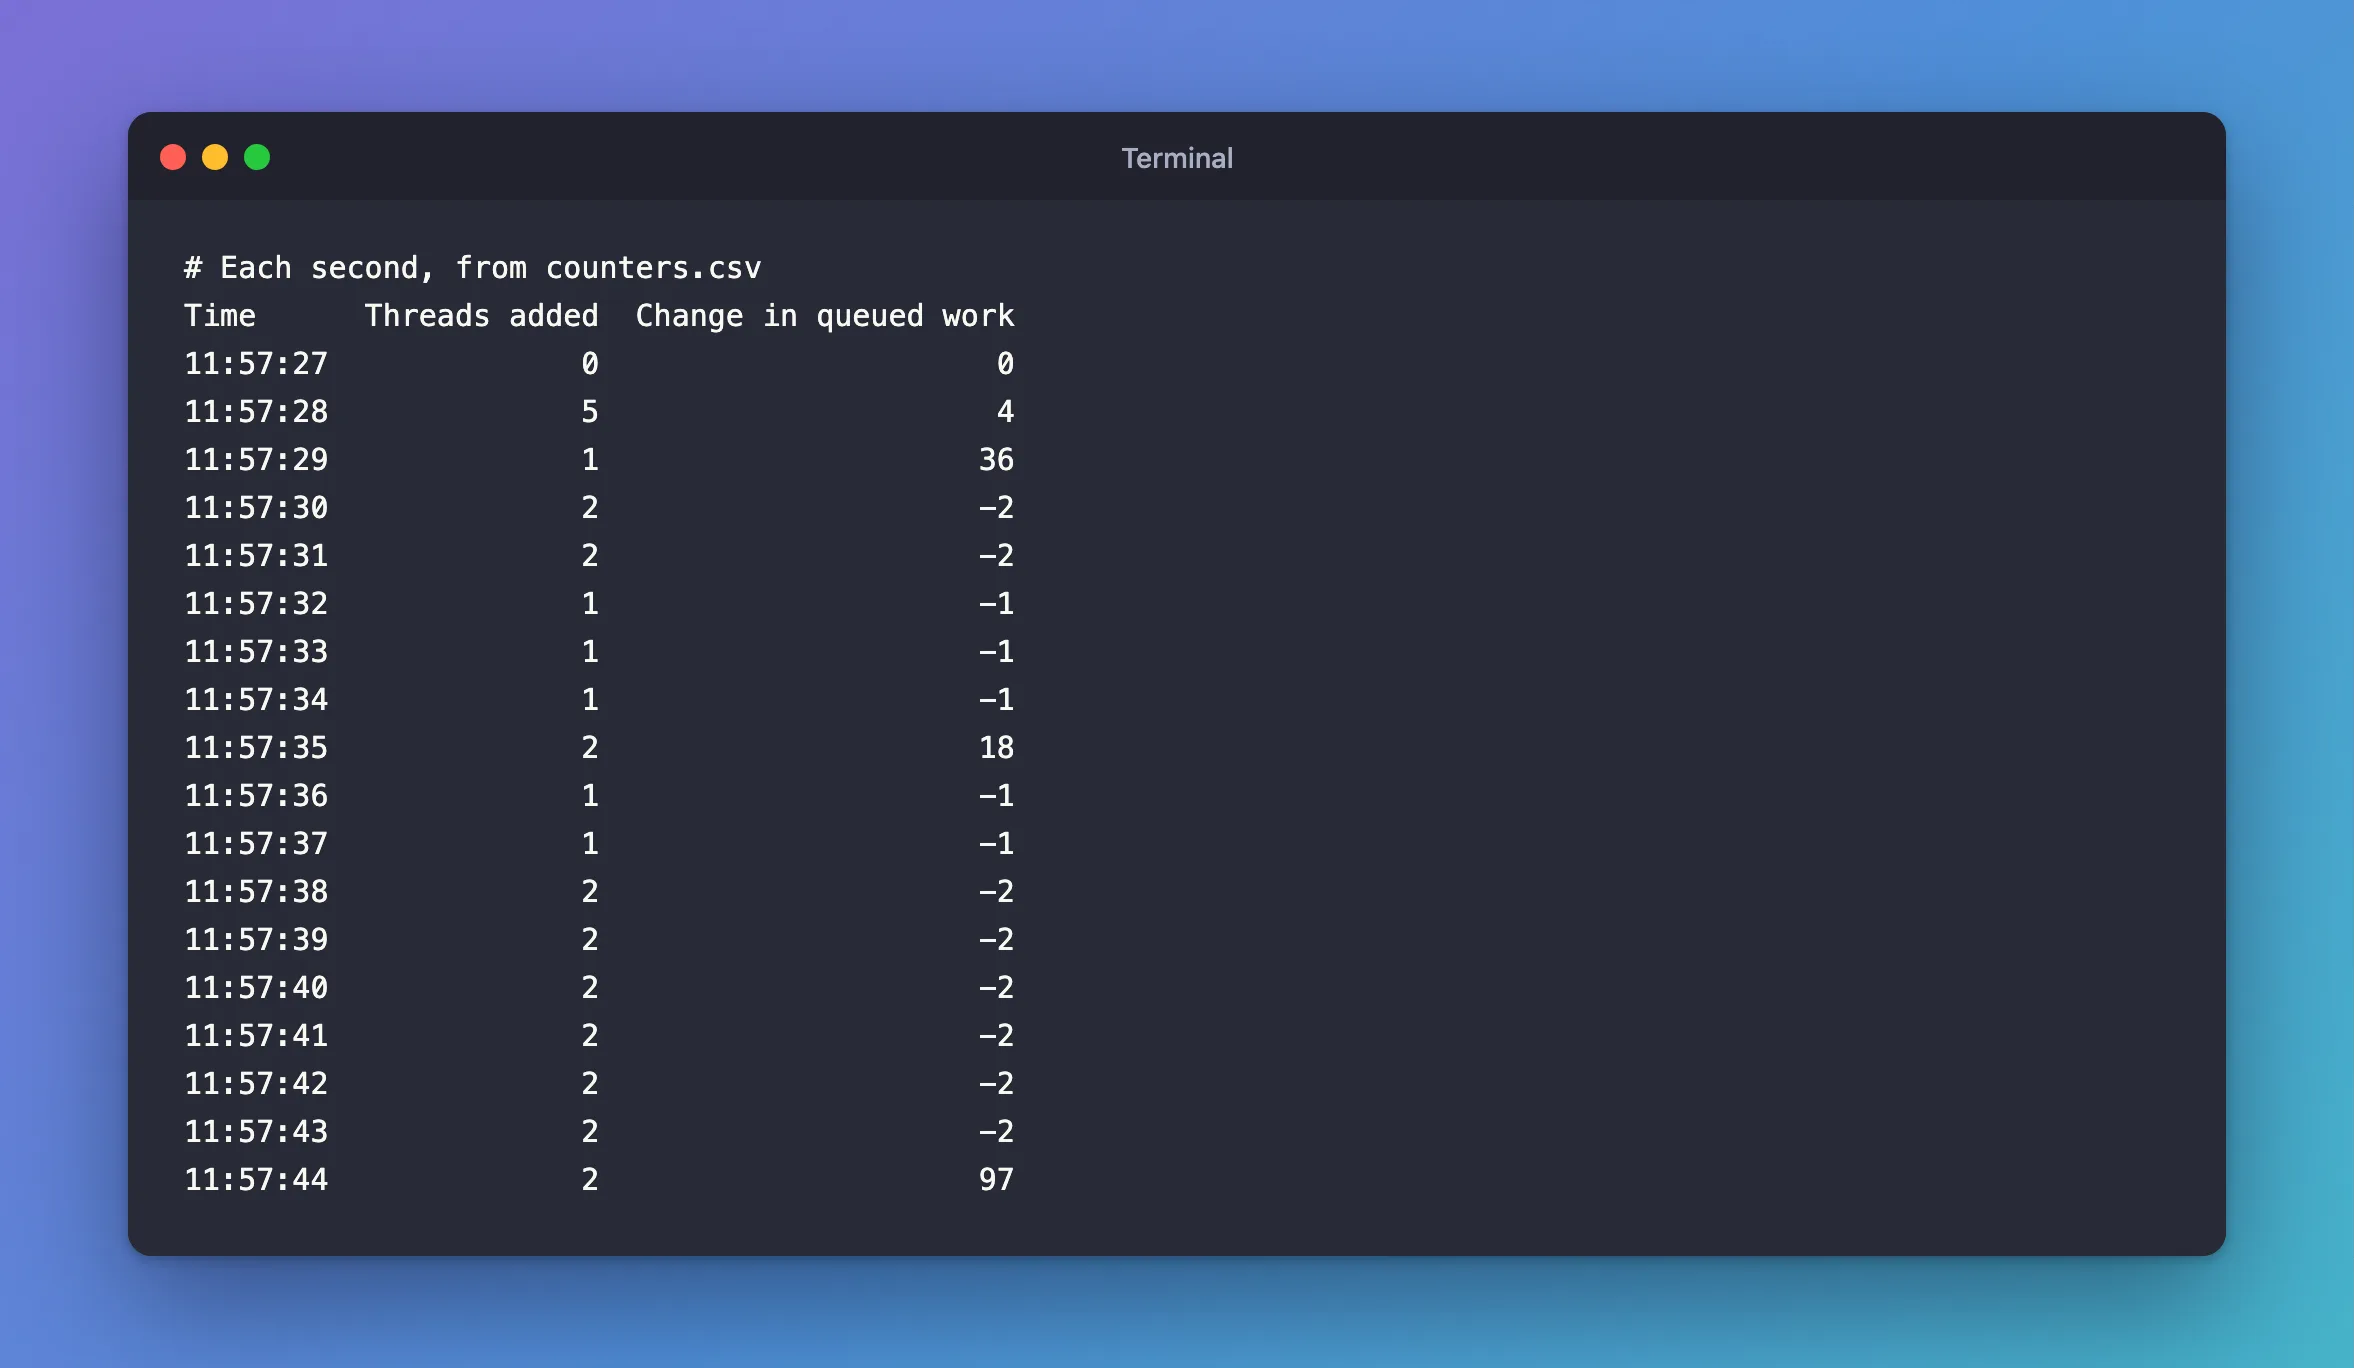
That's the signature: threads added one or two at a time, however much work is waiting. A separate count of the process's threads went from 31 to 57 in 12 seconds. After about 15 seconds, the process ended, which is why the recording stops.
Microsoft's guide to this problem goes further: dotnet-stack shows what the blocked threads are doing.
What to Do About It
Find what's blocking, and stop it. That usually means .Result or .Wait() in your code, or a library that blocks inside its async methods, as this one does. If you can't change the library, keep work away from the blocking call: a concurrency limit took this API from a crash to 41 threads, with every request answered. Raising the minimum also works, at a cost.
Common Mistakes
| Mistake | What happens | Do this instead |
|---|---|---|
Attaching to dotnet run's own process | You see nothing interesting | Pick the app's process |
| Reading the CSV's numbers as totals | They look too small | They're changes per second |
| Checking CPU only | It's low, because the threads are waiting | Check the queue |
Troubleshooting
| Symptom | Likely cause | Fix |
|---|---|---|
Process 38639 is not running. | A wrong id, or it ended | Run dotnet-counters ps again |
dotnet-counters: command not found | ~/.dotnet/tools isn't on your PATH | Add it, or restart your terminal |
| The queue is always 0, and it's still slow | Something else is the bottleneck | Look at the database and the network |
Conclusion
Slow under load, and low CPU? Look at dotnet.thread_pool.queue.length and thread.count. Work queued and threads creeping up by one or two a second means something is blocking.
Additional Resources
- dotnet-counters — every option.
- Debug ThreadPool starvation — Microsoft's walkthrough.
- Built-in metrics: System.Runtime — what each counter means.
