How to See the Last Deadlock in MySQL

A deadlock error tells you that you lost, and not to whom. MySQL keeps the full story of its latest deadlock: both transactions, what each held, what each wanted, and which one it chose to roll back. Here's how to get that report, and how to read a real one.
Prerequisites
- MySQL, with the
PROCESSprivilege. The SHOW ENGINE page says: "It requires thePROCESSprivilege." The examples use root on MySQL 9.7.4 in Docker. - A deadlock to look at. Fixed: ERROR 1213 makes one with two terminals.
Step 1: Get the Report
SHOW ENGINE INNODB STATUS\G
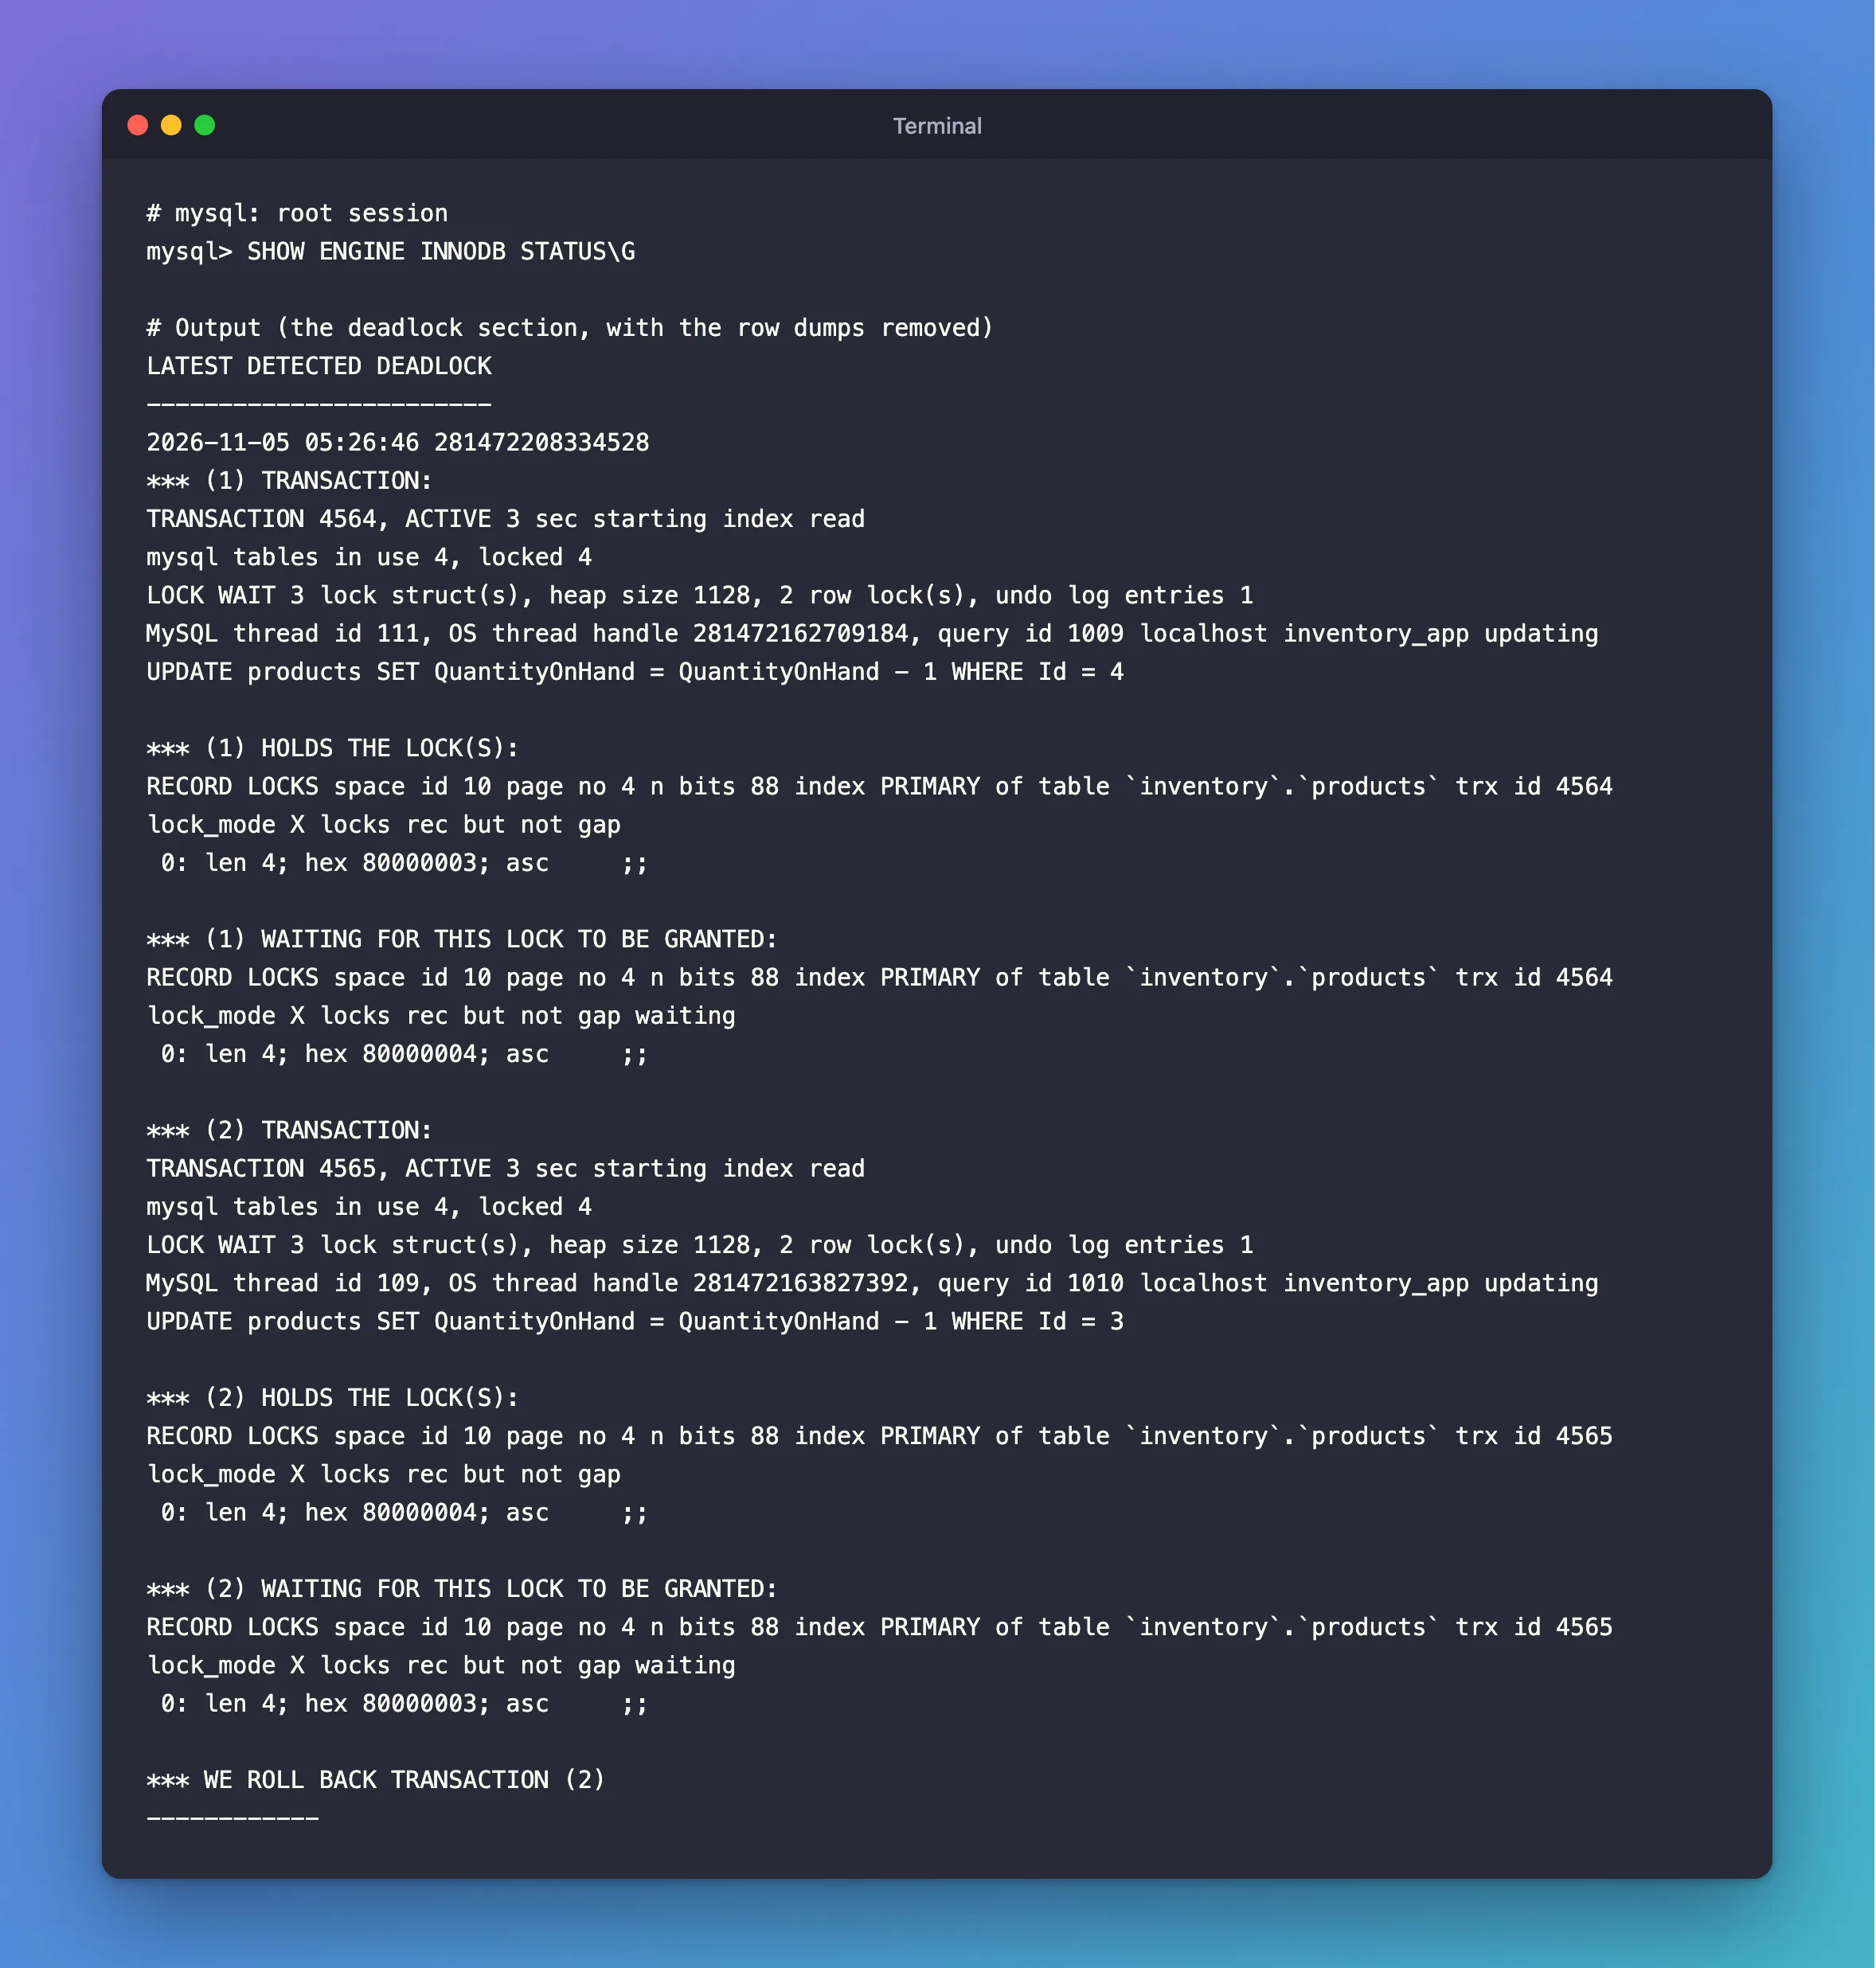
The result is long. Look for the section called LATEST DETECTED DEADLOCK. Below, I've taken out all of each row's dump except its first field, which holds the row's ID:
LATEST DETECTED DEADLOCK
------------------------
2026-11-05 05:26:46 281472208334528
*** (1) TRANSACTION:
TRANSACTION 4564, ACTIVE 3 sec starting index read
mysql tables in use 4, locked 4
LOCK WAIT 3 lock struct(s), heap size 1128, 2 row lock(s), undo log entries 1
MySQL thread id 111, OS thread handle 281472162709184, query id 1009 localhost inventory_app updating
UPDATE products SET QuantityOnHand = QuantityOnHand - 1 WHERE Id = 4

*** (1) HOLDS THE LOCK(S):
RECORD LOCKS space id 10 page no 4 n bits 88 index PRIMARY of table `inventory`.`products` trx id 4564 lock_mode X locks rec but not gap
 0: len 4; hex 80000003; asc     ;;

*** (1) WAITING FOR THIS LOCK TO BE GRANTED:
RECORD LOCKS space id 10 page no 4 n bits 88 index PRIMARY of table `inventory`.`products` trx id 4564 lock_mode X locks rec but not gap waiting
 0: len 4; hex 80000004; asc     ;;

*** (2) TRANSACTION:
TRANSACTION 4565, ACTIVE 3 sec starting index read
mysql tables in use 4, locked 4
LOCK WAIT 3 lock struct(s), heap size 1128, 2 row lock(s), undo log entries 1
MySQL thread id 109, OS thread handle 281472163827392, query id 1010 localhost inventory_app updating
UPDATE products SET QuantityOnHand = QuantityOnHand - 1 WHERE Id = 3

*** (2) HOLDS THE LOCK(S):
RECORD LOCKS space id 10 page no 4 n bits 88 index PRIMARY of table `inventory`.`products` trx id 4565 lock_mode X locks rec but not gap
 0: len 4; hex 80000004; asc     ;;

*** (2) WAITING FOR THIS LOCK TO BE GRANTED:
RECORD LOCKS space id 10 page no 4 n bits 88 index PRIMARY of table `inventory`.`products` trx id 4565 lock_mode X locks rec but not gap waiting
 0: len 4; hex 80000003; asc     ;;

*** WE ROLL BACK TRANSACTION (2)
------------
Step 2: Read It
Each transaction starts with a header. MySQL thread id and the next words say which connection and which account. Then comes the statement it was running when it got stuck.
HOLDS THE LOCK(S) is what it already had. lock_mode X locks rec but not gap is an exclusive lock on one row, and hex 80000003 ends in that row's ID, 3.
WAITING FOR THIS LOCK TO BE GRANTED is what it wanted. Read the two sections across:
| Holds | Wants | |
|---|---|---|
Transaction 1, updating Id = 4 | Row 3 | Row 4 |
Transaction 2, updating Id = 3 | Row 4 | Row 3 |
Each one wants what the other holds, and neither can go on, which is the definition on the deadlocks page: "A deadlock is a situation in which multiple transactions are unable to proceed because each transaction holds a lock that is needed by another one."
WE ROLL BACK TRANSACTION (2) names the one MySQL chose. The detection page says: "InnoDB tries to pick small transactions to roll back, where the size of a transaction is determined by the number of rows inserted, updated, or deleted."
Step 3: Turn It into a Fix
The report only shows the last statement of each transaction, not the earlier ones. So the question to ask is: which earlier statement took the lock it holds? In this case, the two transactions touched the same rows in opposite orders, and using one order everywhere removes the deadlock. To see them all, not just the latest, log every deadlock.
Common Mistakes
| Mistake | What happens | Do this instead |
|---|---|---|
| Reading only the rolled-back transaction | You see half the cycle | Read both |
| Waiting for a pile of them, then looking | Only the latest is kept | Log them all |
| Treating it as a bug to retry away | The cycle stays | Retry, and fix the order |
Troubleshooting
| Symptom | Likely cause | Fix |
|---|---|---|
No LATEST DETECTED DEADLOCK section | None has happened since the server started | Nothing to read yet |
Access denied; you need (at least one of) the PROCESS privilege(s) | The account lacks PROCESS | The fix |
Unknown command '\G' in a script | The client's commands are off outside an interactive session | The fix |
FAQ
Is the report kept across restarts?
No. It's held in memory, and each new deadlock replaces it.
Do deadlocks mean something is broken?
Not by themselves. The error handling page says: "Both deadlocks and lock wait timeouts are normal on busy servers and it is necessary for applications to be aware that they may happen and handle them by retrying."
Conclusion
SHOW ENGINE INNODB STATUS\G keeps the latest deadlock: each transaction's statement, the lock it holds, the lock it wants, and the one that was rolled back. Line the two up, and you can see the cycle, which is what you need to break it.
Additional Resources
- An InnoDB Deadlock Example — another report, explained.
- How to Minimize and Handle Deadlocks — what to change.
