How to See How Many Connections MySQL Has Now and at Its Peak

Three questions tell you if MySQL is near its connection limit: how many now, how many at the worst moment, and who has them. Each is one statement.
Step 1: How Many Now
SHOW GLOBAL STATUS LIKE 'Threads_connected';
+-------------------+-------+
| Variable_name     | Value |
+-------------------+-------+
| Threads_connected | 3     |
+-------------------+-------+
1 row in set (0.004 sec)
Your own session is one of those.
Step 2: The Peak Since MySQL Started
SHOW GLOBAL STATUS LIKE 'Max_used_connections';
SHOW GLOBAL STATUS LIKE 'Max_used_connections_time';
+----------------------+-------+
| Variable_name        | Value |
+----------------------+-------+
| Max_used_connections | 4     |
+----------------------+-------+
1 row in set (0.001 sec)

+---------------------------+---------------------+
| Variable_name             | Value               |
+---------------------------+---------------------+
| Max_used_connections_time | 2026-11-06 06:20:40 |
+---------------------------+---------------------+
1 row in set (0.002 sec)
This is the number that matters most, because a burst may have come and gone. To start counting again, FLUSH STATUS resets it to however many are connected now.
Step 3: The Limit
SHOW VARIABLES LIKE 'max_connections';
+-----------------+-------+
| Variable_name   | Value |
+-----------------+-------+
| max_connections | 151   |
+-----------------+-------+
1 row in set (0.003 sec)
If Max_used_connections is close to this, you've come close to ERROR 1040. How to Change max_connections in MySQL and Keep It After a Restart raises it, if the server has the memory.
Step 4: Who Has Them
As an administrator:
SELECT PROCESSLIST_USER AS user, PROCESSLIST_HOST AS host, COUNT(*) AS connections
FROM performance_schema.threads
WHERE PROCESSLIST_USER IS NOT NULL
GROUP BY PROCESSLIST_USER, PROCESSLIST_HOST
ORDER BY connections DESC;
+-----------------+-----------+-------------+
| user            | host      | connections |
+-----------------+-----------+-------------+
| inventory_app   | localhost |           2 |
| event_scheduler | localhost |           1 |
| root            | localhost |           1 |
+-----------------+-----------+-------------+
3 rows in set (0.003 sec)
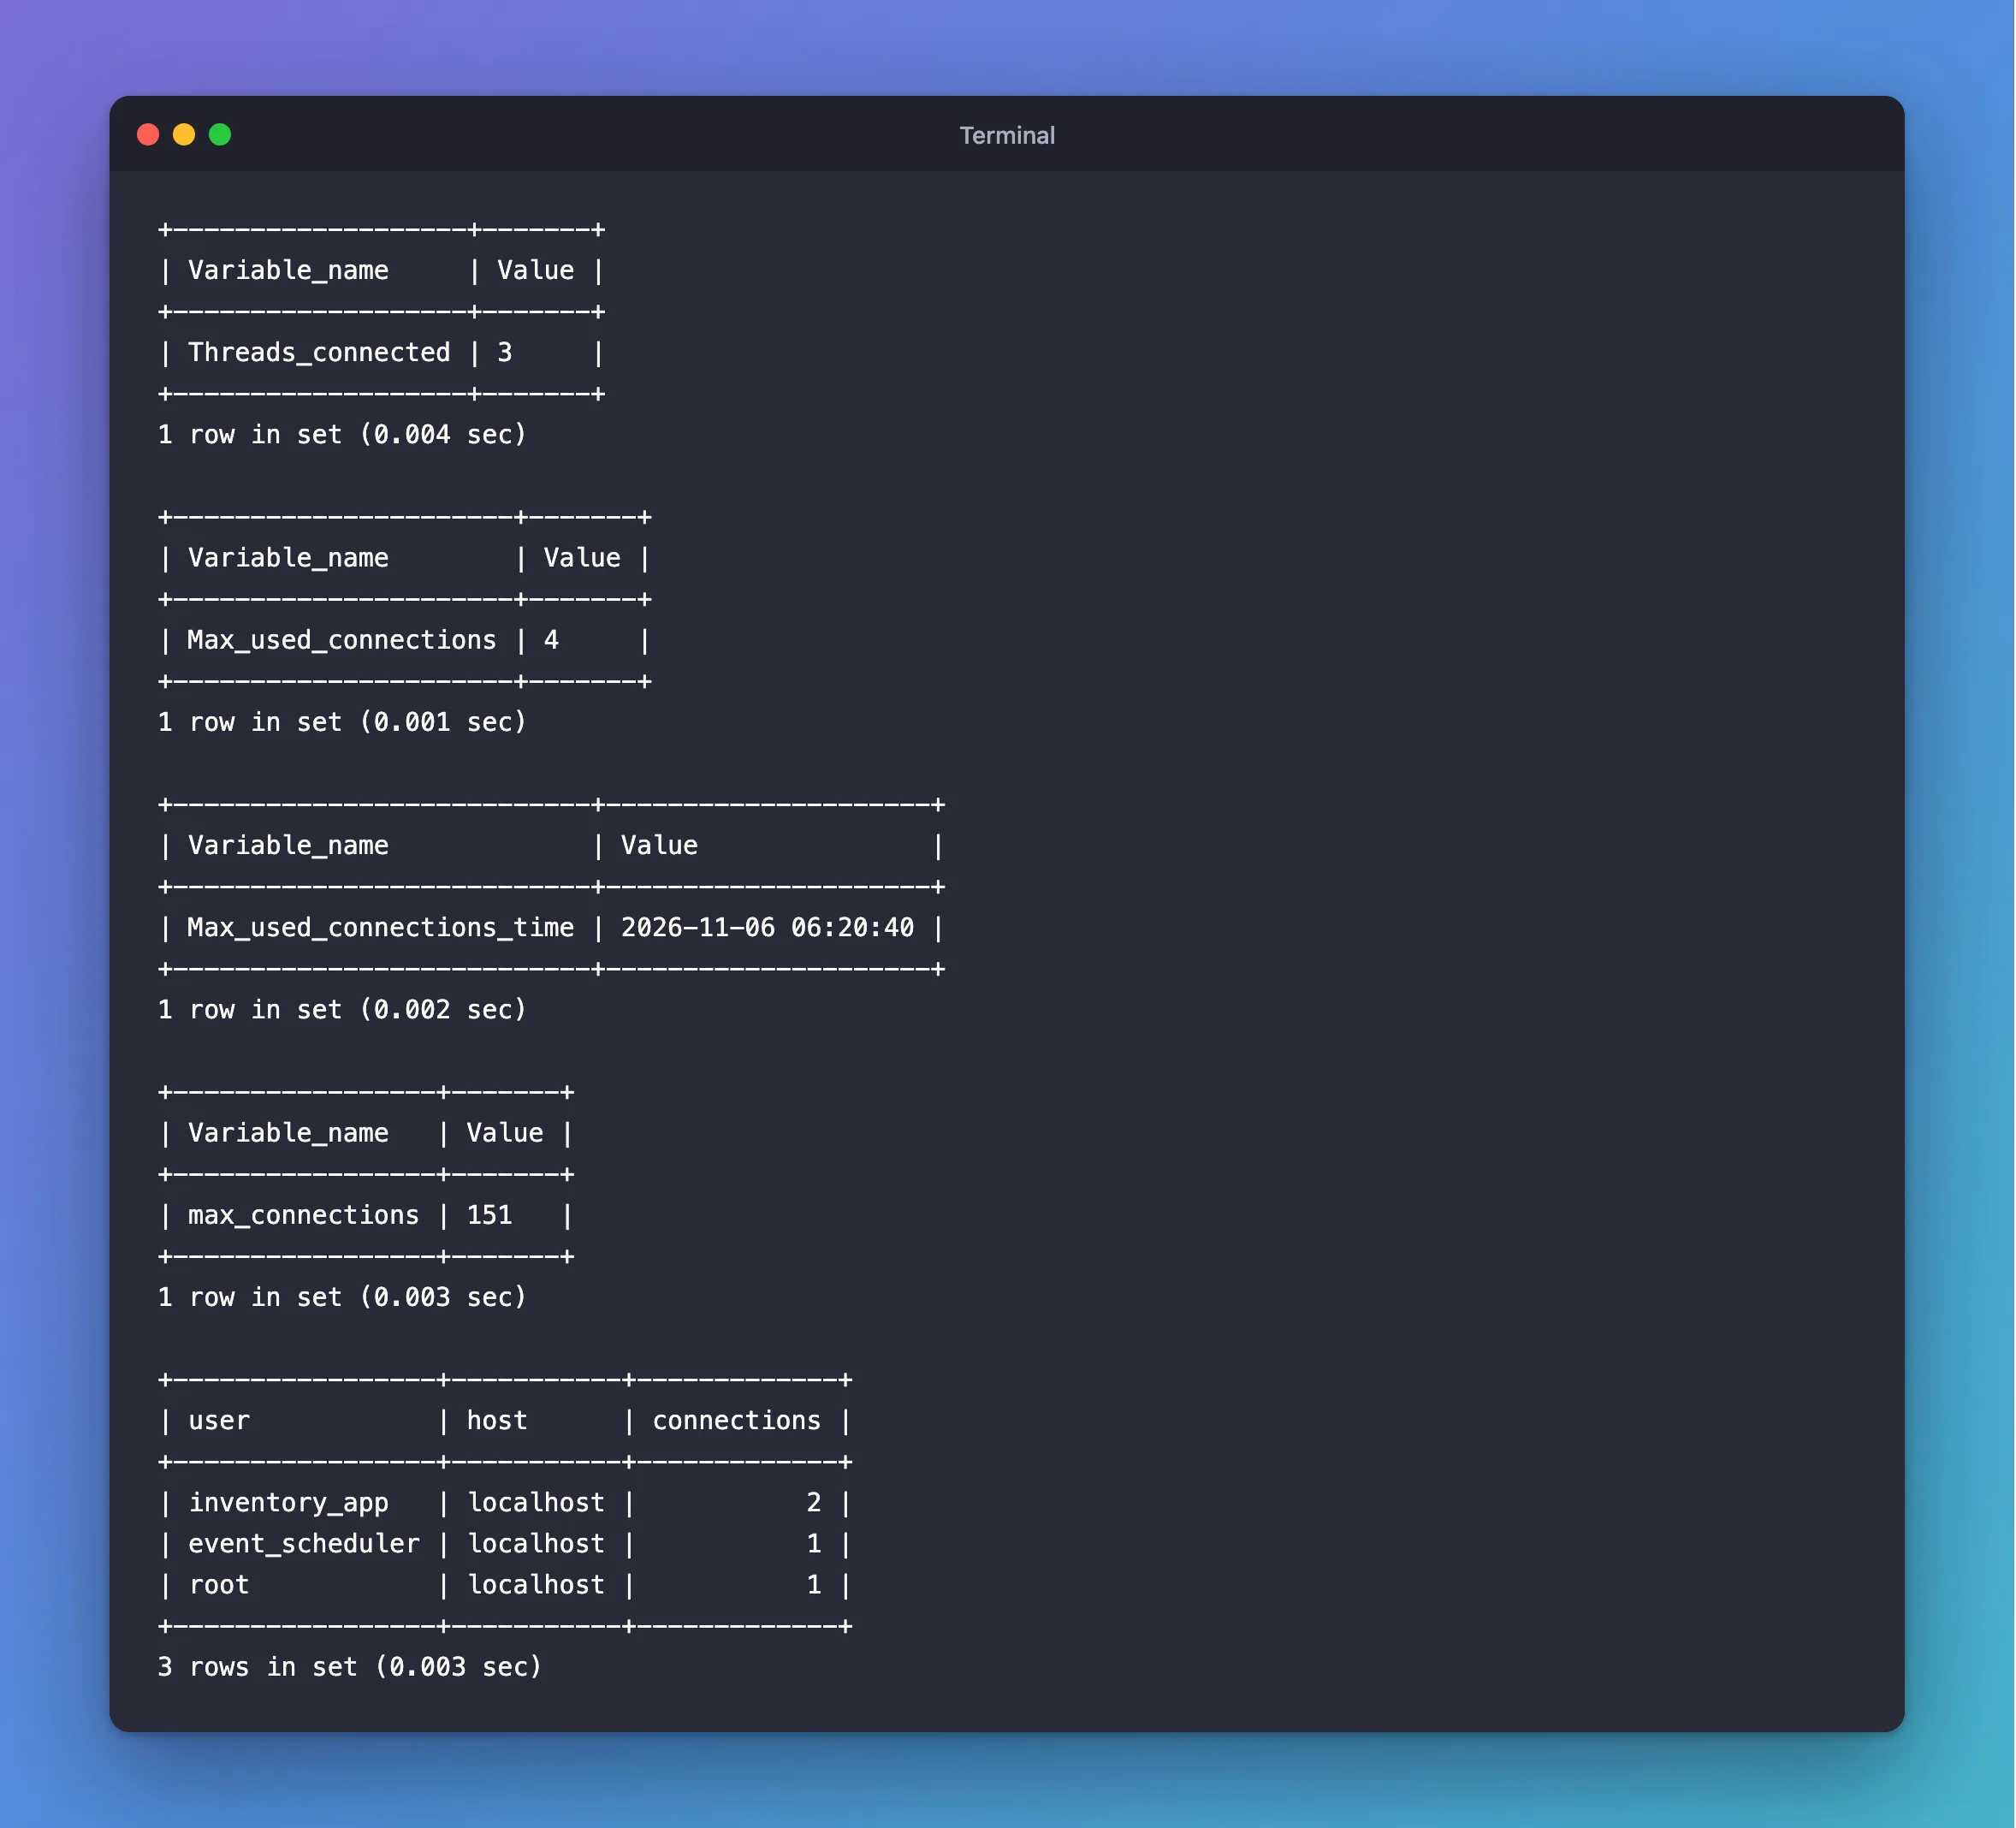
event_scheduler is one of MySQL's own background threads, and doesn't count against the limit.
Reading It with a Connection Pool
A pool keeps connections open between requests, so a high number isn't a sign of trouble by itself. Here's a .NET API after 50 requests at once, with MySQL's count from the root session:
+-------------------+-------+
| Variable_name     | Value |
+-------------------+-------+
| Threads_connected | 51    |
+-------------------+-------+
+----------------------+-------+
| Variable_name        | Value |
+----------------------+-------+
| Max_used_connections | 51    |
+----------------------+-------+
Fifty connections, all idle. They leave the pool about three minutes later, as How Long Does MySql.Data Keep Idle Connections in the Pool? measures. To see what they're doing, PROCESSLIST_COMMAND in that same table says Sleep or Query.
Common Mistakes
| Mistake | What happens | Do this instead |
|---|---|---|
Checking Threads_connected only | You miss the burst at 3 a.m. | Check Max_used_connections too |
Using SHOW PROCESSLIST | MySQL 9.7 warns that it's deprecated | Use performance_schema |
Reading Threads_running as connections | That's only the busy ones | Use Threads_connected |
Troubleshooting
| Symptom | Likely cause | Fix |
|---|---|---|
Lots of Sleep connections from one host | A pool doing its job, or a large one | Size it |
ERROR 1142 on performance_schema.threads | Your account can't read it | Use an administrator |
Max_used_connections is one above max_connections | An administrator used the spare connection | That's expected |
Conclusion
Threads_connected for now, Max_used_connections for the peak, max_connections for the limit, and performance_schema.threads for who has them.
Additional Resources
- Server Status Variables — each counter.
- The threads Table — its columns.
