How to See Every Statement MySQL Receives with the General Query Log

Your application's logs say what it meant to send. MySQL's general query log says what arrived, including what the driver adds by itself, such as BEGIN, SET and savepoints. It's the tool I reach for when something about a transaction makes no sense. Use it for a moment, and turn it off again.
Prerequisites
- MySQL, and an administrator account. The examples use root on MySQL 9.7.4 in Docker. These settings affect the whole server, so do this on a development server. The log can hold sensitive values, and it grows quickly.
Step 1: Check the Settings
SELECT @@general_log, @@general_log_file, @@log_output;
+---------------+---------------------------------+--------------+
| @@general_log | @@general_log_file              | @@log_output |
+---------------+---------------------------------+--------------+
|             0 | /var/lib/mysql/aca0a83423c6.log | FILE         |
+---------------+---------------------------------+--------------+
1 row in set (0.000 sec)
It's off, and it would write to a file. MySQL's query log page describes it as "a general record of what mysqld is doing."
Step 2: Send It to a Table
A table is easier to read and filter than a file inside a container:
SET GLOBAL log_output = 'TABLE';
TRUNCATE TABLE mysql.general_log;
SET GLOBAL general_log = ON;
Step 3: Do Something, Then Read It
Run anything from another session, or from your application:
START TRANSACTION;
UPDATE products SET ReorderLevel = 5 WHERE Id = 3;
COMMIT;
Turn it off first, and then look, so your own SELECT doesn't join the list:
SET GLOBAL general_log = OFF;

SELECT TIME(event_time) AS time, thread_id, command_type,
       CONVERT(argument USING utf8mb4) AS statement
FROM mysql.general_log
WHERE user_host LIKE 'inventory_app%'
ORDER BY event_time;
+-----------------+-----------+--------------+---------------------------------------------------+
| time            | thread_id | command_type | statement                                         |
+-----------------+-----------+--------------+---------------------------------------------------+
| 05:27:35.258504 |       148 | Query        | START TRANSACTION                                 |
| 05:27:35.281217 |       148 | Query        | UPDATE products SET ReorderLevel = 5 WHERE Id = 3 |
| 05:27:35.305636 |       148 | Query        | COMMIT                                            |
+-----------------+-----------+--------------+---------------------------------------------------+
3 rows in set (0.001 sec)
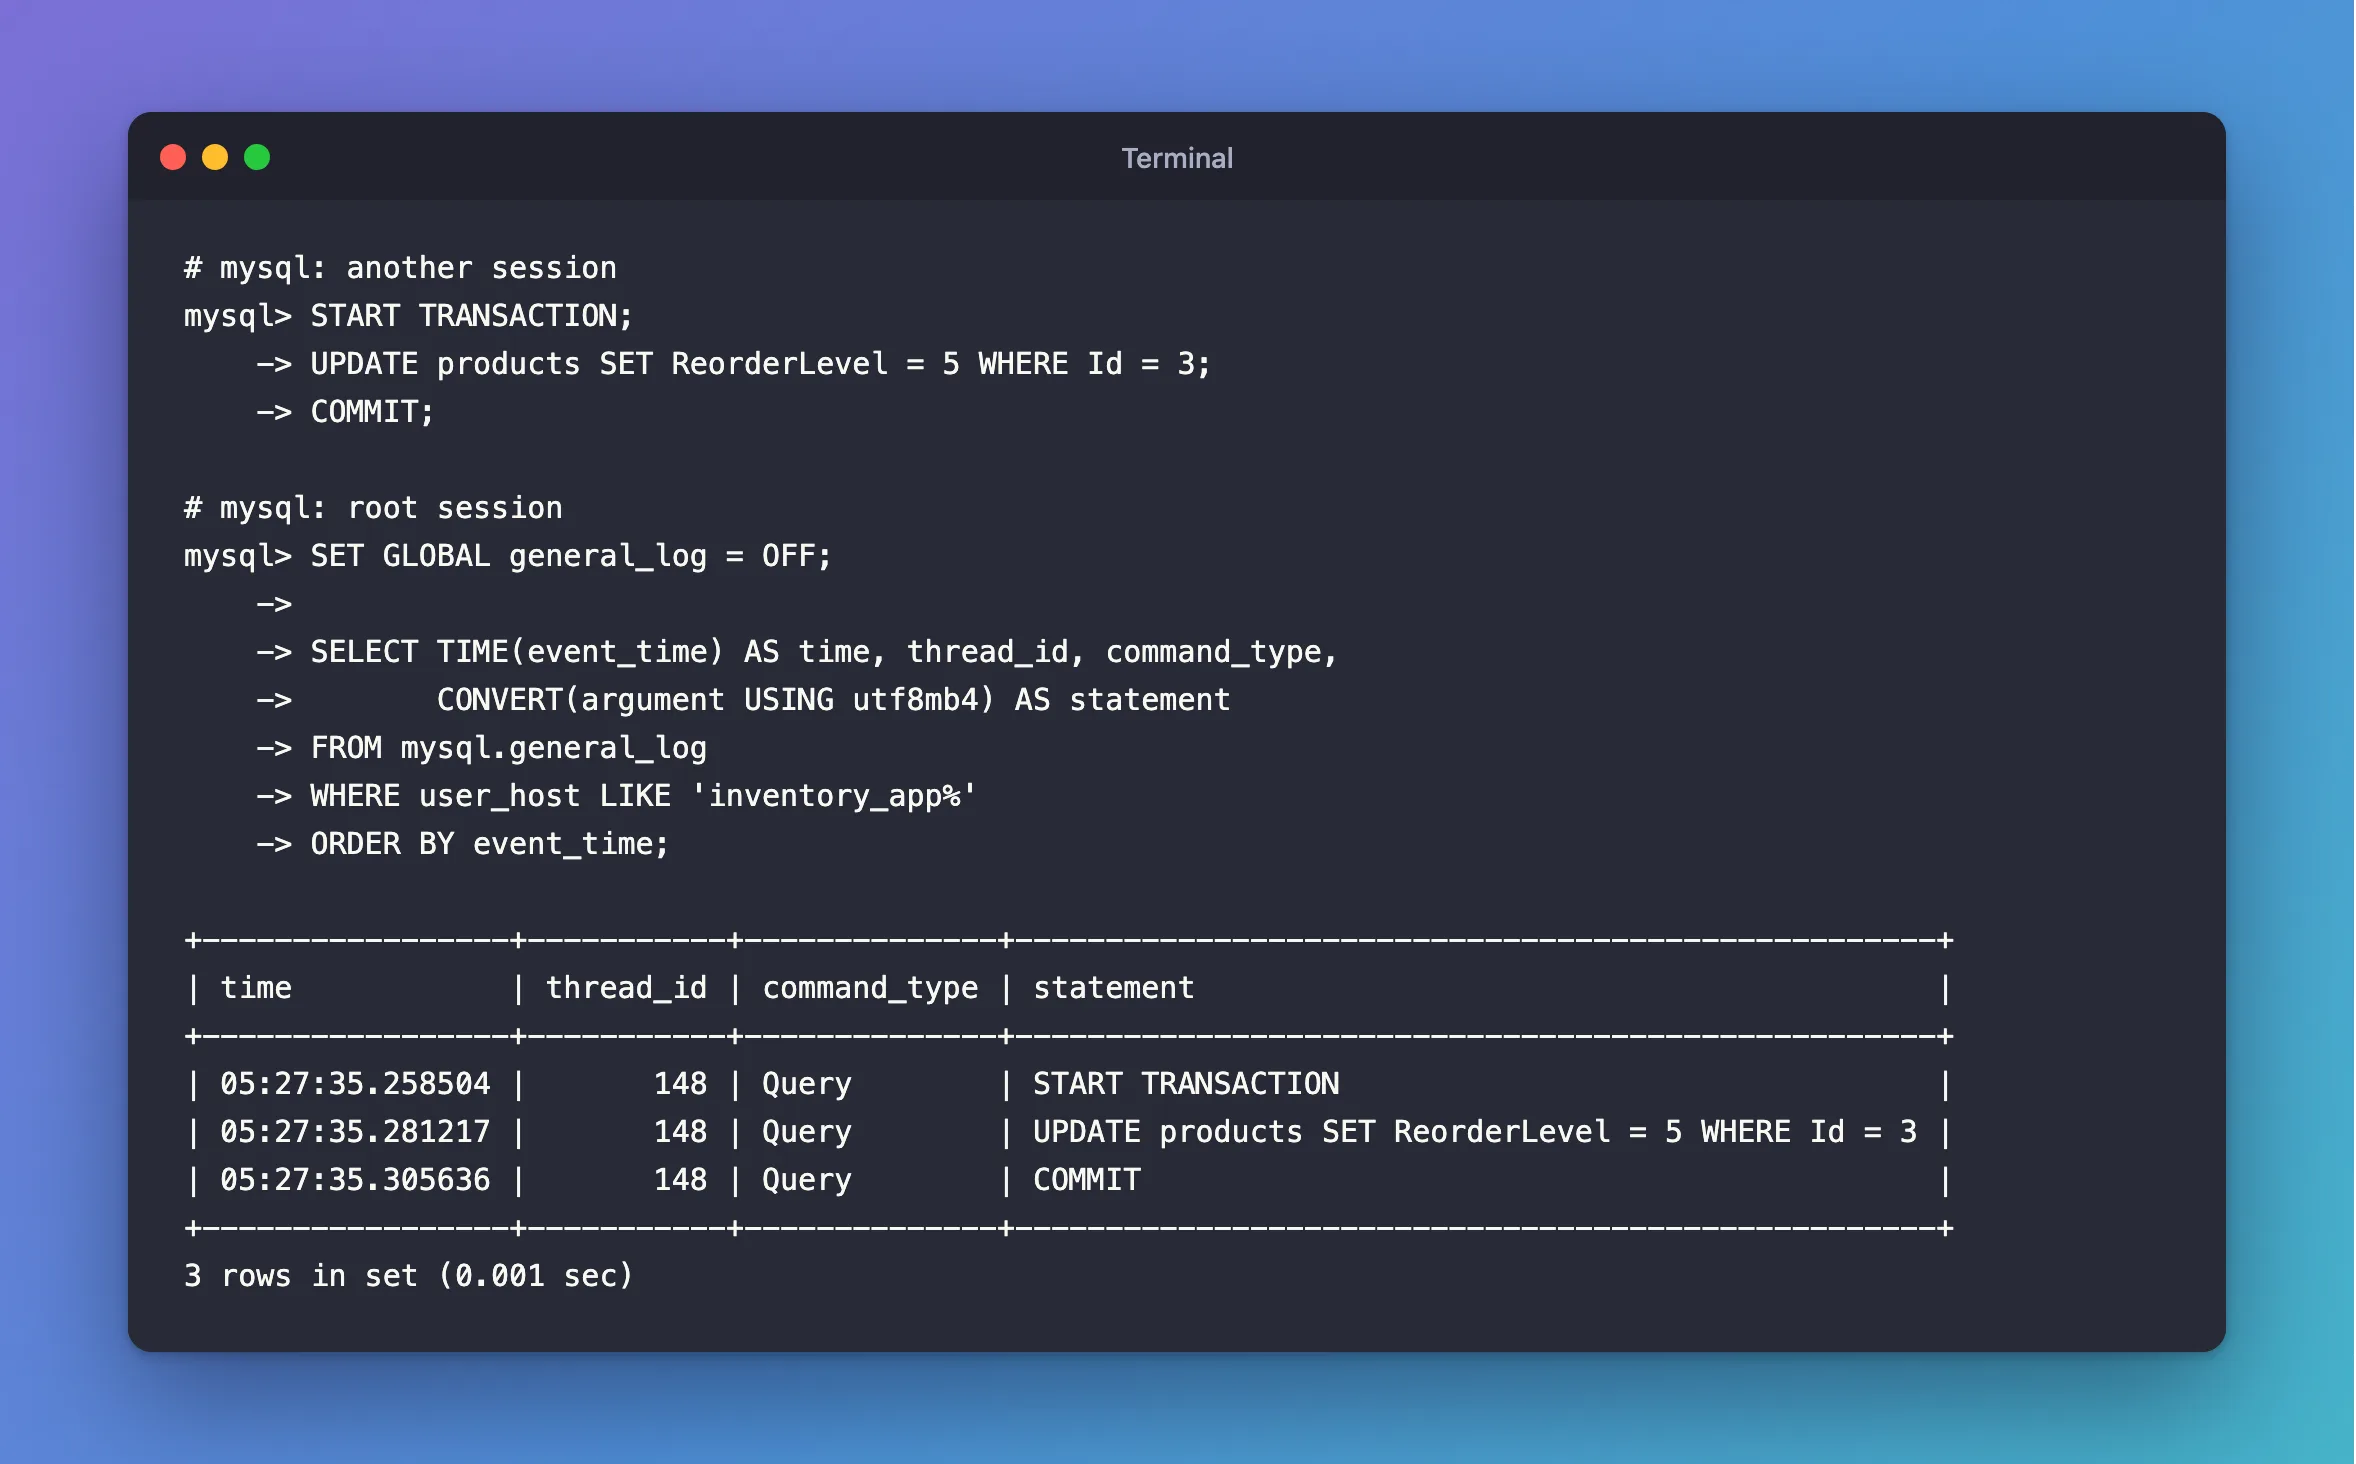
CONVERT is there because argument is stored as binary and would otherwise print as hexadecimal. thread_id is the connection, so you can tell two clients apart.
Here's what it shows for a real application. EF Core's SaveChanges sent this, on Oracle's provider, and none of those transaction statements were in my C#:
+----------------------------------------------------------------------------+
| statement                                                                  |
+----------------------------------------------------------------------------+
| SET TRANSACTION ISOLATION LEVEL REPEATABLE READ                            |
| BEGIN                                                                      |
| INSERT INTO `categories` (`CreatedAtUtc`, `Name`) VALUES (timestamp('2026- |
| SELECT `Id` FROM `categories` WHERE ROW_COUNT() = 1 AND `Id` = LAST_INSERT |
| COMMIT                                                                     |
+----------------------------------------------------------------------------+
Values appear in the log with the parameters already filled in, so this is the place to check what really reached the server.
Step 4: Or Read It from the File
The file is the default, and the Docker image keeps it in the data folder. Here's its end, through the container:
SET GLOBAL log_output = 'FILE';
SET GLOBAL general_log = ON;
Time                 Id Command    Argument
2026-11-05T05:27:35.549986Z	  148 Query	SELECT COUNT(*) FROM categories
2026-11-05T05:27:35.569592Z	  147 Query	SET GLOBAL general_log = OFF
Step 5: Turn It Off
SET GLOBAL general_log = OFF;
SELECT @@general_log, @@log_output;
+---------------+--------------+
| @@general_log | @@log_output |
+---------------+--------------+
|             0 | FILE         |
+---------------+--------------+
1 row in set (0.000 sec)
Common Mistakes
| Mistake | What happens | Do this instead |
|---|---|---|
| Leaving it on | It records every statement, and it grows without limit | Turn it on, look, and turn it off |
| Sharing the log | It can contain data and even passwords | Treat it as sensitive |
Reading argument without CONVERT | The statement prints as hexadecimal | CONVERT(argument USING utf8mb4) |
| Reading it while it's on | Your own query lands in it | Turn it off first, or filter by user_host |
Troubleshooting
| Symptom | Likely cause | Fix |
|---|---|---|
| The table is empty | log_output is FILE, or the log is off | Check all three settings |
Access denied; you need (at least one of) the SUPER or SYSTEM_VARIABLES_ADMIN | It needs an administrator | The fix |
SELECT from the table is slow | It has grown large | TRUNCATE TABLE mysql.general_log |
FAQ
How is this different from EF Core's SQL logs?
EF Core logs what it asked for, with placeholders such as @p0. The general log shows what MySQL received, with the values, and what the driver added around it, such as SET TRANSACTION ISOLATION LEVEL. How to See the SQL That EF Core Sends to the Database covers the first one.
Conclusion
SET GLOBAL log_output = 'TABLE', SET GLOBAL general_log = ON, do the thing, OFF, and read mysql.general_log. It's the most direct way to see what your program really sends, and it's a tool for a few minutes on a development server.
Additional Resources
- The General Query Log — how it works.
- Selecting General Query Log and Slow Query Log Output Destinations — table or file.
