How to See an Evaluation's Metrics and Plots in the MLflow UI

mlflow.models.evaluate puts its results in two places in the MLflow UI: on the run it logged to, with the plots, and on the page of the model it evaluated. This guide finds both for a tumour classifier, and explains the one oddity you'll see, a +1 next to each metric's model, on MLflow 3.18.0.
How an Evaluation Shows Up
An evaluation writes to a run: its metrics, and for a classifier five plots on the run's Artifacts tab. Each metric is also linked to the evaluated model, so the model's page lists it with the dataset it was measured on and the run that measured it.
Prerequisites
- An MLflow tracking server at
http://127.0.0.1:8080. MLflow's tracking server guide shows how to start one. mlflowandscikit-learnin your project, for example withuv add mlflow scikit-learn pandas.
Step 1: Run an Evaluation
The example logs a logistic regression named tumour-model and evaluates it, in a run named tumour-classifier:
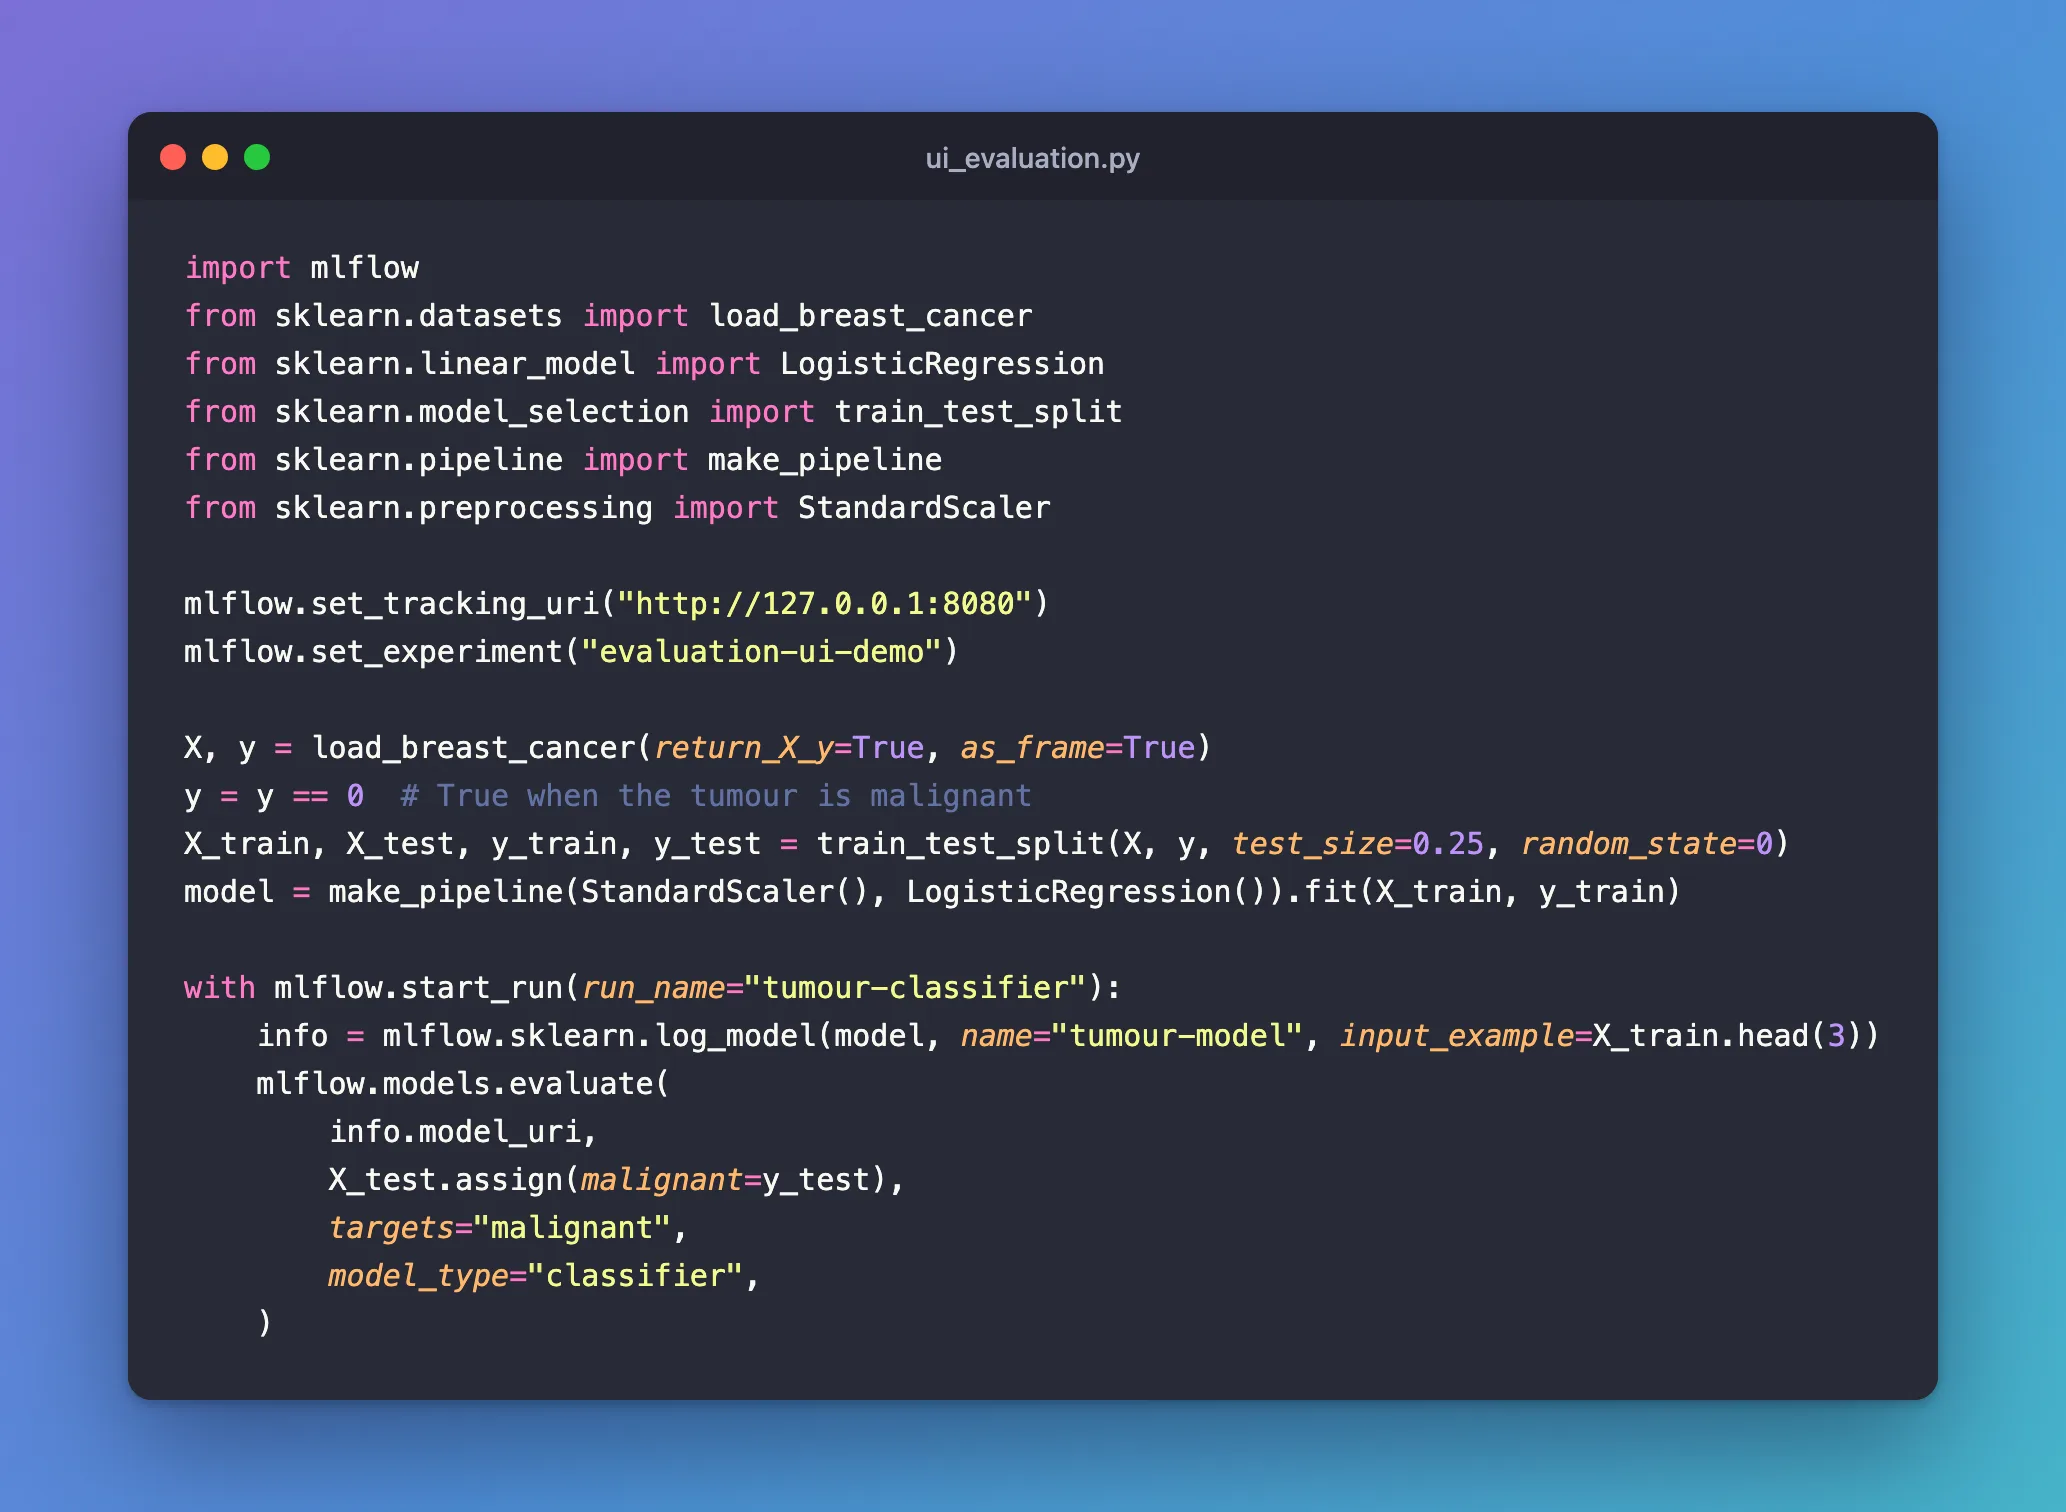
import mlflow
from sklearn.datasets import load_breast_cancer
from sklearn.linear_model import LogisticRegression
from sklearn.model_selection import train_test_split
from sklearn.pipeline import make_pipeline
from sklearn.preprocessing import StandardScaler

mlflow.set_tracking_uri("http://127.0.0.1:8080")
mlflow.set_experiment("evaluation-ui-demo")

X, y = load_breast_cancer(return_X_y=True, as_frame=True)
y = y == 0  # True when the tumour is malignant
X_train, X_test, y_train, y_test = train_test_split(X, y, test_size=0.25, random_state=0)
model = make_pipeline(StandardScaler(), LogisticRegression()).fit(X_train, y_train)

with mlflow.start_run(run_name="tumour-classifier"):
    info = mlflow.sklearn.log_model(model, name="tumour-model", input_example=X_train.head(3))
    mlflow.models.evaluate(
        info.model_uri,
        X_test.assign(malignant=y_test),
        targets="malignant",
        model_type="classifier",
    )
uv run python ui_evaluation.py
2026/11/21 17:55:31 INFO mlflow.models.evaluation.default_evaluator: Testing metrics on first row...
2026/11/21 17:55:32 WARNING mlflow.models.evaluation.evaluators.shap: SHAP or matplotlib package is not installed, so model explainability insights will not be logged.
🏃 View run tumour-classifier at: http://127.0.0.1:8080/#/experiments/13/runs/09fd9ccabc6a490a8298c5bca12d0754
🧪 View experiment at: http://127.0.0.1:8080/#/experiments/13
How to Evaluate a Classification Model with mlflow.models.evaluate explains the call and its output.
Step 2: See the Metrics on the Run
Open the View run link, or the experiment evaluation-ui-demo and the run tumour-classifier. Its Overview lists the 13 metrics:
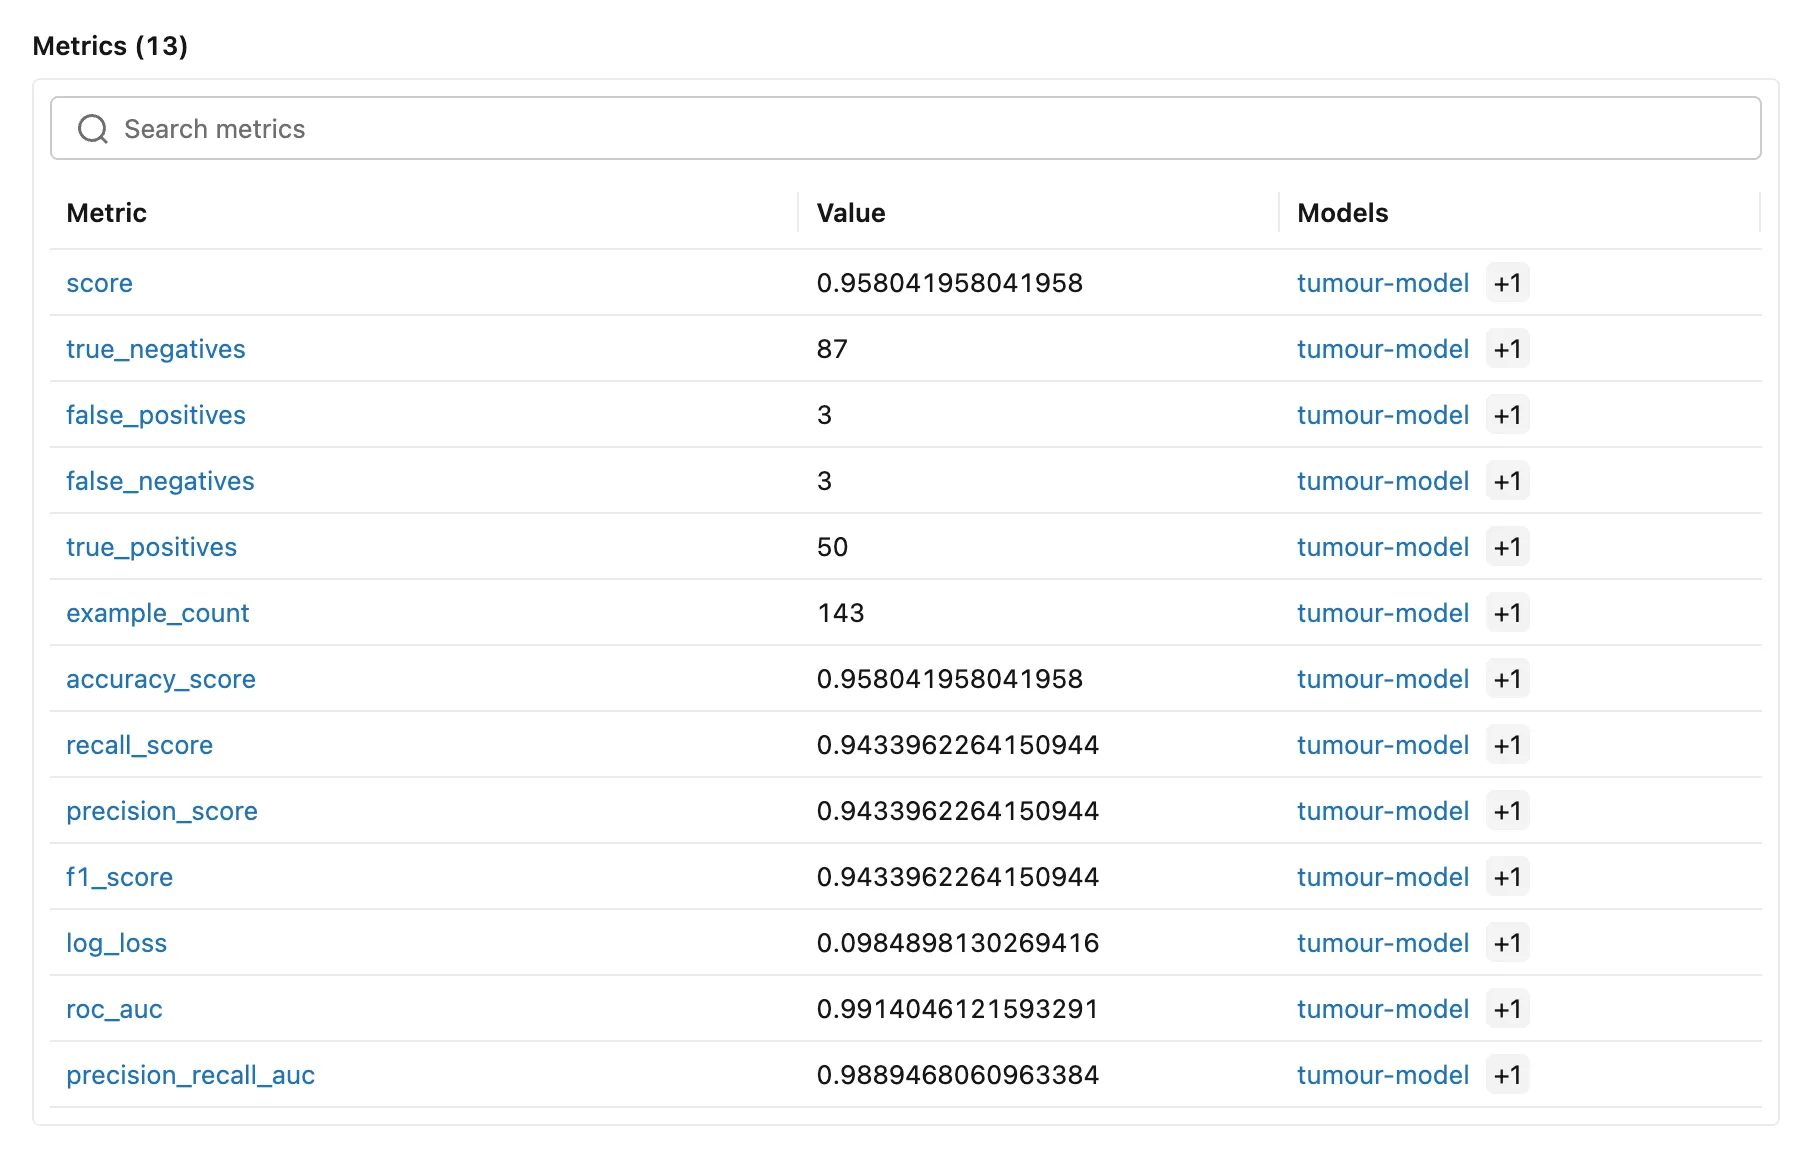
The Models column links each metric to tumour-model, and shows +1 after it. Clicking +1 lists tumour-model a second time: the same model. MLflow 3.18.0's evaluate logs every metric twice with the model's ID, once from the evaluator and once more after it, and the UI counts both. The values are the same. I reported it to MLflow as issue #28013.
Step 3: Open the Plots
Click the Artifacts tab. It lists the five plots; click one to open it, here roc_curve_plot.png:
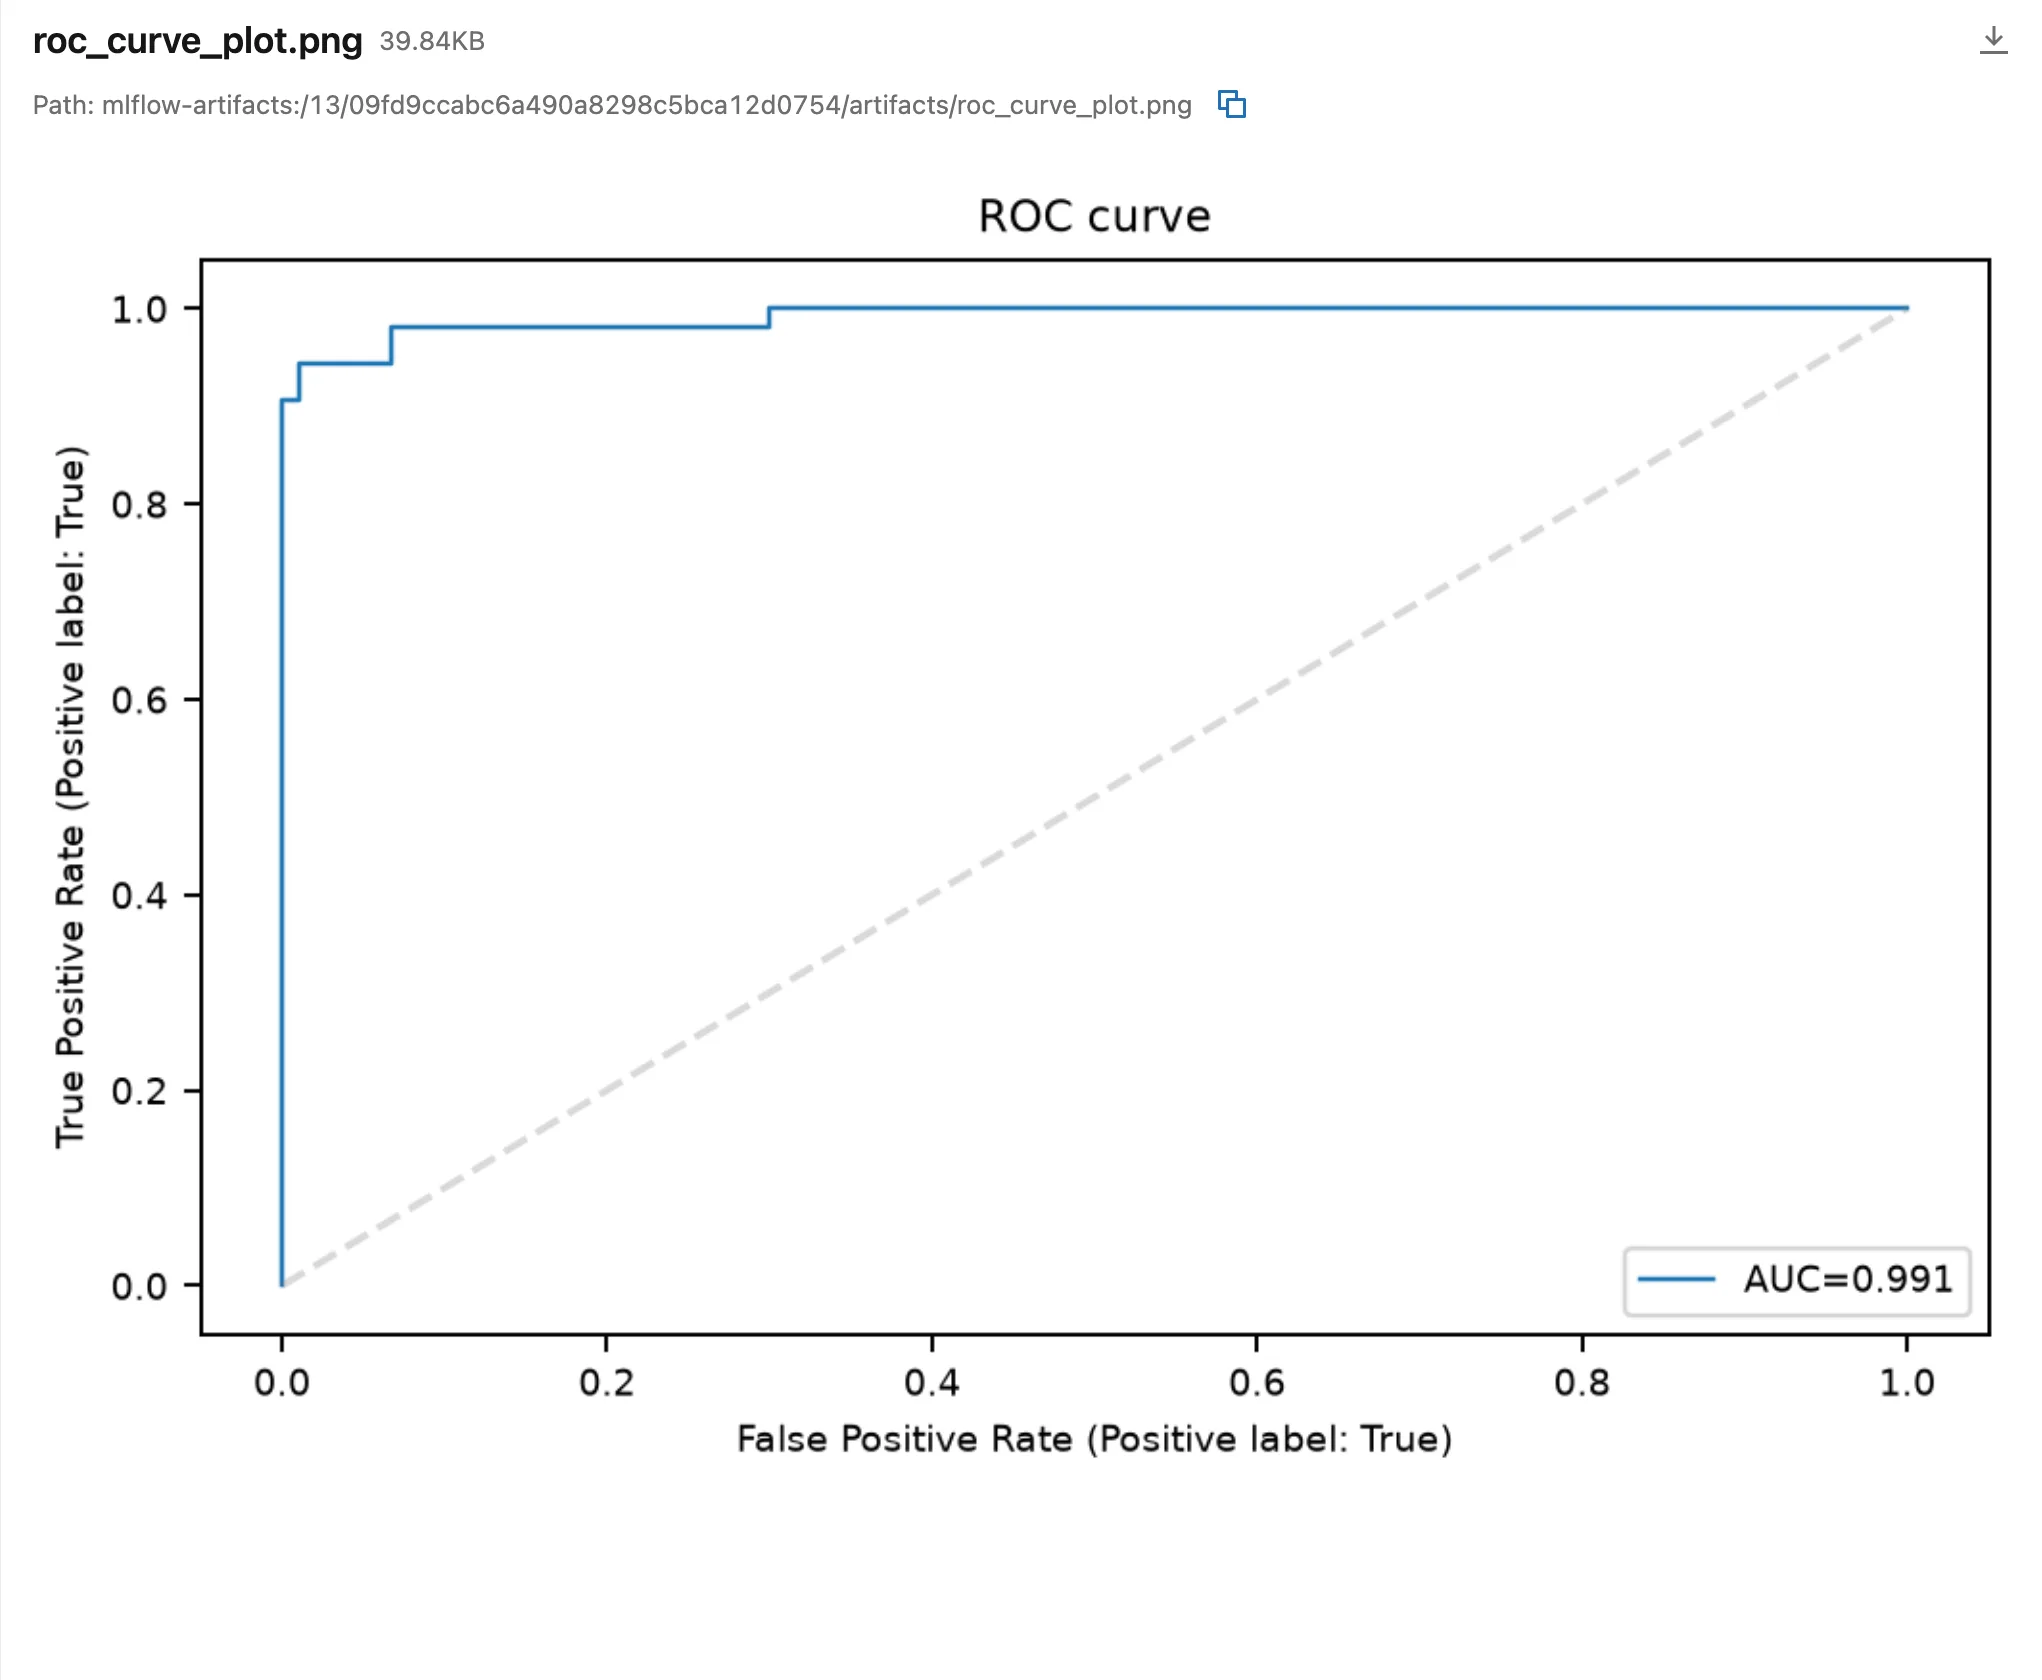
The other four are the normalized confusion matrix, the precision-recall curve, the lift curve and the calibration curve. A plot taller than the viewer scrolls inside it; the download icon at the top right saves the file.
Step 4: See the Metrics on the Model's Page
Go back to the experiment, open Models in the left menu, and click tumour-model. Its Metrics table lists the evaluation's metrics with the dataset and the run:
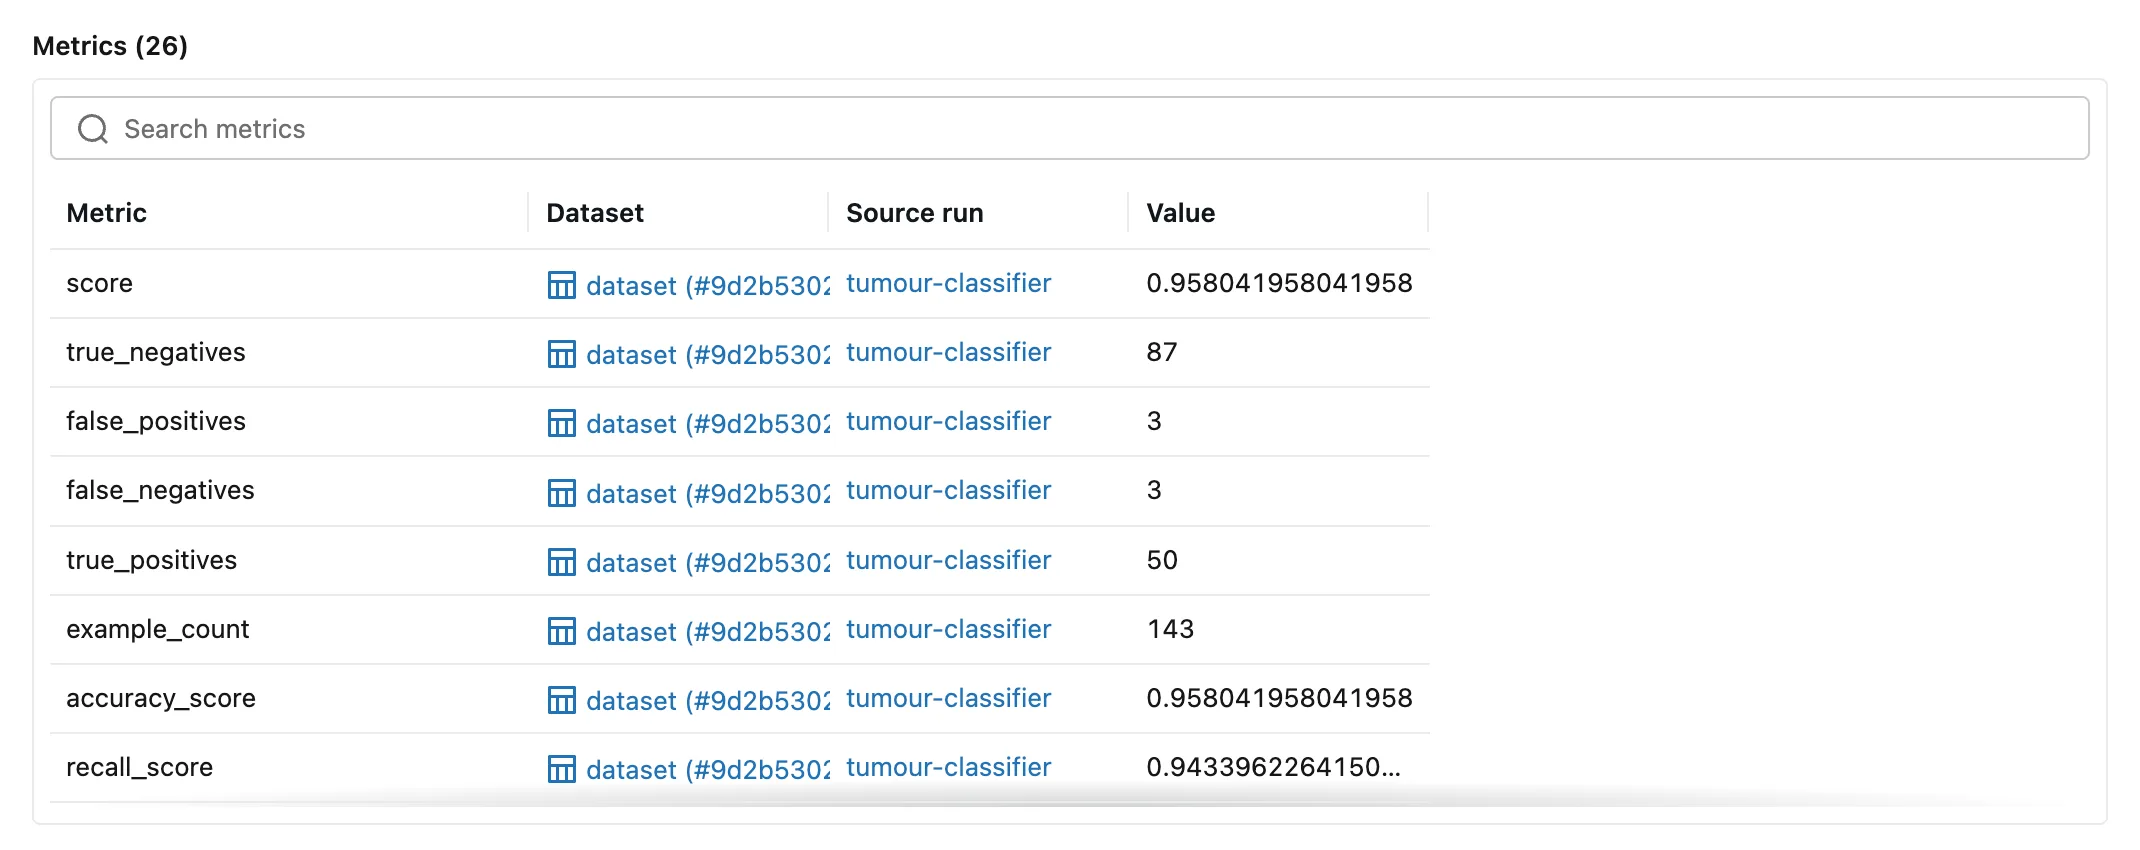
- Dataset:
dataset, the name MLflow gives a plain DataFrame, with a short form of its digest. How to Name the Dataset of an MLflow Evaluation gives it a real name. - Source run: the evaluation's run, one click away.
- Metrics (26): the 13 metrics, each twice, for the reason in Step 2.
Common Mistakes
| Mistake | What happens | Do this instead |
|---|---|---|
Reading +1 as a second model | It's the same model, linked twice | Click +1 to see it |
| Looking for a regressor's plots on the Artifacts tab | A regressor gets plots only from SHAP | Install shap, or add your own plot |
Troubleshooting
| Symptom | Likely cause | Fix |
|---|---|---|
| The model's page lists each metric twice | MLflow 3.18.0 logs evaluation metrics twice | Nothing to fix: the values are the same |
| The Artifacts tab is empty after an evaluation | A regressor without SHAP, or the evaluation failed | Check the run's status and the script's output |
FAQ
Can I compare two evaluations side by side?
Yes: select both runs on the experiment's Runs page and click Compare: How to Compare Runs in the MLflow UI.
Where are the plots stored?
On the tracking server, under the run's artifacts folder: the path at the top of each file.
Conclusion
The evaluation's 13 metrics are on the run's Overview, its five plots on the Artifacts tab, and the same metrics on the model's page with the dataset and the run that measured them, each counted twice in MLflow 3.18.0.
Additional Resources
- MLflow model evaluation — what the evaluation logs.
