How to Plot a Confusion Matrix in scikit-learn

A confusion matrix lays out every answer a classifier gave: which true class each case had, and which class the model said. The four cells for a yes/no problem are the true negatives, false positives, false negatives and true positives, which precision, recall and accuracy are all built from. This guide prints one for a medical test and draws it with scikit-learn, with real output from scikit-learn 1.9.1.
Syntax
from sklearn.metrics import ConfusionMatrixDisplay, confusion_matrix

counts = confusion_matrix(y_true, y_pred)
ConfusionMatrixDisplay.from_predictions(y_true, y_pred, normalize="true")
| Part | What it means |
|---|---|
y_true, y_pred | The true classes and the predicted ones, in the same order |
confusion_matrix | Returns the counts: one row per true class, one column per predicted class |
from_predictions | Draws the matrix with Matplotlib |
normalize="true" | Divides each row by its total, so each cell shows the share of that true class. None, the default, keeps the counts |
The reference for confusion_matrix defines the cell in row i and column j as "the number of observations known to be in group i and predicted to be in group j". So for two classes, the true negatives are top left, the false positives top right, the false negatives bottom left and the true positives bottom right.
Step 1: Count and Draw
Ten patients, four of them ill (1), and what a test said about each one:
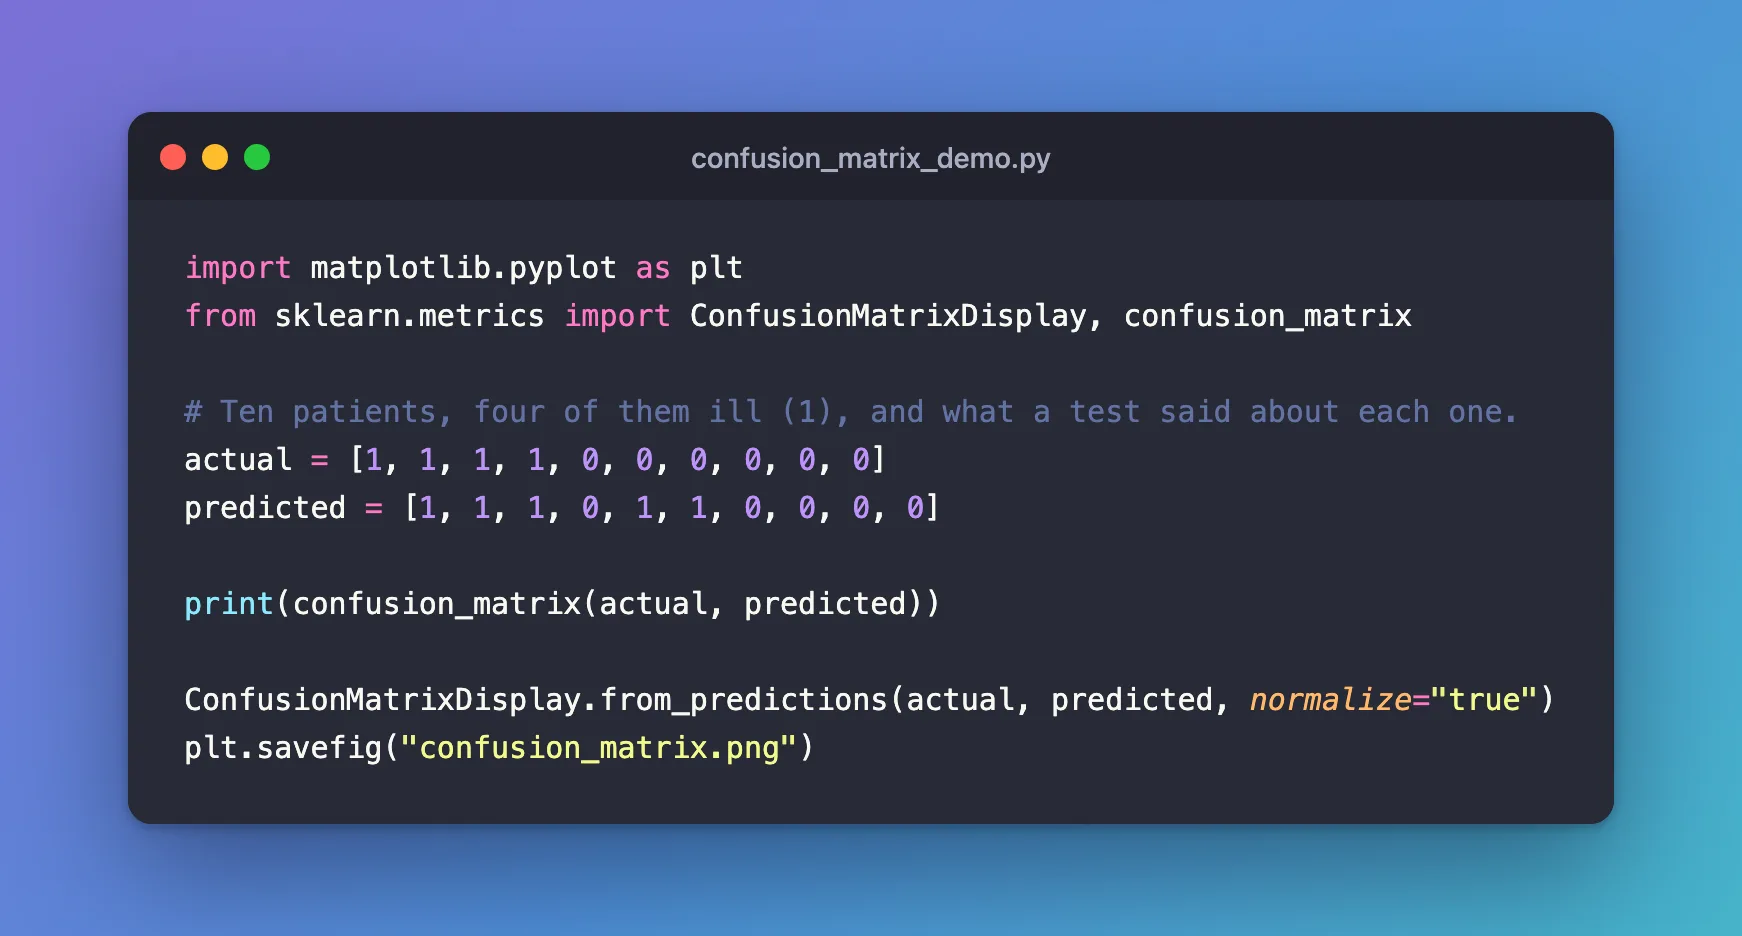
import matplotlib.pyplot as plt
from sklearn.metrics import ConfusionMatrixDisplay, confusion_matrix

# Ten patients, four of them ill (1), and what a test said about each one.
actual = [1, 1, 1, 1, 0, 0, 0, 0, 0, 0]
predicted = [1, 1, 1, 0, 1, 1, 0, 0, 0, 0]

print(confusion_matrix(actual, predicted))

ConfusionMatrixDisplay.from_predictions(actual, predicted, normalize="true")
plt.savefig("confusion_matrix.png")
uv run python confusion_matrix_demo.py
[[4 2]
 [1 3]]

- First row, the six healthy patients: 4 cleared, 2 told they were ill (false positives).
- Second row, the four ill patients: 1 missed (a false negative), 3 found.
The script saved the drawing as confusion_matrix.png:
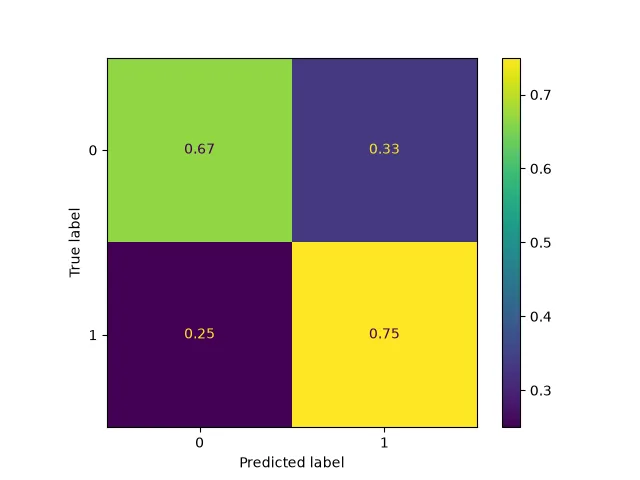
With normalize="true", each row adds up to 1: the test cleared 0.67 of the healthy patients and found 0.75 of the ill ones. The bottom-right cell is the recall, and the top-left one is the share of healthy patients cleared.
Common Mistakes
| Mistake | What happens | Do this instead |
|---|---|---|
| Reading columns as the true classes | Every cell gets the wrong meaning | Rows are the true classes, columns the predictions |
| Comparing raw counts across classes of different sizes | The big class's numbers dominate | normalize="true" |
Troubleshooting
| Symptom | Likely cause | Fix |
|---|---|---|
| No window opens | The script saves the figure instead of showing it | Open confusion_matrix.png, or call plt.show() |
| The matrix has one row and one column | Only one class among the answers | Score more cases, or pass labels= with every class |
FAQ
Can I label the classes with words?
Yes: pass display_labels=["healthy", "ill"] to from_predictions.
Does MLflow draw this for me?
Yes: mlflow.models.evaluate logs a normalized confusion matrix for every classifier it evaluates: How to Evaluate a Classification Model with mlflow.models.evaluate.
Conclusion
confusion_matrix counted the test's answers, [[4 2] [1 3]], and ConfusionMatrixDisplay.from_predictions(..., normalize="true") drew them as the share of each true class: 0.67 of the healthy patients cleared, 0.75 of the ill ones found.
Additional Resources
- sklearn.metrics.confusion_matrix — the counts and
normalize. - sklearn.metrics.ConfusionMatrixDisplay —
from_predictionsand its options.
