How to Plot a Calibration Curve in scikit-learn

A classifier's predict_proba gives numbers between 0 and 1, but are they real chances? If a model says 0.8 for a hundred cases, about eighty of them should turn out positive. A calibration curve checks exactly that. This guide plots one for two logistic regressions, a plain one and one trained with balanced class weights, with real output from scikit-learn 1.9.1.
Syntax
from sklearn.calibration import CalibrationDisplay

CalibrationDisplay.from_estimator(model, X_test, y_test, n_bins=10, name="label", ax=ax)
| Part | What it means |
|---|---|
model | A fitted binary classifier with predict_proba |
X_test, y_test | Rows the model didn't train on, and their true classes |
n_bins | How many groups to split the predicted probabilities into |
name, ax | The curve's name in the legend, and the Matplotlib axes to draw on, so several curves can share one plot |
scikit-learn's user guide explains what a good model looks like: "a well calibrated (binary) classifier should classify the samples such that among the samples to which it gave a predict_proba value close to, say, 0.8, approximately 80% actually belong to the positive class." On the plot, the x-axis "represents the average predicted probability in each bin", and the y-axis is "the fraction of positives" in it.
Step 1: Plot Two Models
The example makes 5,000 rows, about 15 in 100 of them positive, and fits a logistic regression twice, once with class_weight="balanced":
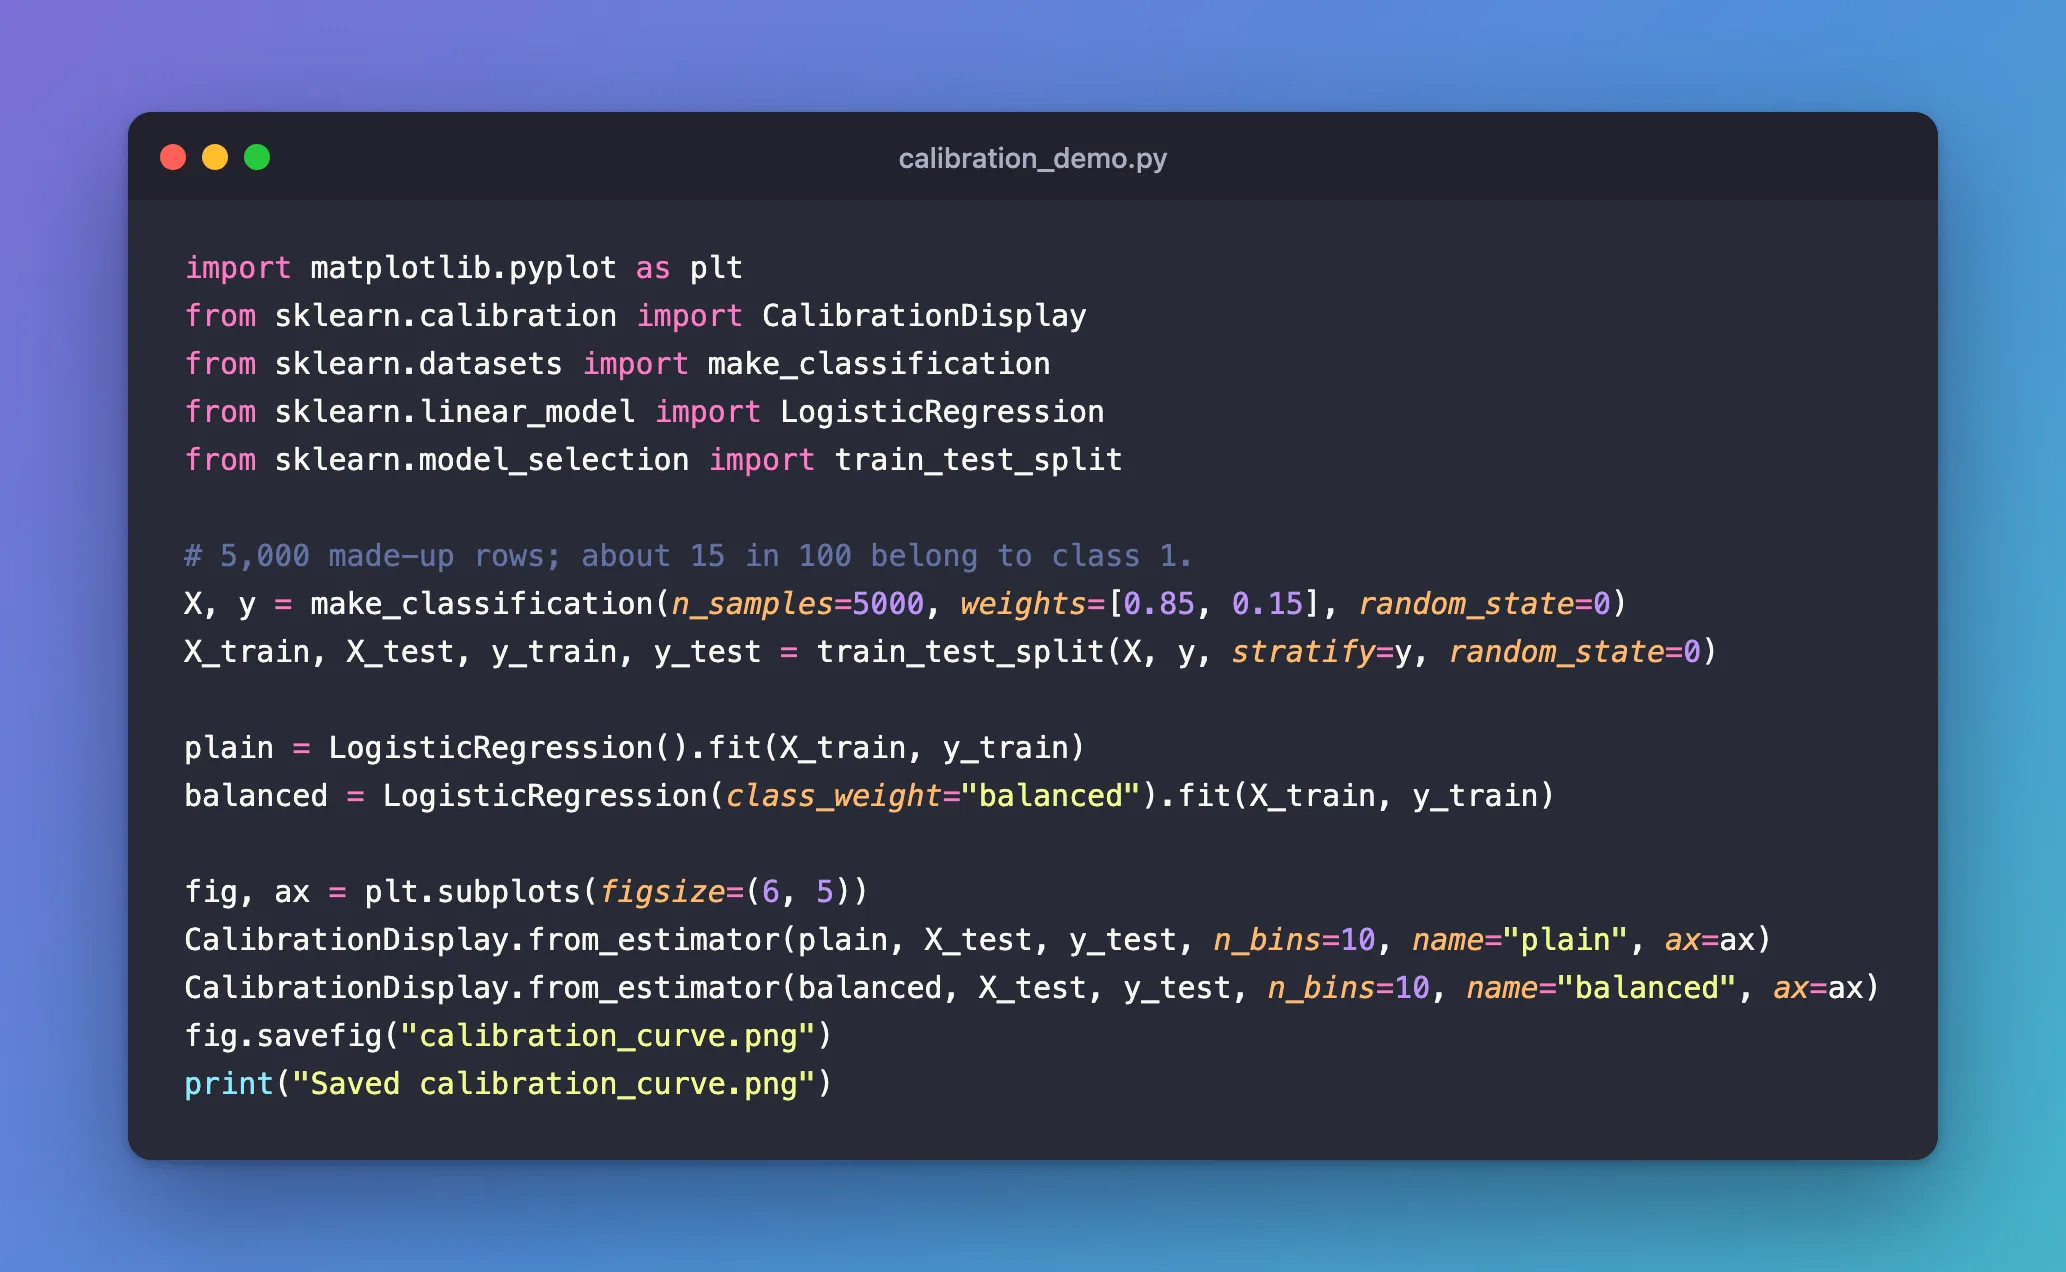
import matplotlib.pyplot as plt
from sklearn.calibration import CalibrationDisplay
from sklearn.datasets import make_classification
from sklearn.linear_model import LogisticRegression
from sklearn.model_selection import train_test_split

# 5,000 made-up rows; about 15 in 100 belong to class 1.
X, y = make_classification(n_samples=5000, weights=[0.85, 0.15], random_state=0)
X_train, X_test, y_train, y_test = train_test_split(X, y, stratify=y, random_state=0)

plain = LogisticRegression().fit(X_train, y_train)
balanced = LogisticRegression(class_weight="balanced").fit(X_train, y_train)

fig, ax = plt.subplots(figsize=(6, 5))
CalibrationDisplay.from_estimator(plain, X_test, y_test, n_bins=10, name="plain", ax=ax)
CalibrationDisplay.from_estimator(balanced, X_test, y_test, n_bins=10, name="balanced", ax=ax)
fig.savefig("calibration_curve.png")
print("Saved calibration_curve.png")
uv run python calibration_demo.py
Saved calibration_curve.png
The saved plot:
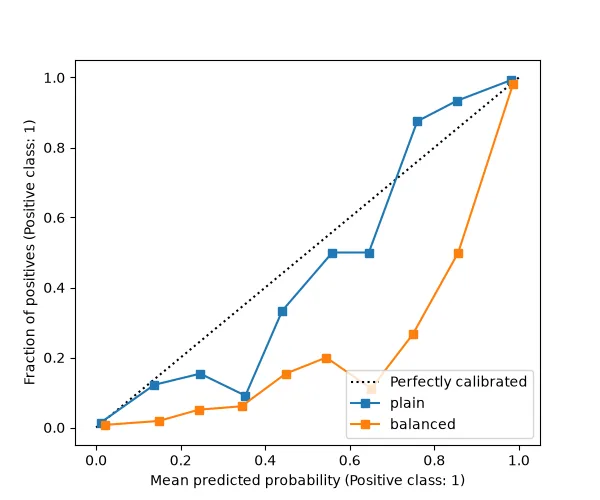
- The dotted diagonal is a perfectly calibrated model: the share of positives equals the probability it predicted.
- The plain model, in blue, stays close to it: its probabilities can be read as chances.
- The balanced model, in orange, runs far below it: rows it gave about 0.75 were positive only about 3 times in 10. Balanced class weights push its probabilities up, so they're higher than the real chances.
Common Mistakes
| Mistake | What happens | Do this instead |
|---|---|---|
| Plotting on the training rows | The curve looks better than the model is | Use rows the model didn't train on |
| Reading a balanced-weight model's probabilities as chances | They overstate how likely a positive is | Check the curve first, and treat them as scores |
Troubleshooting
| Symptom | Likely cause | Fix |
|---|---|---|
| A jagged curve | Few rows in some bins | More test rows, or fewer bins |
| Each curve in its own figure | No shared ax | Create one with plt.subplots() and pass ax=ax to each call |
FAQ
Does ranking quality change with calibration?
Not necessarily: a model can rank cases well, with a high ROC AUC, and still give probabilities that are too high or too low. The curve checks the probabilities' values, not their order.
Can I fix a badly calibrated model?
scikit-learn's CalibratedClassifierCV re-calibrates a classifier; its user guide page covers how.
Conclusion
CalibrationDisplay.from_estimator plotted both models against the diagonal. The plain logistic regression's probabilities followed it; the balanced one's ran well above the real share of positives, which matters whenever its probabilities are read as chances.
Additional Resources
- Probability calibration — the user guide on calibration curves and re-calibration.
- sklearn.calibration.CalibrationDisplay —
from_estimatorandfrom_predictions.
