How to Open the MLflow UI and Find Your Runs

The MLflow UI is where your runs become useful: every setting, score and chart in one place, searchable and comparable. MLflow 3.18's UI serves two audiences, AI apps and classic model training, and opens in the AI view by default. This tour switches it to model training and walks through the pages you'll use most: experiments, the runs table, and a run's own page.
How the MLflow UI Is Organized
Everything in the UI hangs off two things, experiments and runs:
Experiment          a group of runs, such as one project
└── Run             one execution of your code
    ├── Parameters  the settings it used
    ├── Metrics     the numbers it measured
    ├── Tags        labels, such as who ran it
    └── Artifacts   the files it saved, such as charts
Every experiment and run has an ID, and its page has an address you can bookmark or share:
| Page | Address |
|---|---|
| An experiment and its runs | http://127.0.0.1:8080/#/experiments/<experiment ID> |
| One run | http://127.0.0.1:8080/#/experiments/<experiment ID>/runs/<run ID> |
MLflow prints both links each time a script logs a run to a tracking server. The steps below walk through these pages in order.
Prerequisites
- A running MLflow tracking server. See How to Start an MLflow Tracking Server on Your Computer. This tour uses
http://127.0.0.1:8080. - Some runs to look at. The screenshots show the house price runs from MLflow Tutorial for Machine Learning in Python — Part 1.
Step 1: Open the UI
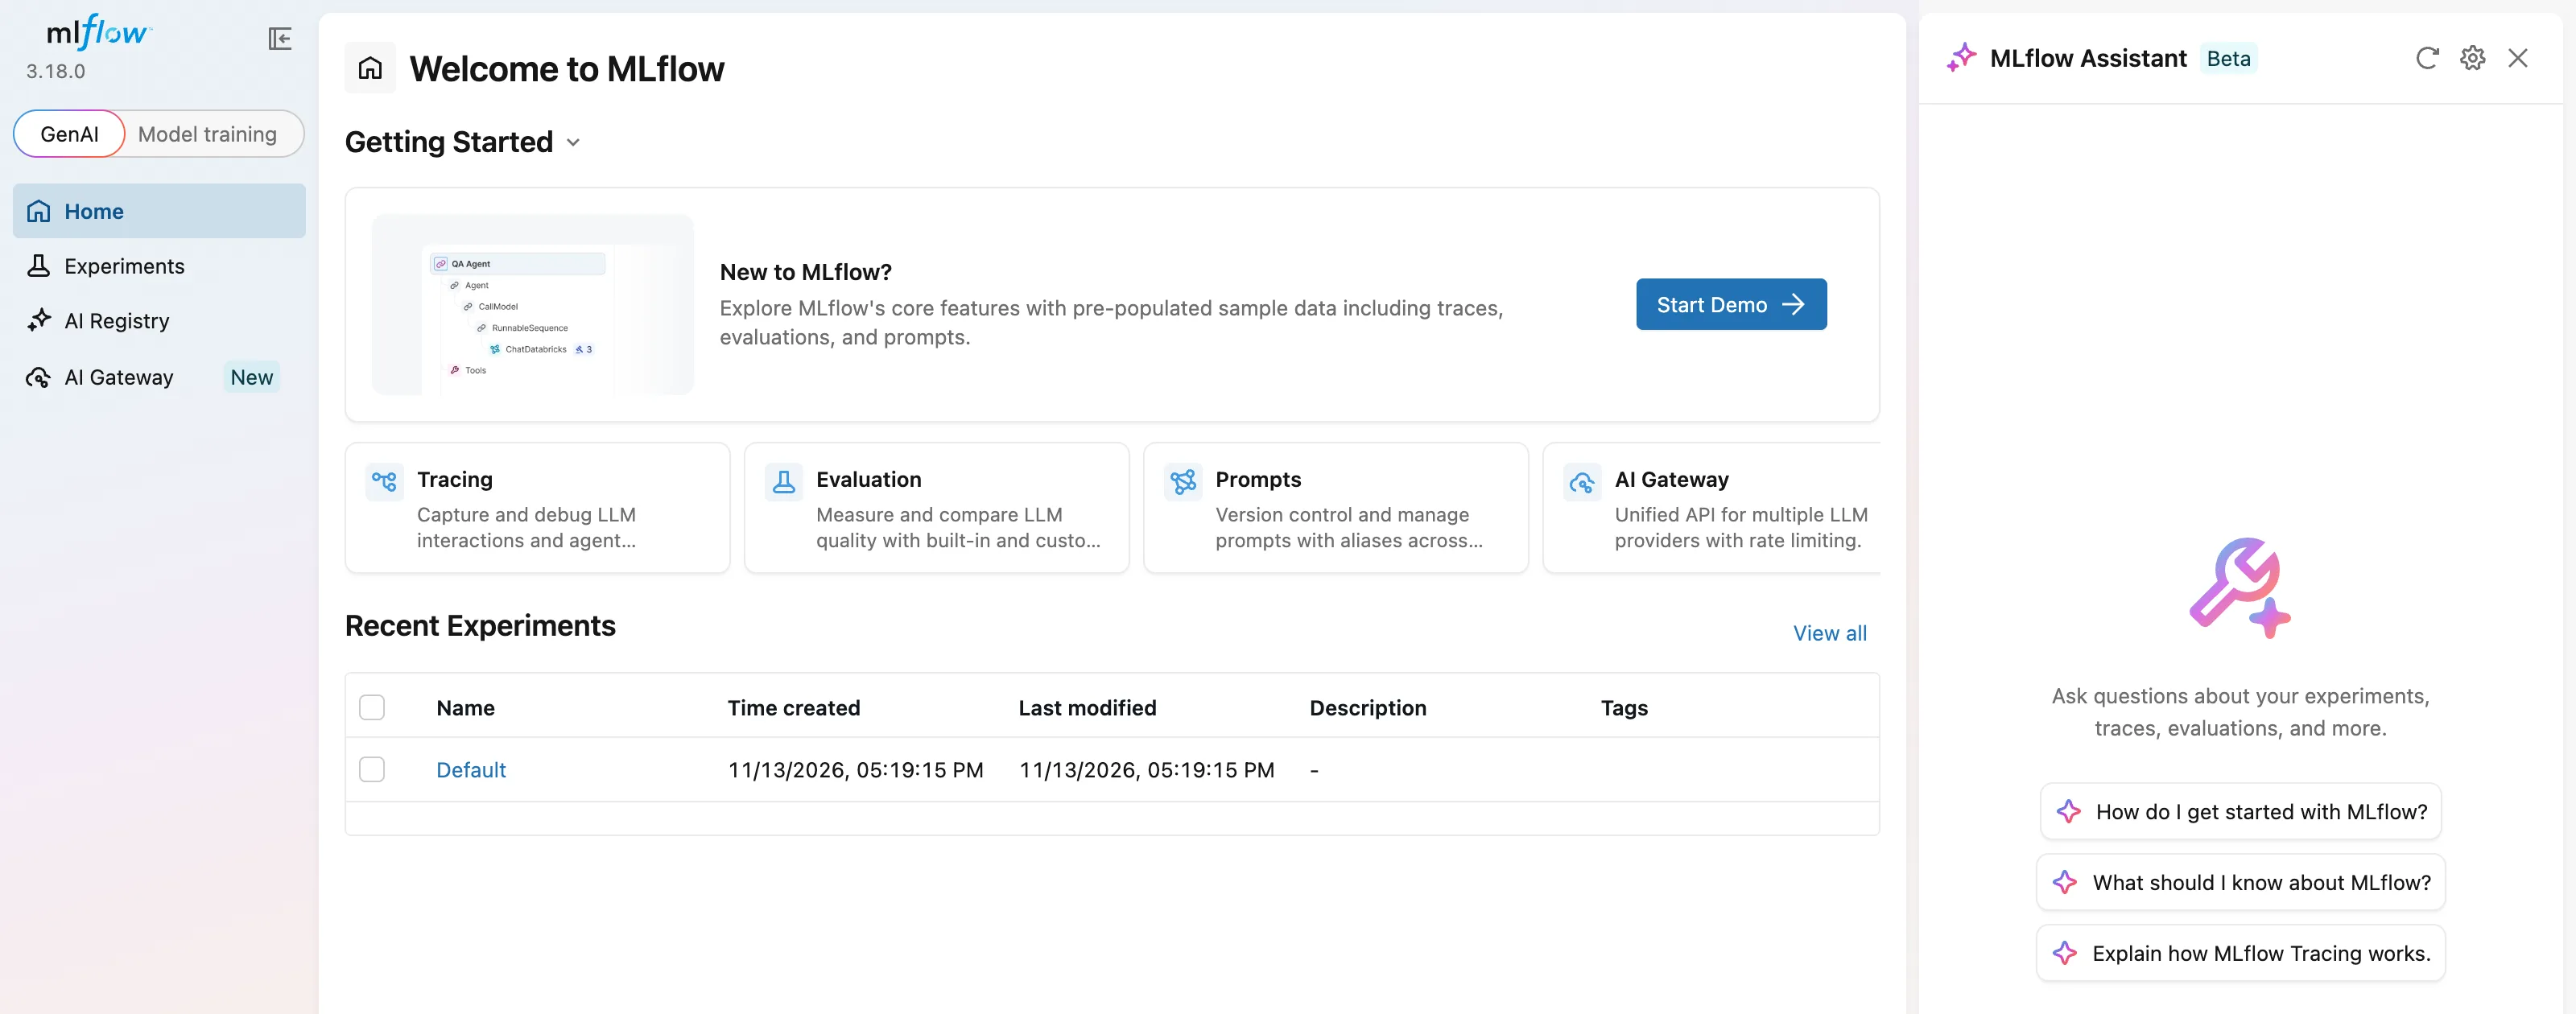
Open the server's address, http://127.0.0.1:8080, in your browser. On the first visit, MLflow opens the GenAI view with the MLflow Assistant panel on the right:
Step 2: Switch to Model Training
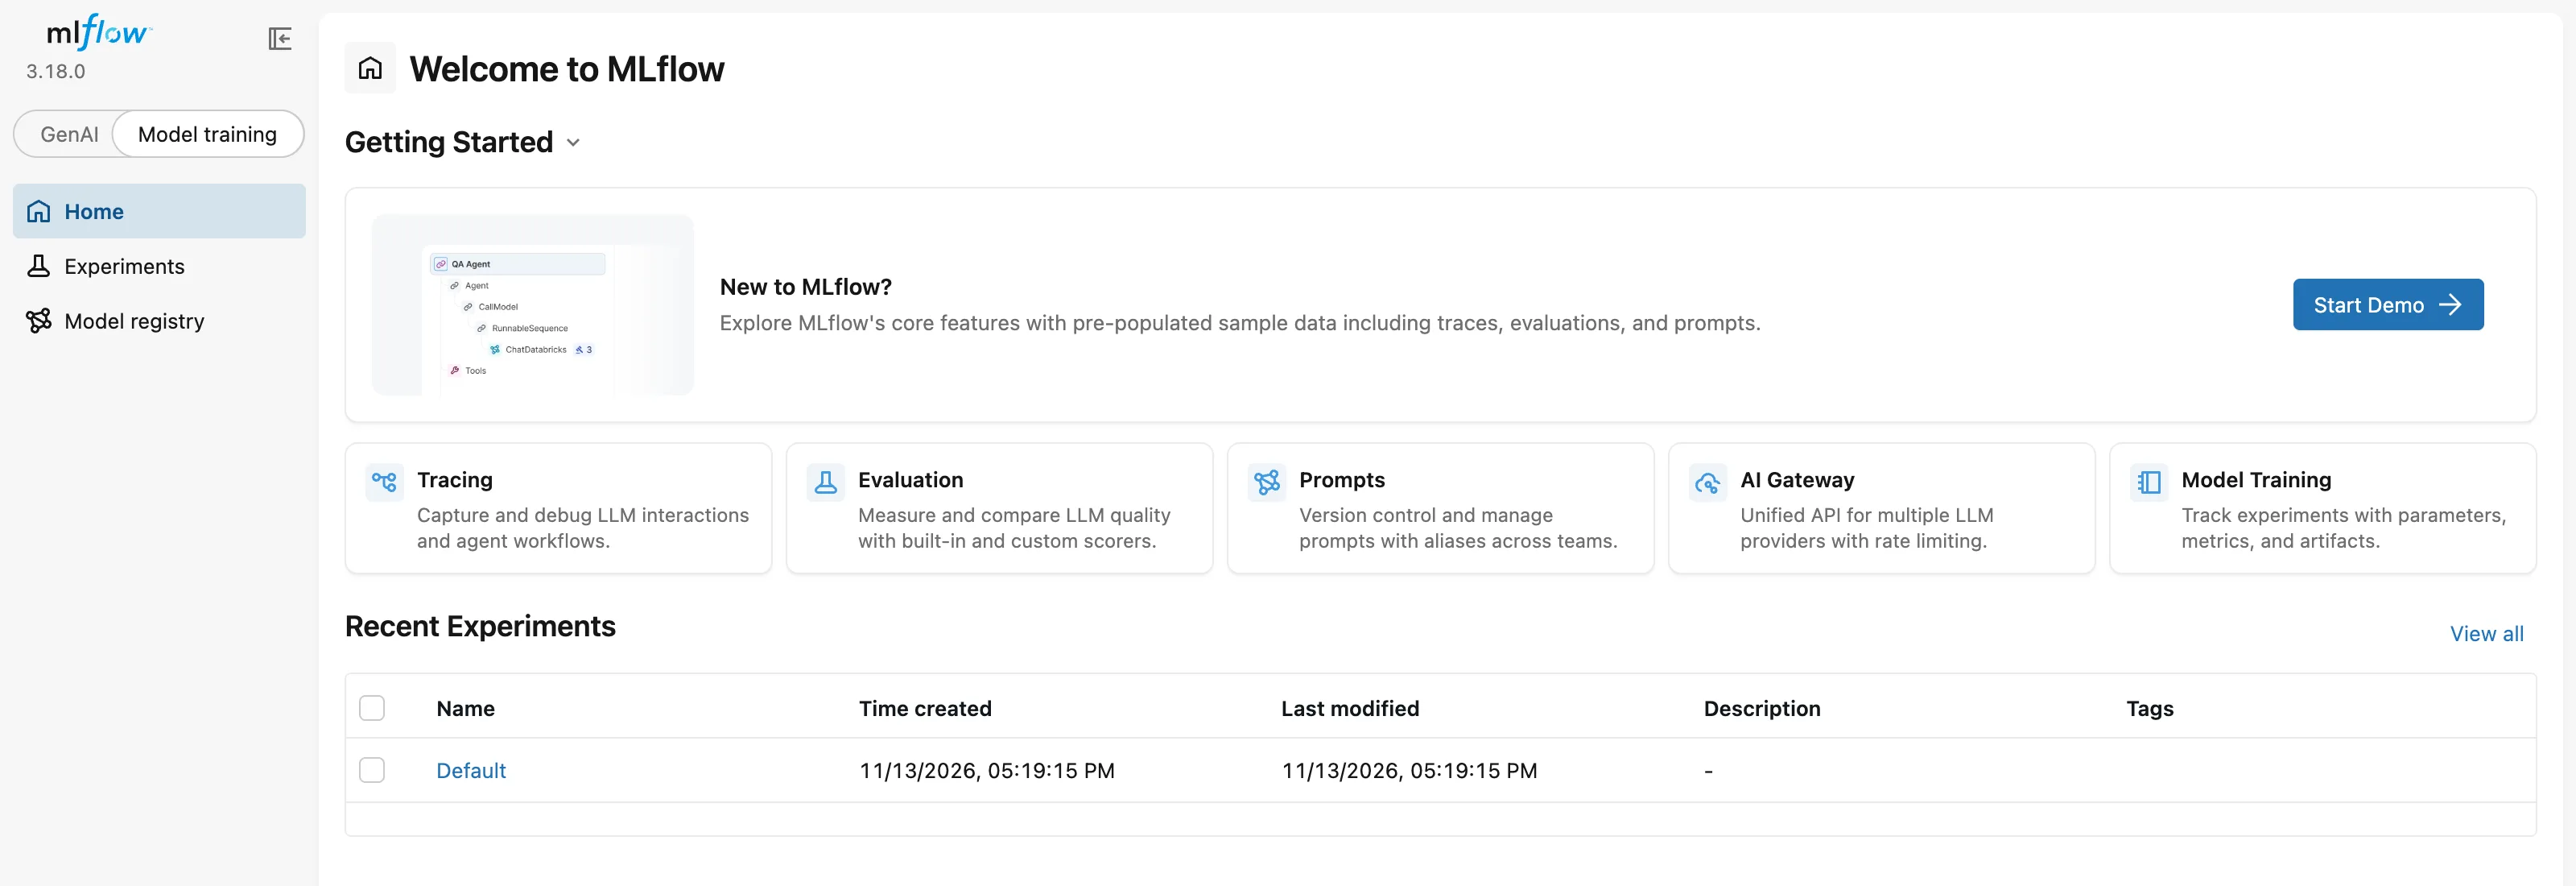
- At the top of the sidebar, click Model training. The menu changes to Home, Experiments and Model registry, the pages for classic machine learning.
- Close the MLflow Assistant panel with the X at its top right. The round button in the bottom-right corner opens it again when you want it.
Your browser remembers both choices:
Step 3: Find Your Experiment
Click Experiments in the sidebar. Every experiment on the server is listed, with when it was created and last changed:

Default always exists; MLflow creates it with the server. Your own experiments appear when your code first uses them. Use the search box when the list grows.
Step 4: Read the Runs Table
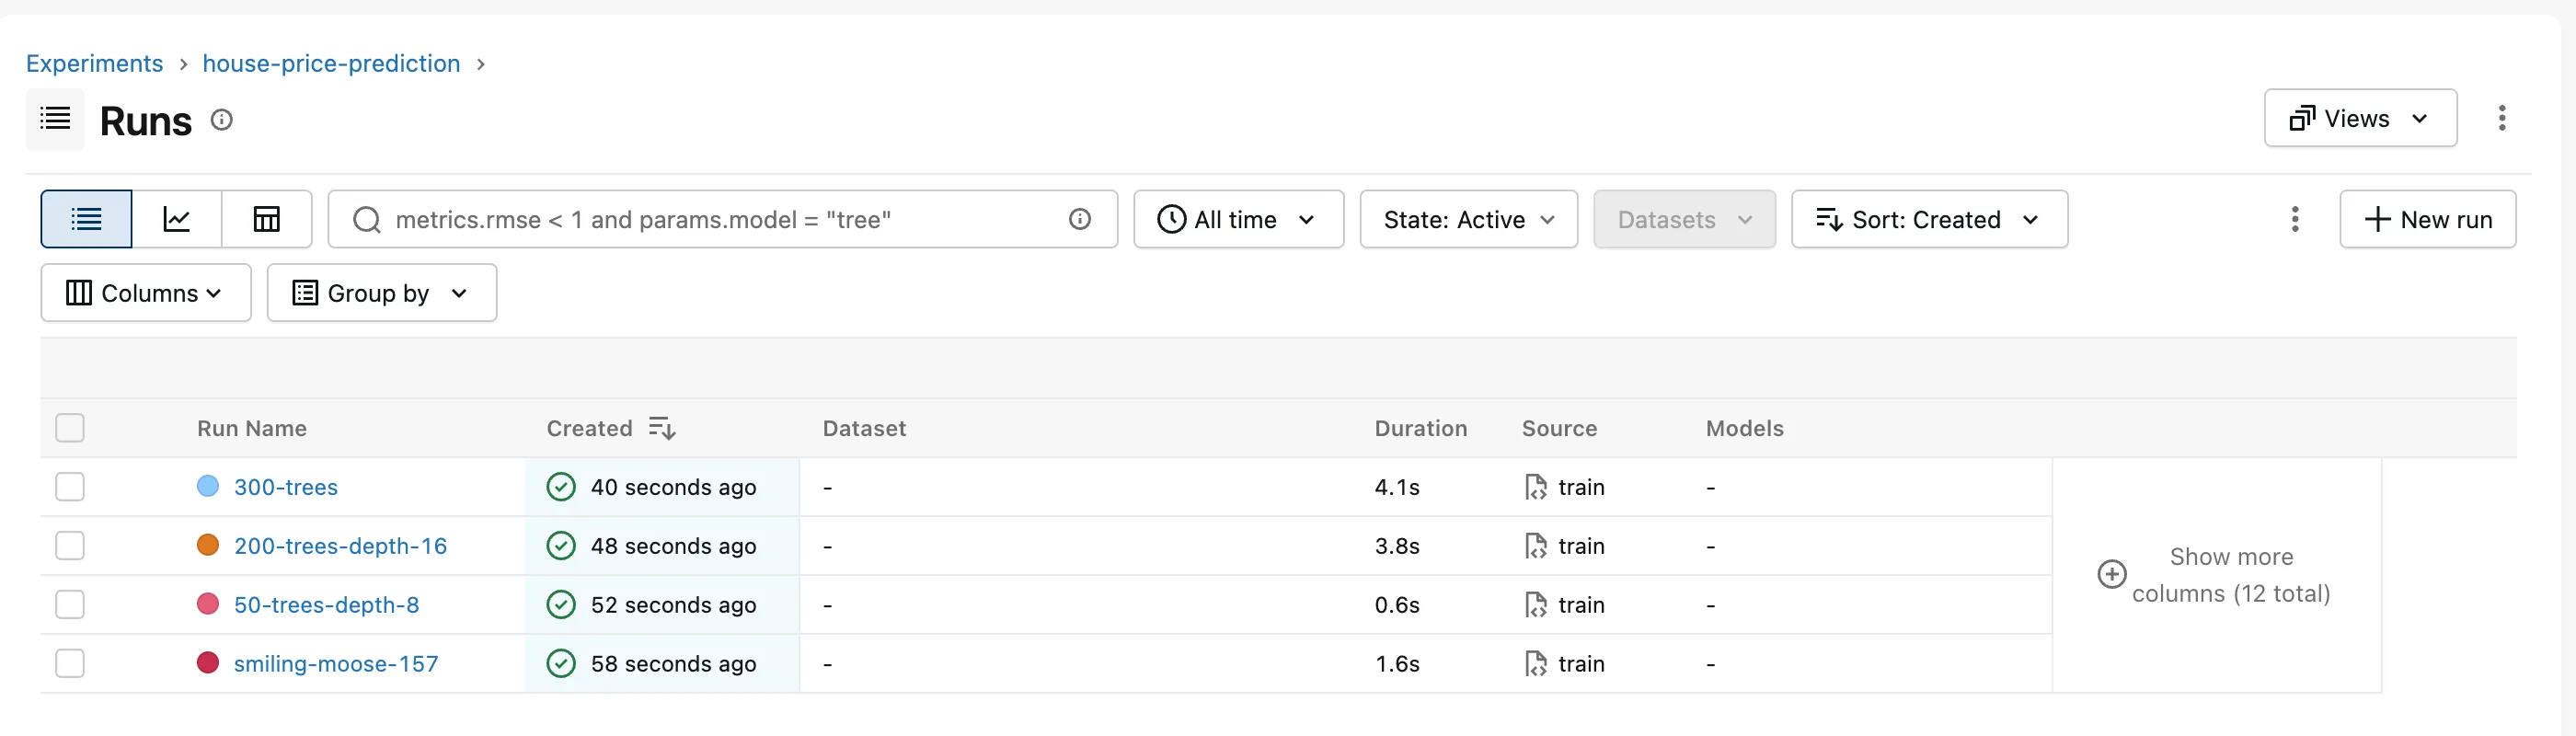
Click an experiment's name. Its Runs page lists one row per run, newest first:
| Part of the page | What it's for |
|---|---|
| Run Name | The name you gave the run, or one MLflow made up, such as smiling-moose-157 |
| Created | A green check means the run finished; a red cross means it failed |
| Duration, Source | How long the run took, and the command or file that ran it |
| Show more columns | Your parameters and metrics are hidden at first; add them here or with Columns |
| The three buttons left of the search box | Switch between the table, charts of your metrics, and a view that compares tables your runs logged as files (it shows "No evaluation tables logged" until a run logs one) |
| The search box | Filters runs with expressions such as metrics.r2 > 0.8 |
How to Compare Runs in the MLflow UI puts the columns, charts and search to work.
Step 5: Open a Run
Click a run's name. The Overview tab shows everything the run recorded:
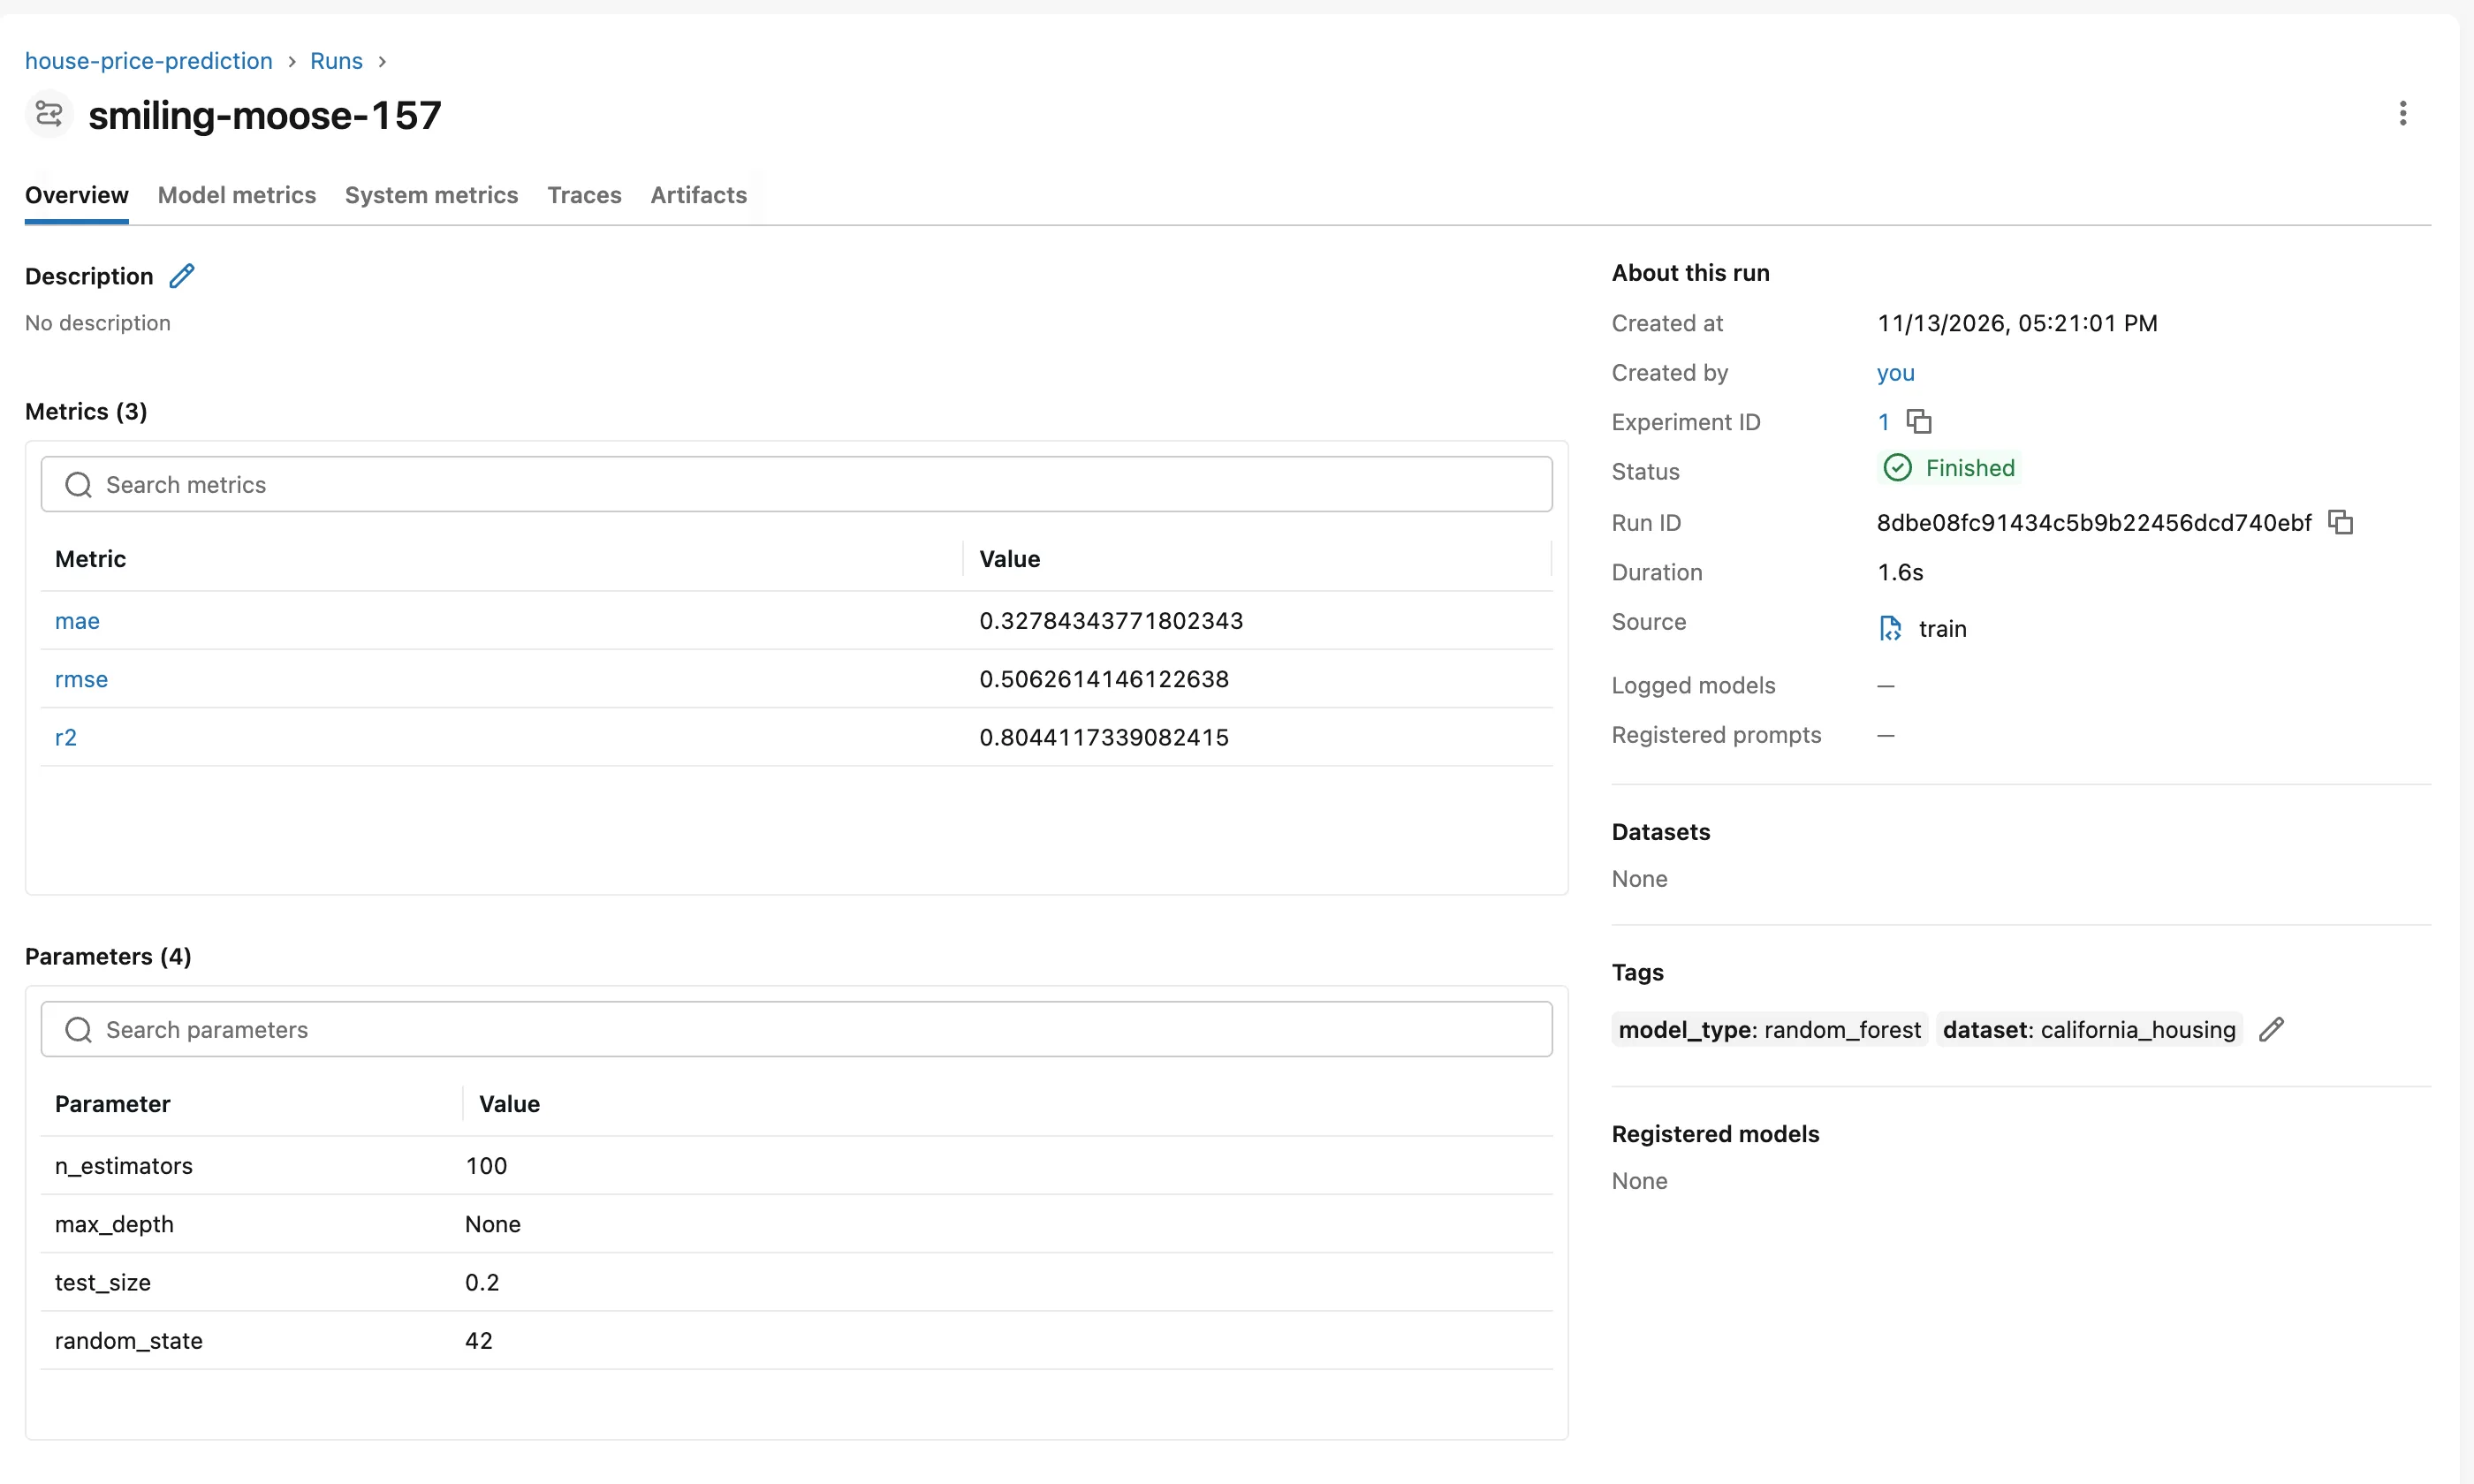
- Metrics and Parameters: the scores and settings your code logged, with a search box each.
- About this run: who ran it, when, how long it took, its status and its Run ID, the unique name MLflow uses for it.
- Tags: the labels your code set. MLflow's own system tags, which start with
mlflow., aren't shown here. - Description: a note you can write with the pencil icon.
Step 6: See the Charts and Files
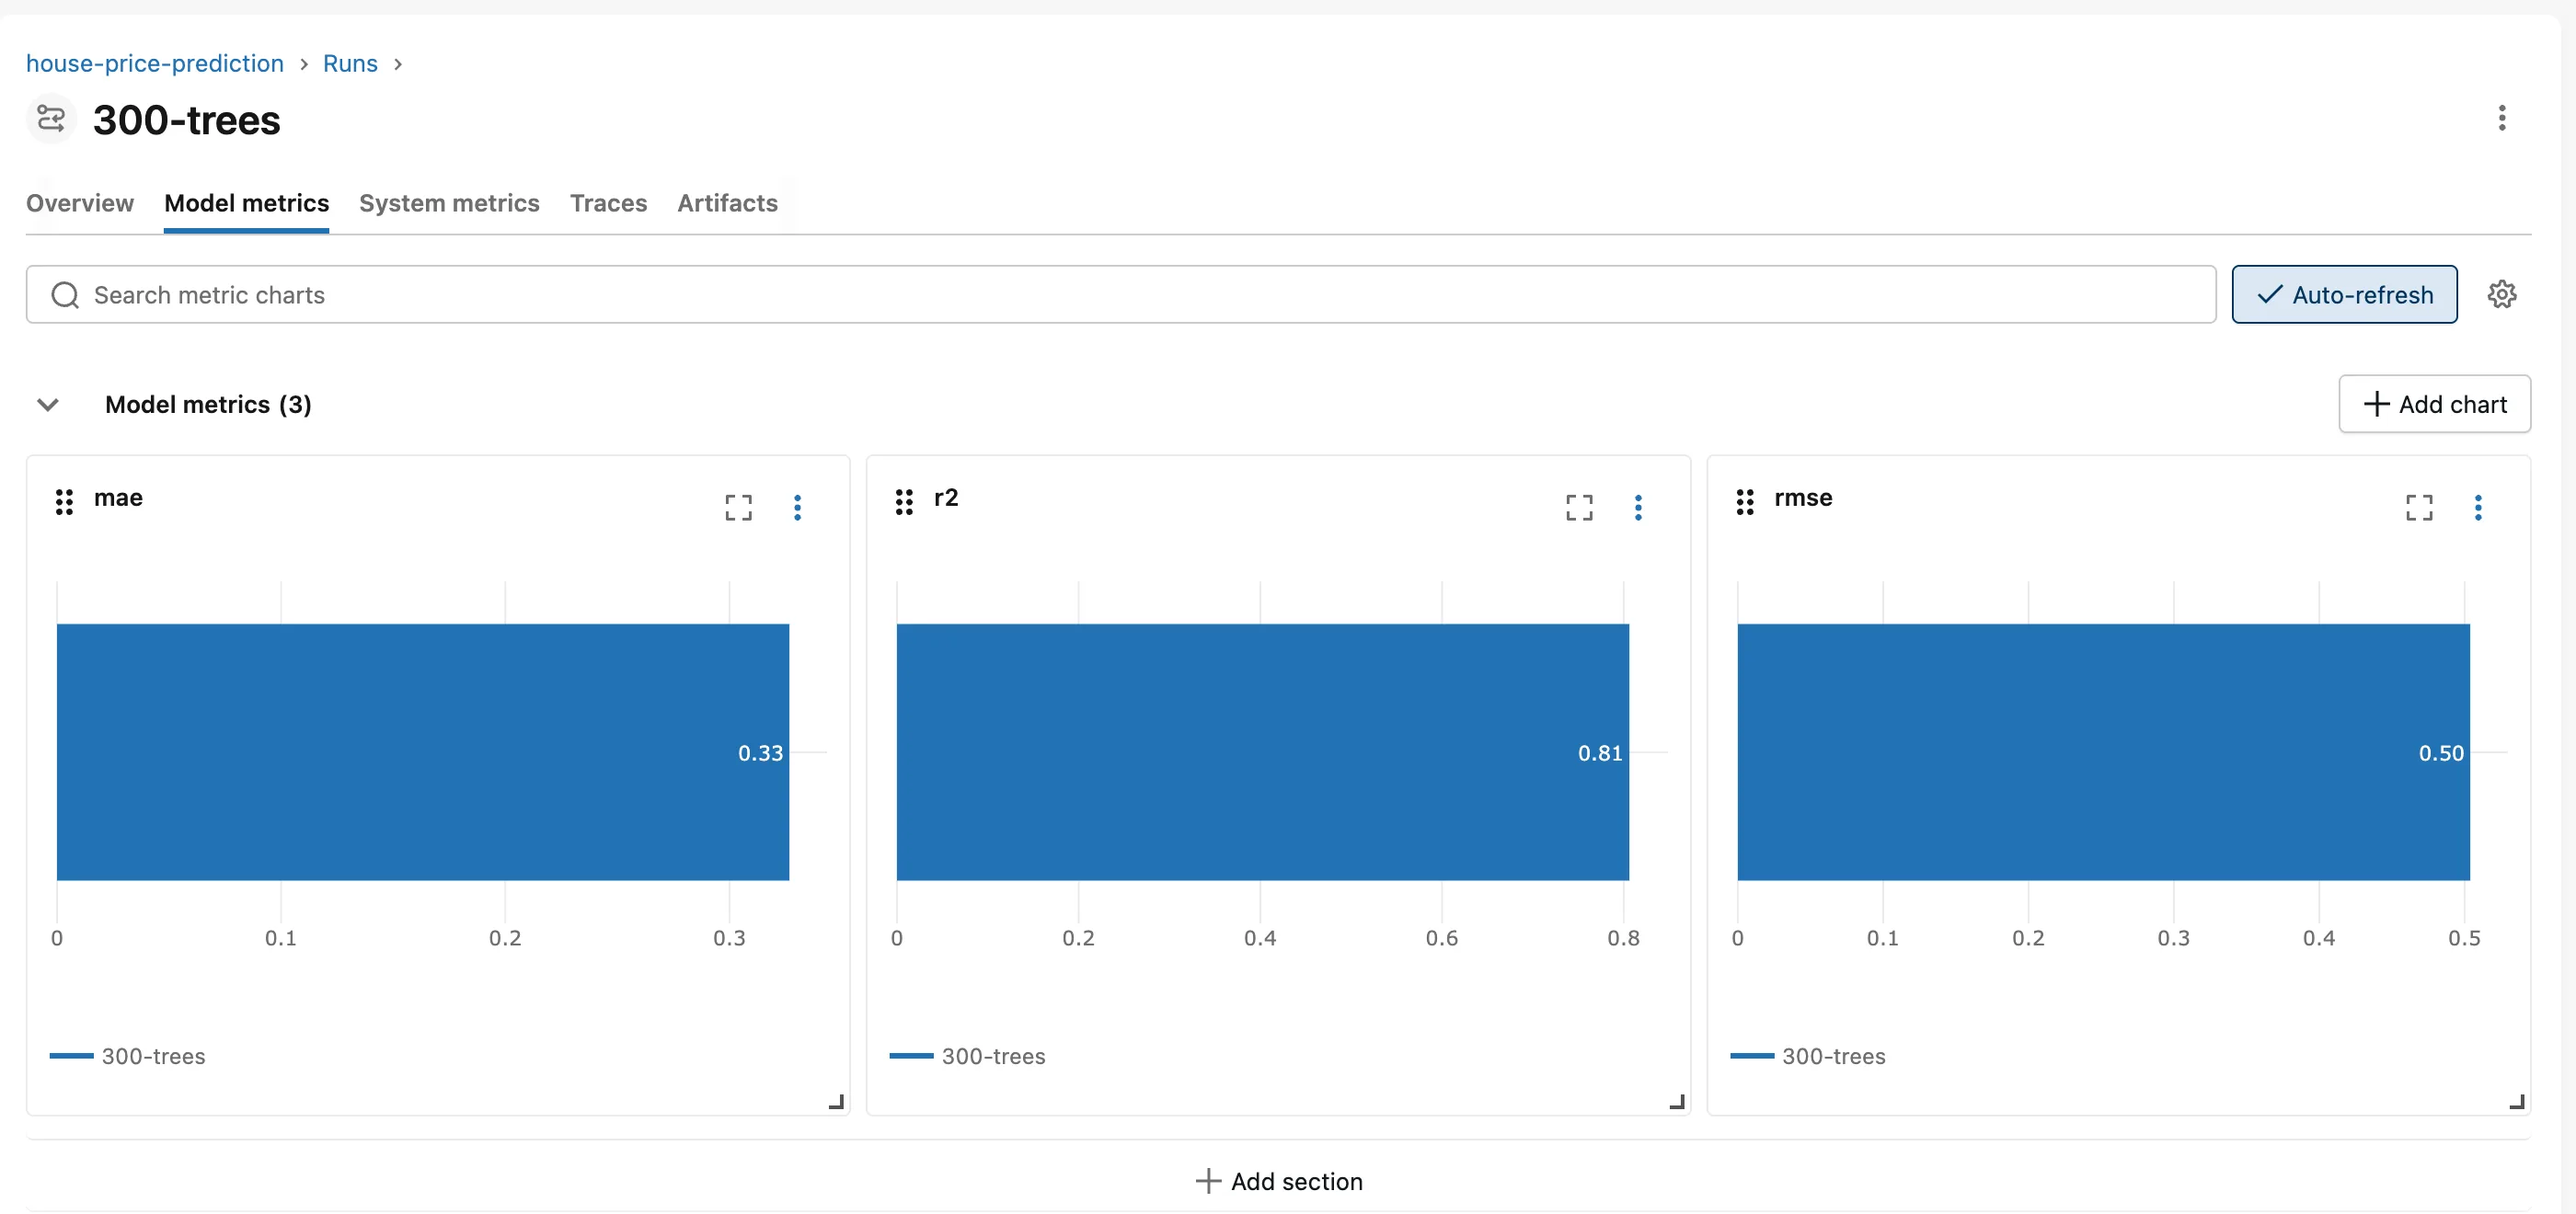
The Model metrics tab draws every metric. A metric logged once is a bar; one logged at many steps is a line:
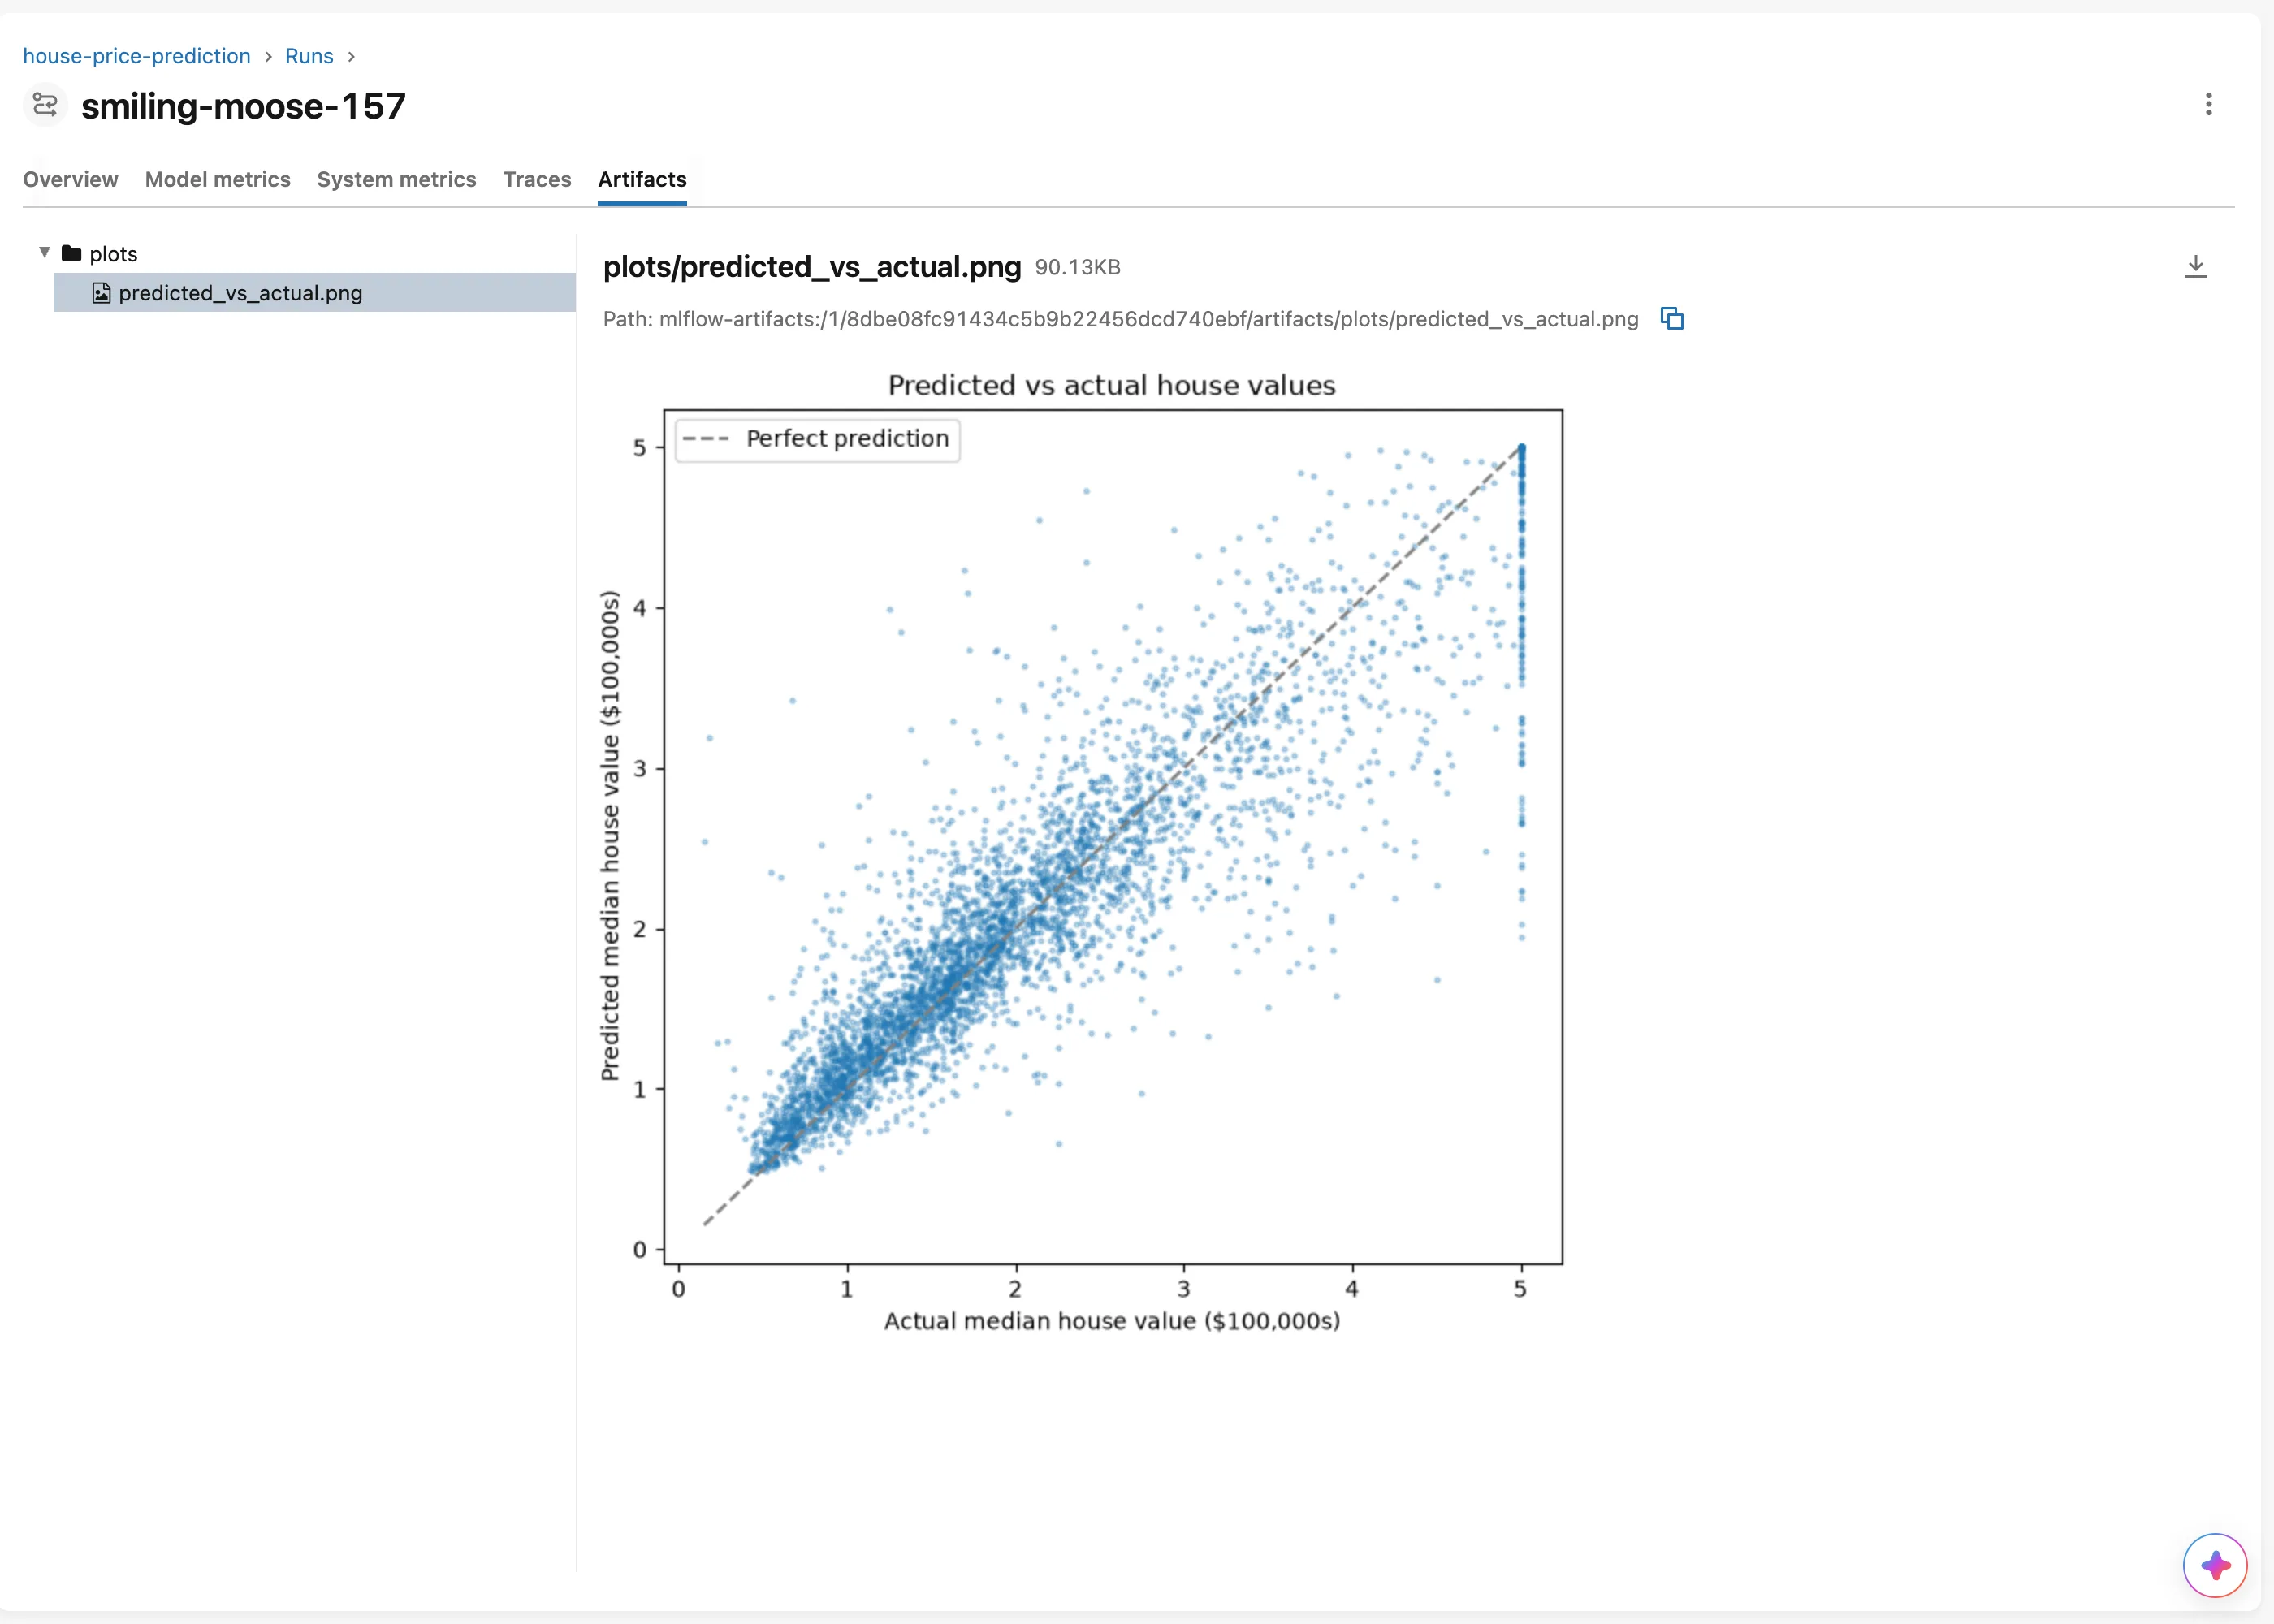
The Artifacts tab lists the files the run logged, with a preview for images and text:
Common Mistakes
| Mistake | What happens | Do this instead |
|---|---|---|
| Staying in GenAI mode for model training | The experiment opens on Traces and Evaluation pages, and runs are called "Evaluation runs" | Switch to Model training |
| Looking for parameters in the runs table | They're hidden until you add the columns | Columns, or Show more columns |
Looking for mlflow.-prefixed tags on the run page | The page shows only your own tags | Read them through the API or the database |
Troubleshooting
| Symptom | Likely cause | Fix |
|---|---|---|
| The page doesn't load | The server isn't running, or isn't ready yet | Start it and wait for Application startup complete |
| Your experiment isn't listed | Your code logged to another tracking URI | How to Set the MLflow Tracking URI in Python |
| "Access to localhost was denied" on a Mac | You opened port 5000, which belongs to AirPlay | Fixed: "Access to localhost was denied" HTTP ERROR 403 When You Open the MLflow UI on a Mac |
FAQ
Does the UI need the internet?
No. The UI is served by your own tracking server.
What's the GenAI view for?
Tracing, evaluating and versioning prompts for apps built on large language models. A later series covers it.
Can I change the theme?
Yes, on the Settings page at the bottom of the sidebar.
Conclusion
The UI opened at http://127.0.0.1:8080 in GenAI mode; one click on Model training and one on the Assistant's X gave the model training view. From Experiments to the Runs table to a run's Overview, Model metrics and Artifacts tabs, every setting, score and file the code logged was there.
Additional Resources
- MLflow Tracking UI — MLflow's documentation of the UI.
- Search Runs — the syntax of the runs search box.
