How to Log SHAP Explanations with mlflow.models.evaluate

Metrics say how well a model does; they don't say why. SHAP values explain each prediction column by column: how much each input pushed it up or down. mlflow.models.evaluate computes them and logs three plots by itself, as soon as the shap package is installed. This guide installs it, evaluates a diabetes model and reads the plots, with real output and UI from MLflow 3.18.0.
How SHAP Fits into an Evaluation
The reference for mlflow.models.evaluate: "For both the "regressor" and "classifier" model types, the default evaluator generates model summary plots and feature importance plots using SHAP." It's on by default, through the option log_model_explainability, but shap isn't one of mlflow's requirements, so without it MLflow skips the step with a warning. The limits it lists: "all feature values must be numeric, and each feature column must only contain scalar values."
Prerequisites
- An MLflow tracking server at
http://127.0.0.1:8080. MLflow's tracking server guide shows how to start one. mlflowandscikit-learnin your project, for example withuv add mlflow scikit-learn pandas.
Step 1: Install shap
In your project:
uv add shap
uv adds shap 0.54.1 and two small packages it uses, slicer and tqdm. How to Add a Package to a Python Project with uv explains the command.
Step 2: Evaluate a Model
The example fits a linear regression to scikit-learn's diabetes data, which predicts how far each patient's disease progressed after a year from ten measurements: age, sex, body mass index (bmi), blood pressure (bp) and six blood serum values, s1 to s6. It logs the model, evaluates it on the test rows, and prints the names of the artifacts:
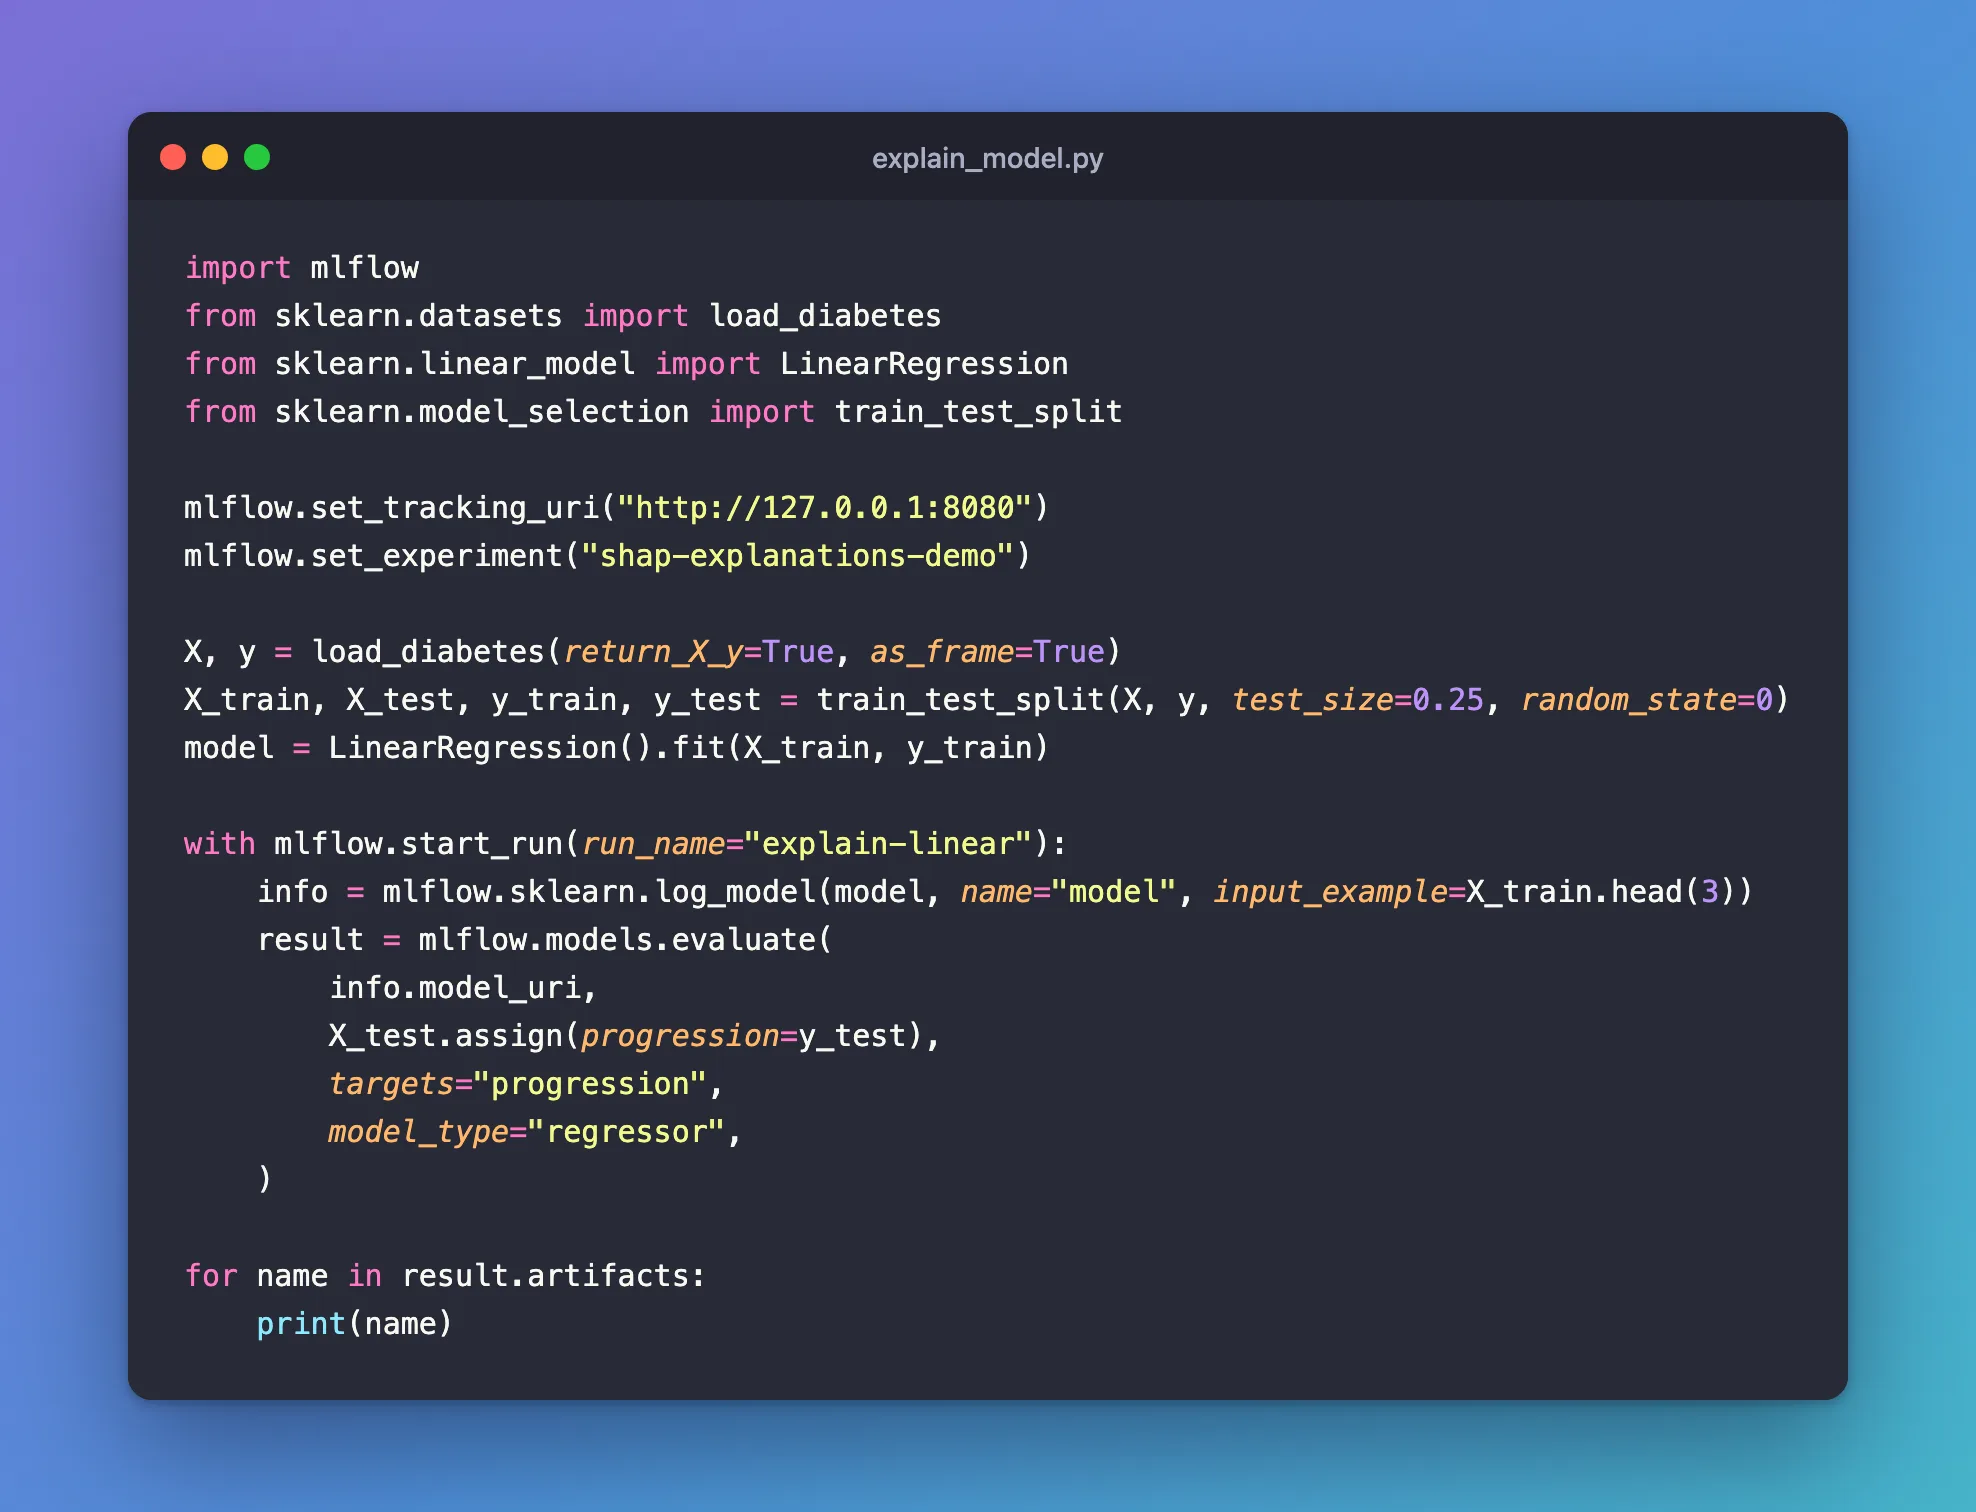
import mlflow
from sklearn.datasets import load_diabetes
from sklearn.linear_model import LinearRegression
from sklearn.model_selection import train_test_split

mlflow.set_tracking_uri("http://127.0.0.1:8080")
mlflow.set_experiment("shap-explanations-demo")

X, y = load_diabetes(return_X_y=True, as_frame=True)
X_train, X_test, y_train, y_test = train_test_split(X, y, test_size=0.25, random_state=0)
model = LinearRegression().fit(X_train, y_train)

with mlflow.start_run(run_name="explain-linear"):
    info = mlflow.sklearn.log_model(model, name="model", input_example=X_train.head(3))
    result = mlflow.models.evaluate(
        info.model_uri,
        X_test.assign(progression=y_test),
        targets="progression",
        model_type="regressor",
    )

for name in result.artifacts:
    print(name)
uv run python explain_model.py
2026/11/21 17:55:57 INFO mlflow.models.evaluation.default_evaluator: Testing metrics on first row...
Background dataset has 111 samples but max_samples=100. Subsampling to 100 samples for SHAP value computation. To use all samples, set max_samples=111 when initializing the masker.
2026/11/21 17:55:57 INFO mlflow.models.evaluation.evaluators.shap: Shap explainer ExactExplainer is used.
🏃 View run explain-linear at: http://127.0.0.1:8080/#/experiments/15/runs/7ff3e0426fc143dc8878ce5d0d8ff413
🧪 View experiment at: http://127.0.0.1:8080/#/experiments/15
shap_beeswarm_plot
shap_summary_plot
shap_feature_importance_plot
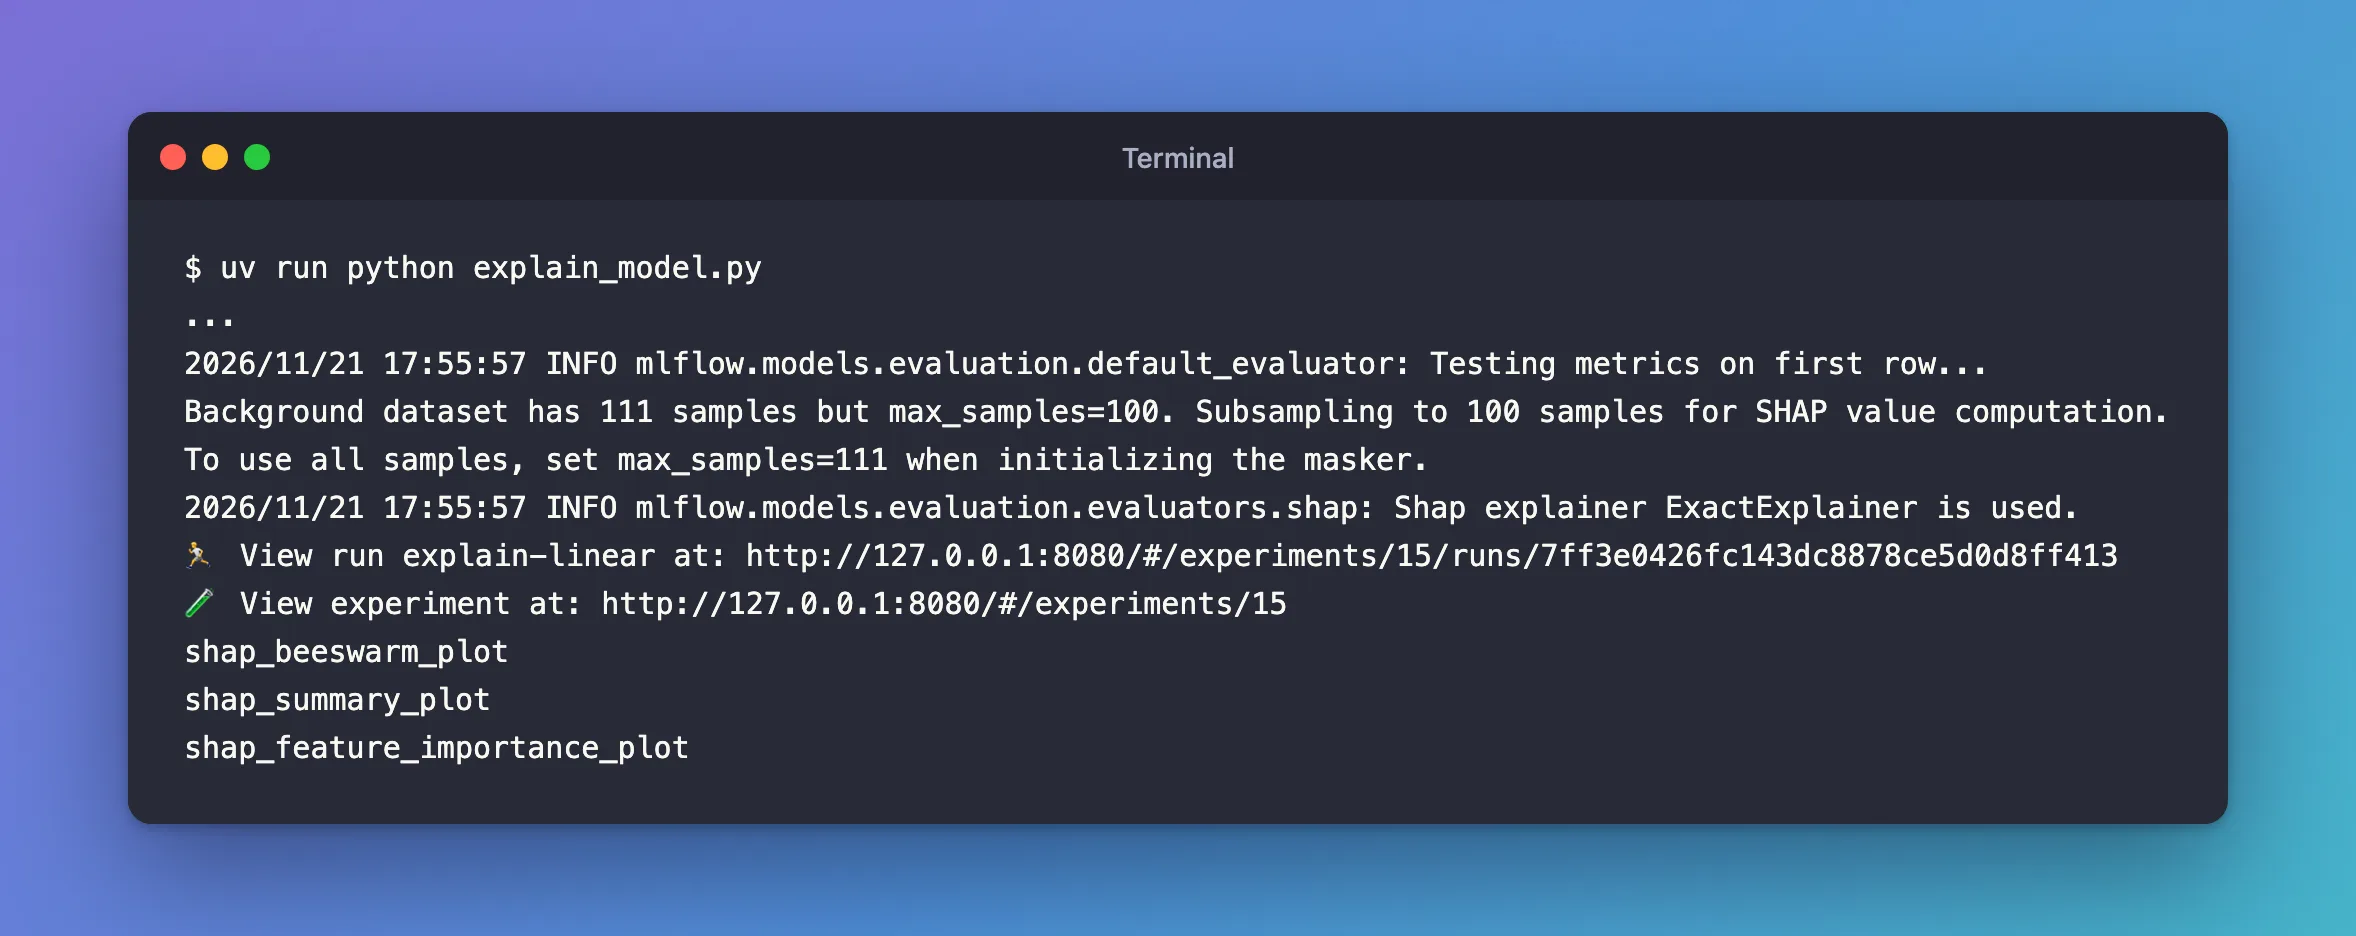
- No SHAP warning, and three artifacts, where a regressor without
shapgets none. Shap explainer ExactExplainer is used: MLflow letsshappick its algorithm.Background dataset has 111 samples but max_samples=100:shap's note that it uses 100 of the 111 test rows as its background data. MLflow's own option,explainability_nsamples, is "The number of sample rows to use for computing model explainability insights. Default value is 2000."
With shap installed, a Downloading artifacts progress bar, 7/7, also appeared before the evaluation started.
Step 3: Read the Feature Importance Plot
shap_feature_importance_plot.png ranks the columns by their average effect on the predictions, the mean absolute SHAP value:
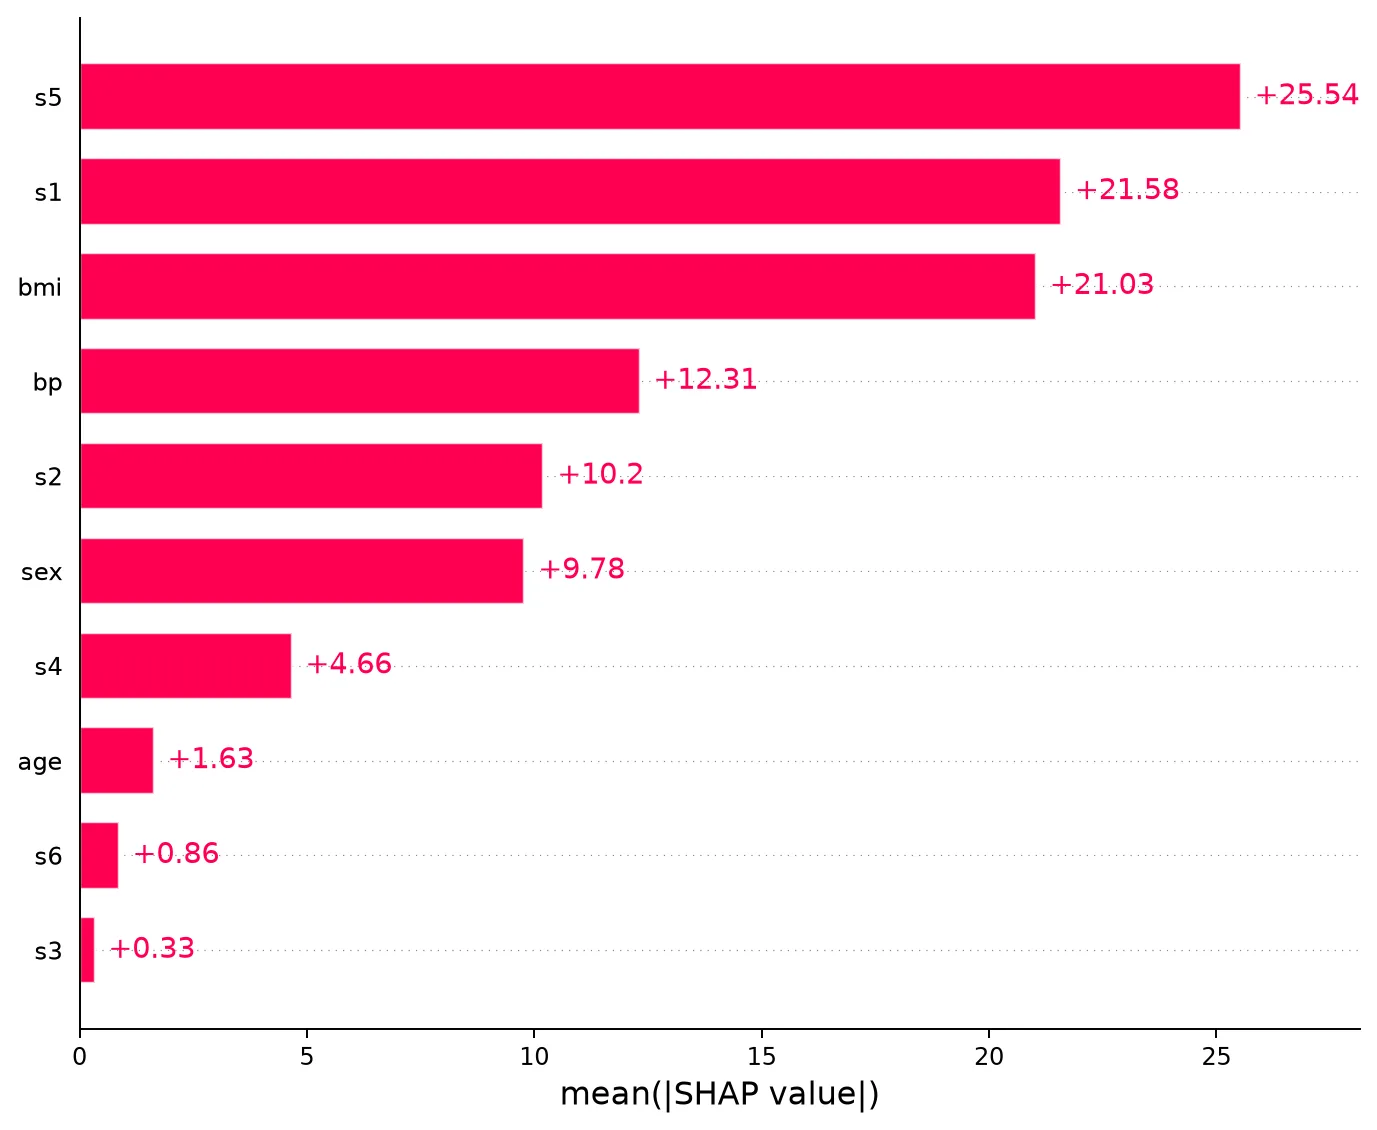
s5, s1 and bmi move a prediction by about 21 to 26 points on average; age, s6 and s3 barely move it at all.
Step 4: Read the Beeswarm Plot
Open the run, explain-linear, go to Artifacts and click shap_beeswarm_plot.png. Each dot is one test patient; its position is how much that column pushed the prediction, and its colour is the column's value, red high and blue low:
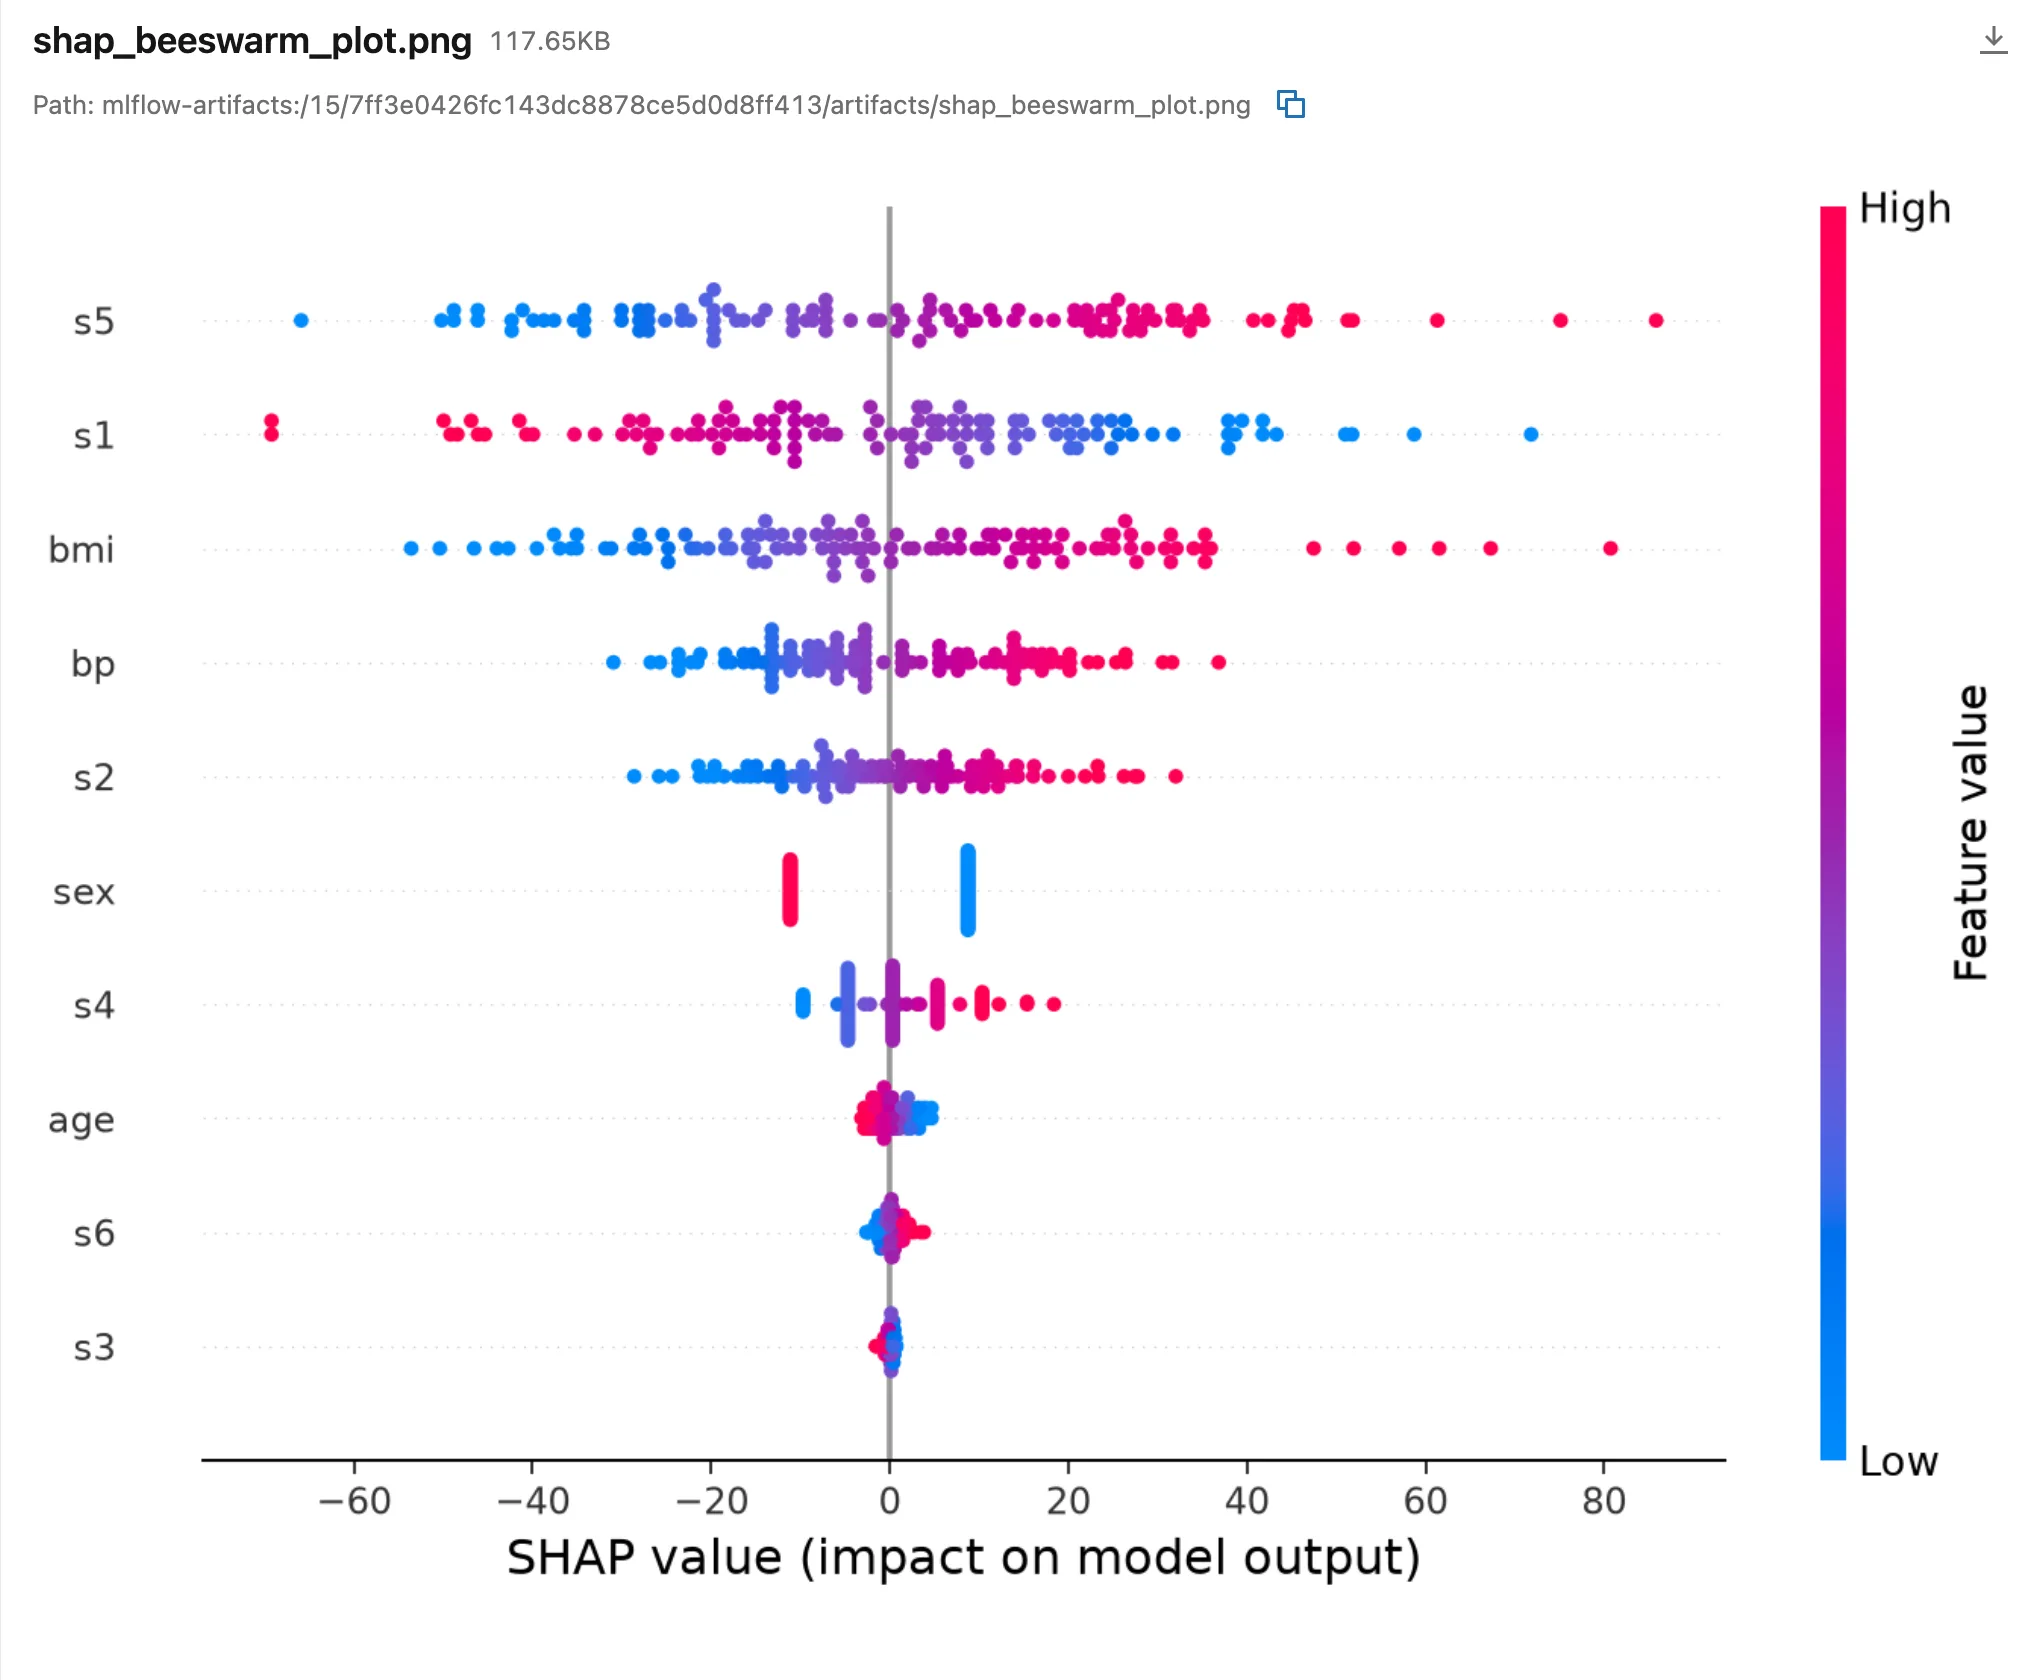
s5andbmi: red dots on the right, so high values push the prediction up.s1: red dots on the left, so in this model a high value pushes it down.sex: two tight groups, one per value, as a column with two values gives.
The third file, shap_summary_plot.png, shows the same SHAP values in a slightly different layout.
Common Mistakes
| Mistake | What happens | Do this instead |
|---|---|---|
| Expecting explanations for data with columns of words | MLflow's check fails before SHAP runs | Turn explainability off for that model: Fixed: Cannot interpret StringDtype |
| Reading SHAP values as causes | They describe the model, not the world | Read them as "what this model relies on" |
Troubleshooting
| Symptom | Likely cause | Fix |
|---|---|---|
SHAP or matplotlib package is not installed | No shap in the project | uv add shap: Fixed: SHAP or matplotlib package is not installed |
FutureWarning: The NumPy global RNG was seeded by calling np.random.seed | shap's own summary_plot, called by MLflow, after shap's PermutationExplainer seeded NumPy's global generator (shap issue #4607); it appeared when a classifier was explained | Nothing to change in your code |
FAQ
Does every model get the same explainer?
No: MLflow lets shap choose. This linear regression got ExactExplainer; the tumour classifier of the SHAP fixes post got PermutationExplainer. The option explainability_algorithm picks one yourself.
Can I turn the explanations off again?
Yes: evaluator_config={"log_model_explainability": False} skips them, with shap installed or not.
Conclusion
With shap installed, mlflow.models.evaluate logged three SHAP plots for the diabetes model: s5, s1 and bmi move its predictions most, high s5 and bmi push them up, and high s1 pushes them down.
Additional Resources
- mlflow.models.evaluate — the SHAP options of
evaluator_config. - SHAP documentation — what SHAP values are.
