How to Log a Table in MLflow with log_table

Some results of a run are tables: predictions next to the real values, scores per group, the importance of each feature. mlflow.log_table() saves a pandas DataFrame or a dictionary with the run as a table that the MLflow UI shows as rows and columns and can compare across runs. This guide logs a small predictions table from two models, with real output from MLflow 3.18.0.
Syntax
mlflow.log_table(<data>, artifact_file="<name>.json")
| Part | What it means |
|---|---|
<data> | A pandas DataFrame, or a dictionary of columns such as {"house": [...], "price": [...]} |
artifact_file | The file's name in the run, and optionally a folder: "evaluation/predictions.json". It must end in .json or .parquet |
| The current run | The table goes to the active run. run_id= sends it to another one |
MLflow writes the table as a file in the run's artifacts and marks it as a table, which is what lets the UI show and compare it. If the run already has a table with that name, the new rows are added to it: "If the artifact_file already exists in the run, the data would be appended to the existing artifact_file."
Prerequisites
- An MLflow tracking server at
http://127.0.0.1:8080. MLflow's tracking server guide shows how to start one. For another address, change it in the script.
Step 1: Log a Table from Two Runs
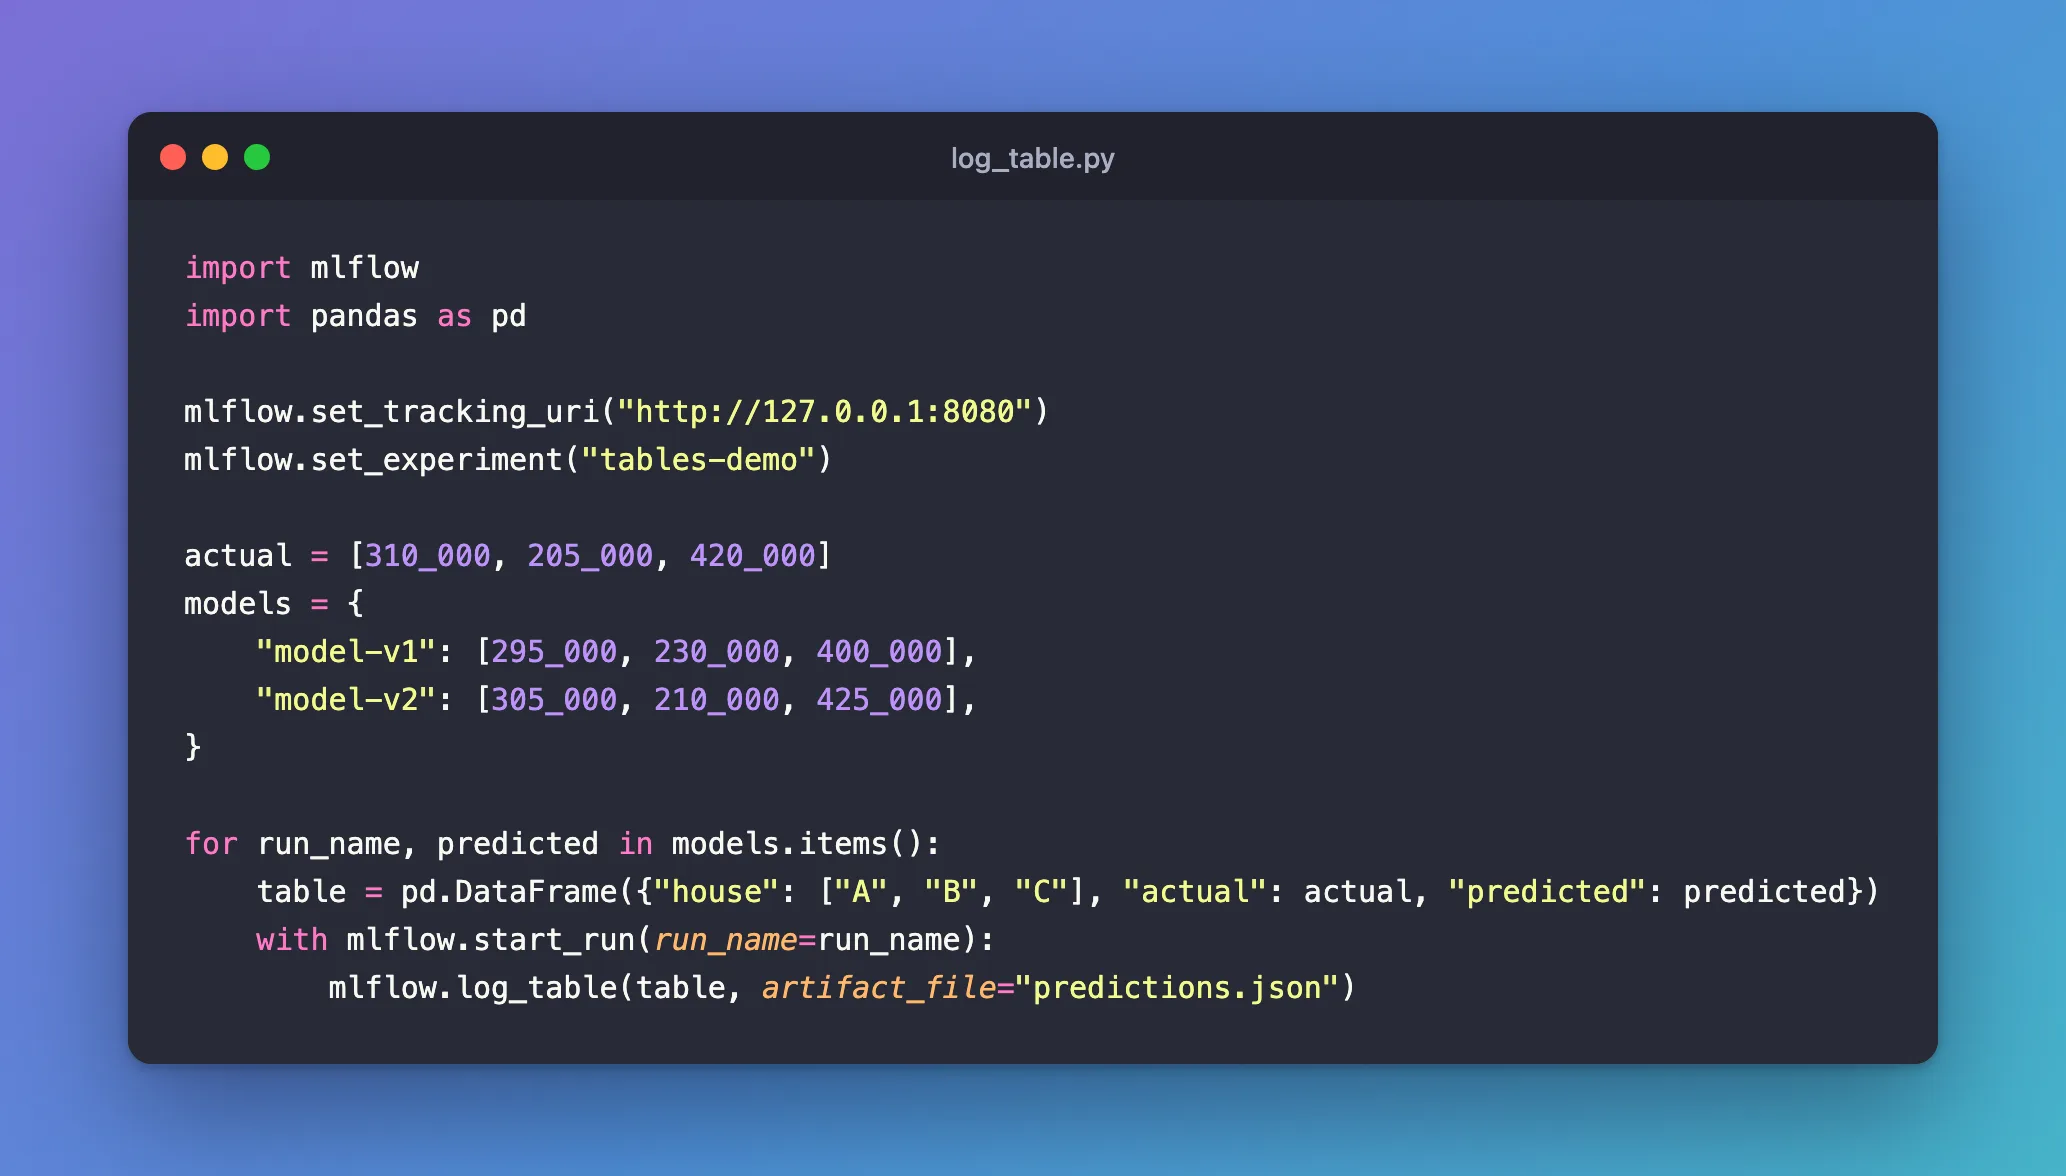
The example is three houses with their real prices, and the prices two versions of a model predicted. Each version gets its own run, with the same table name, so the two can be compared later. Create log_table.py:
import mlflow
import pandas as pd

mlflow.set_tracking_uri("http://127.0.0.1:8080")
mlflow.set_experiment("tables-demo")

actual = [310_000, 205_000, 420_000]
models = {
    "model-v1": [295_000, 230_000, 400_000],
    "model-v2": [305_000, 210_000, 425_000],
}

for run_name, predicted in models.items():
    table = pd.DataFrame({"house": ["A", "B", "C"], "actual": actual, "predicted": predicted})
    with mlflow.start_run(run_name=run_name):
        mlflow.log_table(table, artifact_file="predictions.json")
| Line | What it does |
|---|---|
models | Each model's predictions for houses A, B and C |
pd.DataFrame({...}) | One row per house: its name, real price and predicted price |
mlflow.log_table(table, artifact_file="predictions.json") | Saves the table with the run as predictions.json |
uv run python log_table.py
2026/11/19 16:26:43 INFO mlflow.tracking.fluent: Experiment with name 'tables-demo' does not exist. Creating a new experiment.
🏃 View run model-v1 at: http://127.0.0.1:8080/#/experiments/8/runs/ea0cb20b1c1f43c08099dc69835c2203
🧪 View experiment at: http://127.0.0.1:8080/#/experiments/8
🏃 View run model-v2 at: http://127.0.0.1:8080/#/experiments/8/runs/cf0ed2dc98804e6aa07eabc3a085ae79
🧪 View experiment at: http://127.0.0.1:8080/#/experiments/8
Step 2: See the Table in the UI
Open the model-v1 run and click Artifacts, then predictions.json:
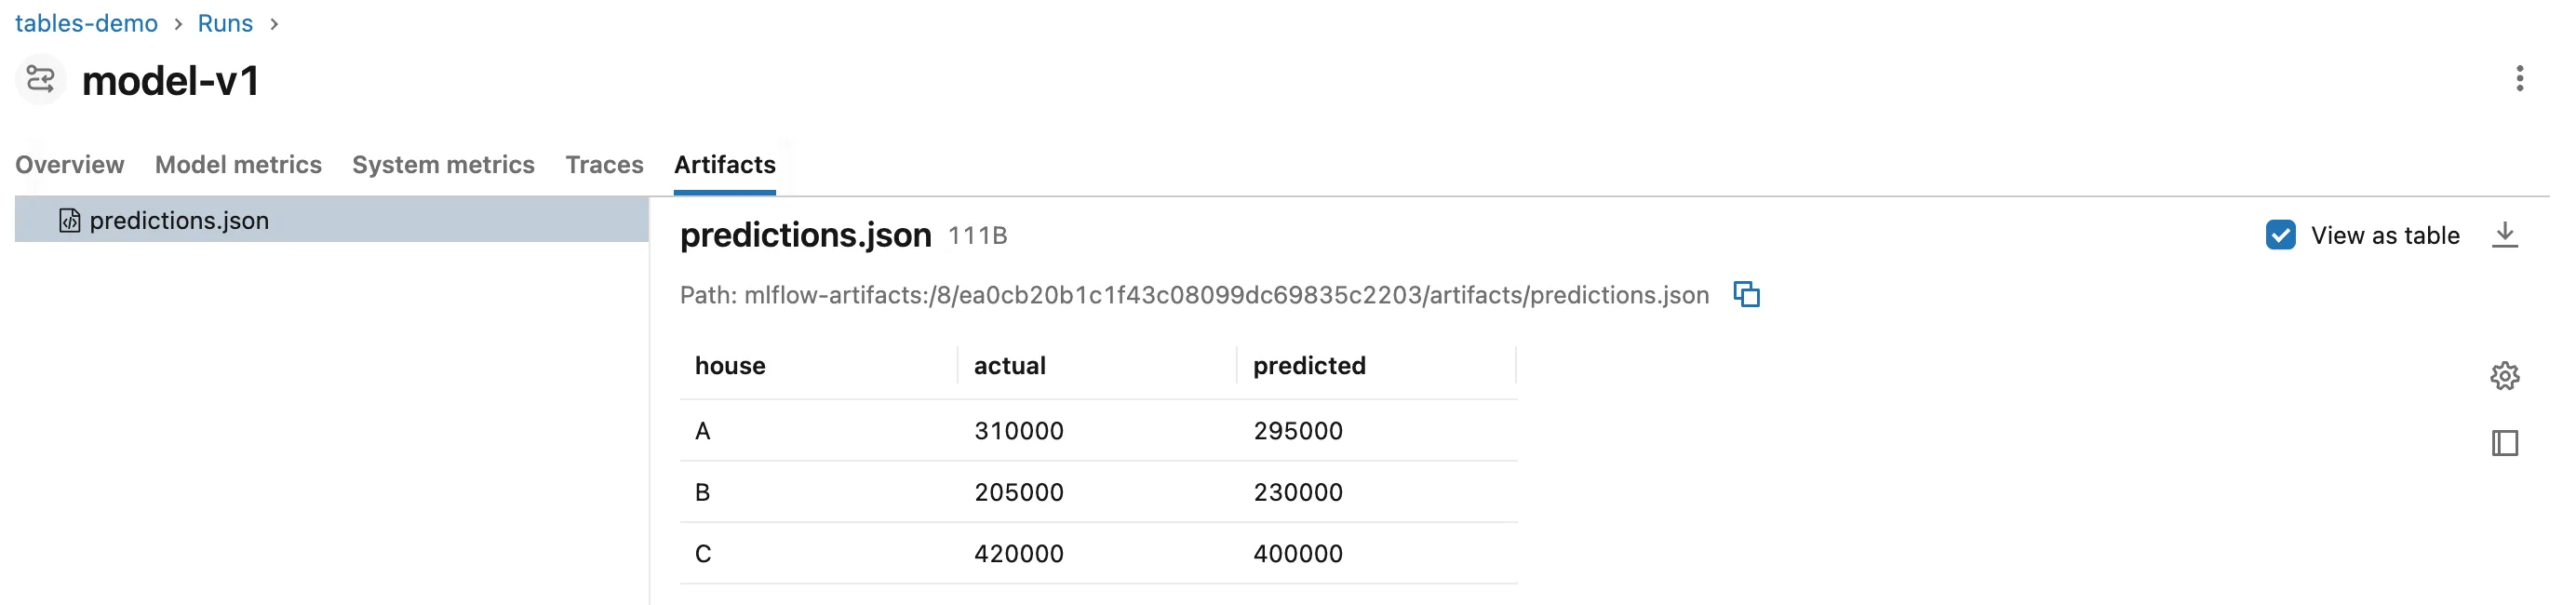
Because MLflow knows this file is a table, the preview has a View as table box, ticked: rows and columns, like the DataFrame you logged. Untick it to see the file itself. Its contents:
{"columns":["house","actual","predicted"],"data":[["A",310000,295000],["B",205000,230000],["C",420000,400000]]}
The column names come first, then one list per row. The DataFrame's row numbers aren't saved. MLflow also adds a tag to the run, mlflow.loggedArtifacts, with the value [{"path": "predictions.json", "type": "table"}]; that's how the UI knows which files are tables.
Both runs logged predictions.json, so the UI can also put them side by side: How to Compare a Logged Table Across Runs in the MLflow UI.
Common Mistakes
| Mistake | What happens | Do this instead |
|---|---|---|
A file name ending in .csv | ValueError: Invalid artifact file path 't.csv'. Please ensure the file you are trying to log as a table has a file name with either '.json' or '.parquet' extension. | End it in .json or .parquet; for a CSV file, use log_artifact |
Calling log_table twice with the same name in one run | The second call adds its rows to the first: a table of 2 rows plus 1 row becomes 3 rows | Log each table once, or give each call its own name |
| Using different names for the same table in different runs | The runs can't be compared side by side | Use one name, such as predictions.json, in every run |
| Expecting the DataFrame's row labels to be saved | They're dropped | Turn them into a column first with table.reset_index() |
Troubleshooting
| Symptom | Likely cause | Fix |
|---|---|---|
| The preview has no View as table box | The file was logged with log_artifact, not log_table | Log it with log_table |
pytest shows Pandas4Warning: For backward compatibility, 'str' dtypes are included by select_dtypes | MLflow's own check for picture columns, with pandas 3 | Fixed: Pandas4Warning in MLflow log_table |
FAQ
Should I use .json or .parquet?
.json is readable in the UI's preview and in any text editor. .parquet is a compact binary format that suits large tables; pandas reads it with pyarrow, which MLflow installs.
Can a table hold pictures?
Yes. A column of images, such as PIL images, is saved as separate image files, and the table stores their paths. A column must hold only images or no images at all.
How do I read the table back in Python?
With mlflow.load_table(), which can also stack the same table from several runs: How to Load a Logged Table from MLflow with load_table.
Conclusion
mlflow.log_table(table, artifact_file="predictions.json") saved a three-row DataFrame with each of two runs as a JSON table: column names first, then one list per row. The UI shows it with View as table, the run gets a tag that marks it as a table, and a second call with the same name adds rows rather than replacing them.
Additional Resources
- mlflow.log_table — the function's reference.
- mlflow.load_table — reading tables back.
