How to Log a Matplotlib Figure to MLflow

Charts explain a run better than numbers: a loss curve, predicted against actual values, a confusion matrix. mlflow.log_figure() saves a Matplotlib figure straight into the run, with no temporary file to create or clean up. This guide logs a chart as PNG and SVG, logs one from pyplot without leaking memory, and finds them in the MLflow UI.
Syntax
mlflow.log_figure(<figure>, "<folder>/<file name>.<extension>")
| Part | What it means |
|---|---|
<figure> | The chart to save: a Matplotlib Figure. MLflow also accepts Plotly figures |
"<folder>/<file name>.<extension>" | Where to save it inside the run, such as "plots/loss.png". MLflow creates the folder, and the extension picks the format |
The figure goes into the active run's artifacts, the files a run keeps.
Prerequisites
- MLflow and Matplotlib in a uv project:
uv add mlflow matplotlib. See How to Add a Package to a Python Project with uv. - A running tracking server at
http://127.0.0.1:8080: How to Start an MLflow Tracking Server on Your Computer.
Step 1: Log a Figure
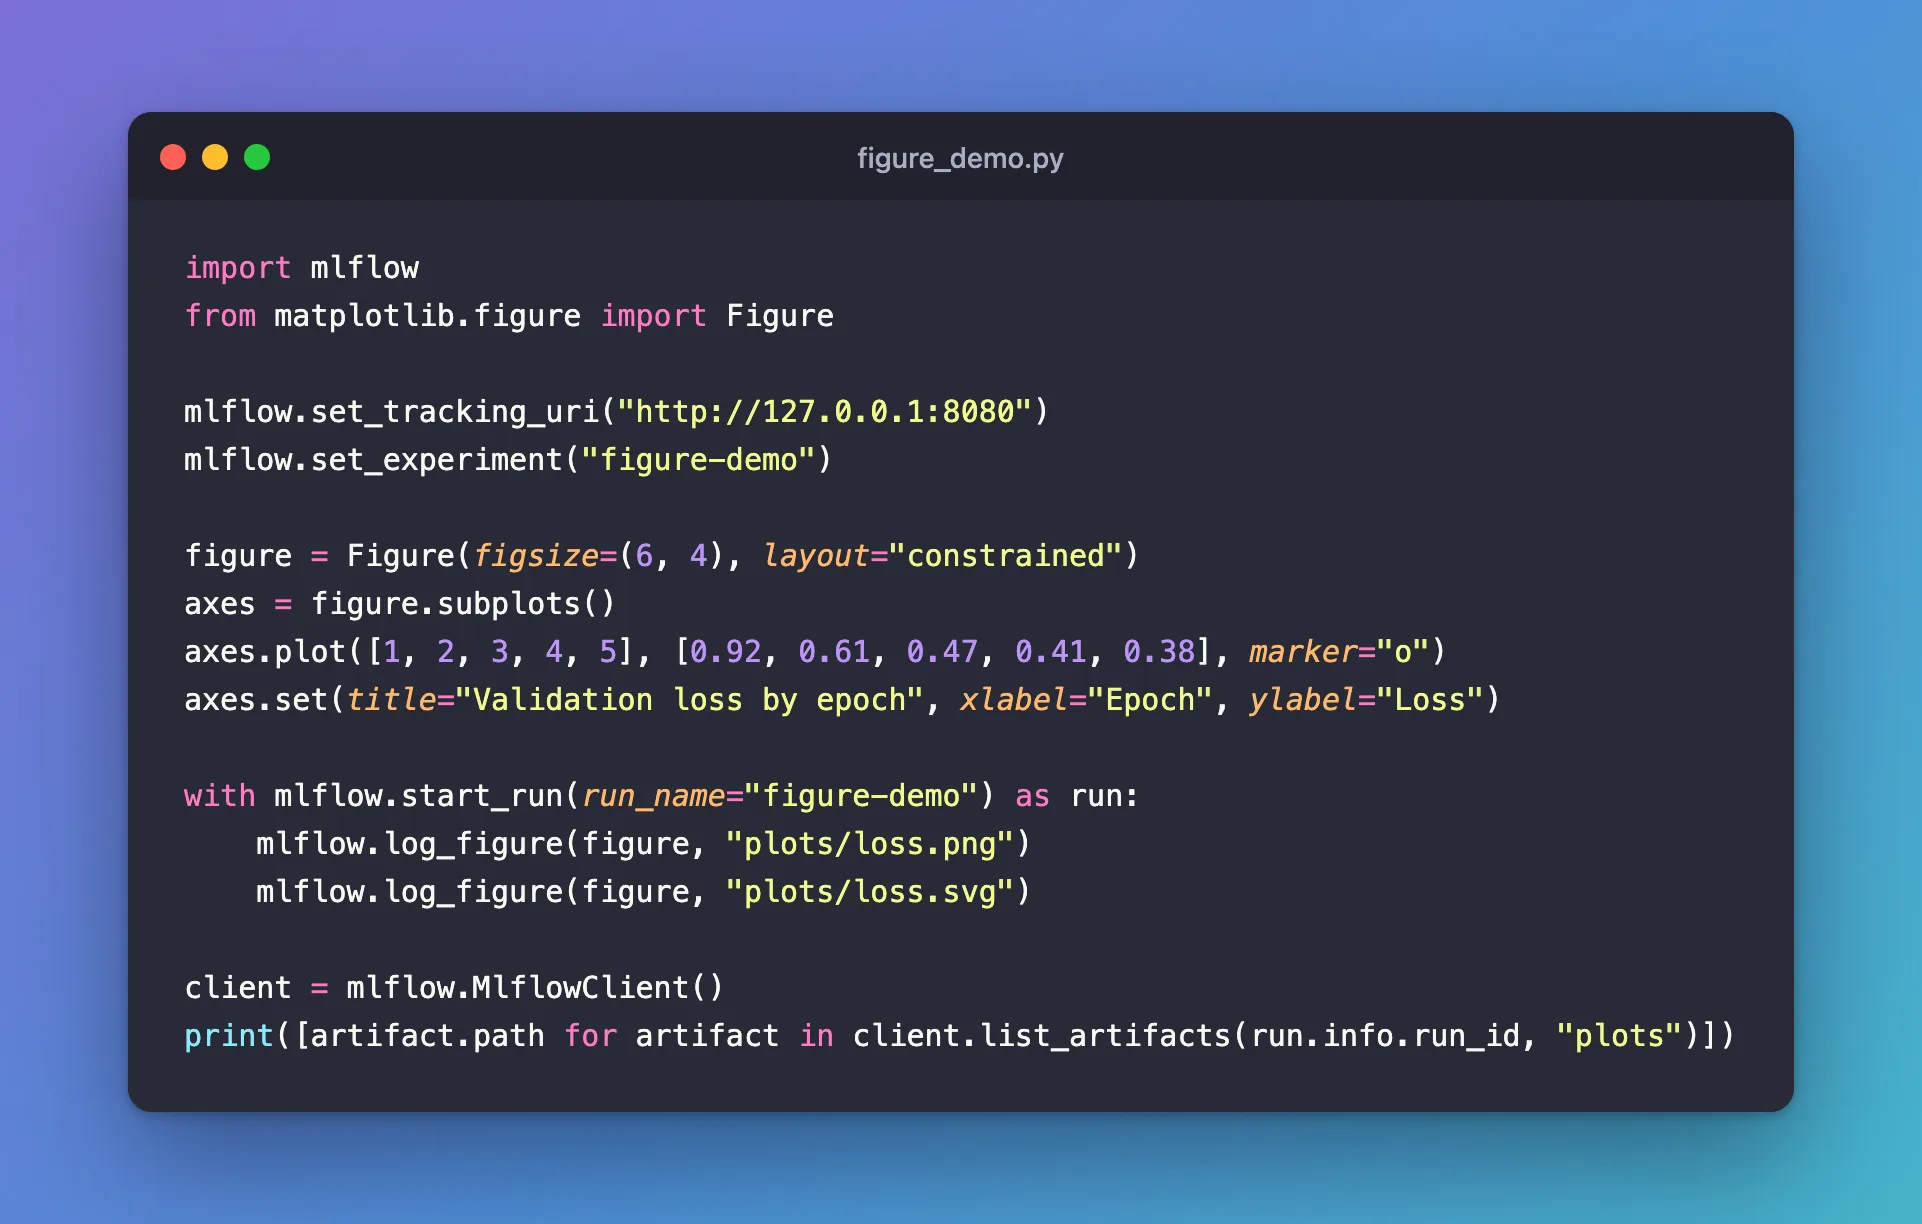
Create figure_demo.py:
import mlflow
from matplotlib.figure import Figure

mlflow.set_tracking_uri("http://127.0.0.1:8080")
mlflow.set_experiment("figure-demo")

figure = Figure(figsize=(6, 4), layout="constrained")
axes = figure.subplots()
axes.plot([1, 2, 3, 4, 5], [0.92, 0.61, 0.47, 0.41, 0.38], marker="o")
axes.set(title="Validation loss by epoch", xlabel="Epoch", ylabel="Loss")

with mlflow.start_run(run_name="figure-demo") as run:
    mlflow.log_figure(figure, "plots/loss.png")
    mlflow.log_figure(figure, "plots/loss.svg")

client = mlflow.MlflowClient()
print([artifact.path for artifact in client.list_artifacts(run.info.run_id, "plots")])
mlflow.log_figure(figure, "plots/loss.png")saves the figure inside the run at that path. The folder,plots, is created for you.- The file name's extension picks the format:
loss.pngis an image,loss.svga vector drawing that stays sharp at any size. list_artifacts(run_id, "plots")lists what's in the run'splotsfolder.
The chart's numbers are made up to keep the example short; in real training you'd plot your own values.
uv run python figure_demo.py
2026/11/13 17:08:55 INFO mlflow.tracking.fluent: Experiment with name 'figure-demo' does not exist. Creating a new experiment.
🏃 View run figure-demo at: http://127.0.0.1:8080/#/experiments/8/runs/e7ebcaa08b684d4199fcd56dc4322ce3
🧪 View experiment at: http://127.0.0.1:8080/#/experiments/8
['plots/loss.png', 'plots/loss.svg']
Step 2: See It in the UI
Open the run, click Artifacts, open plots and click loss.png:
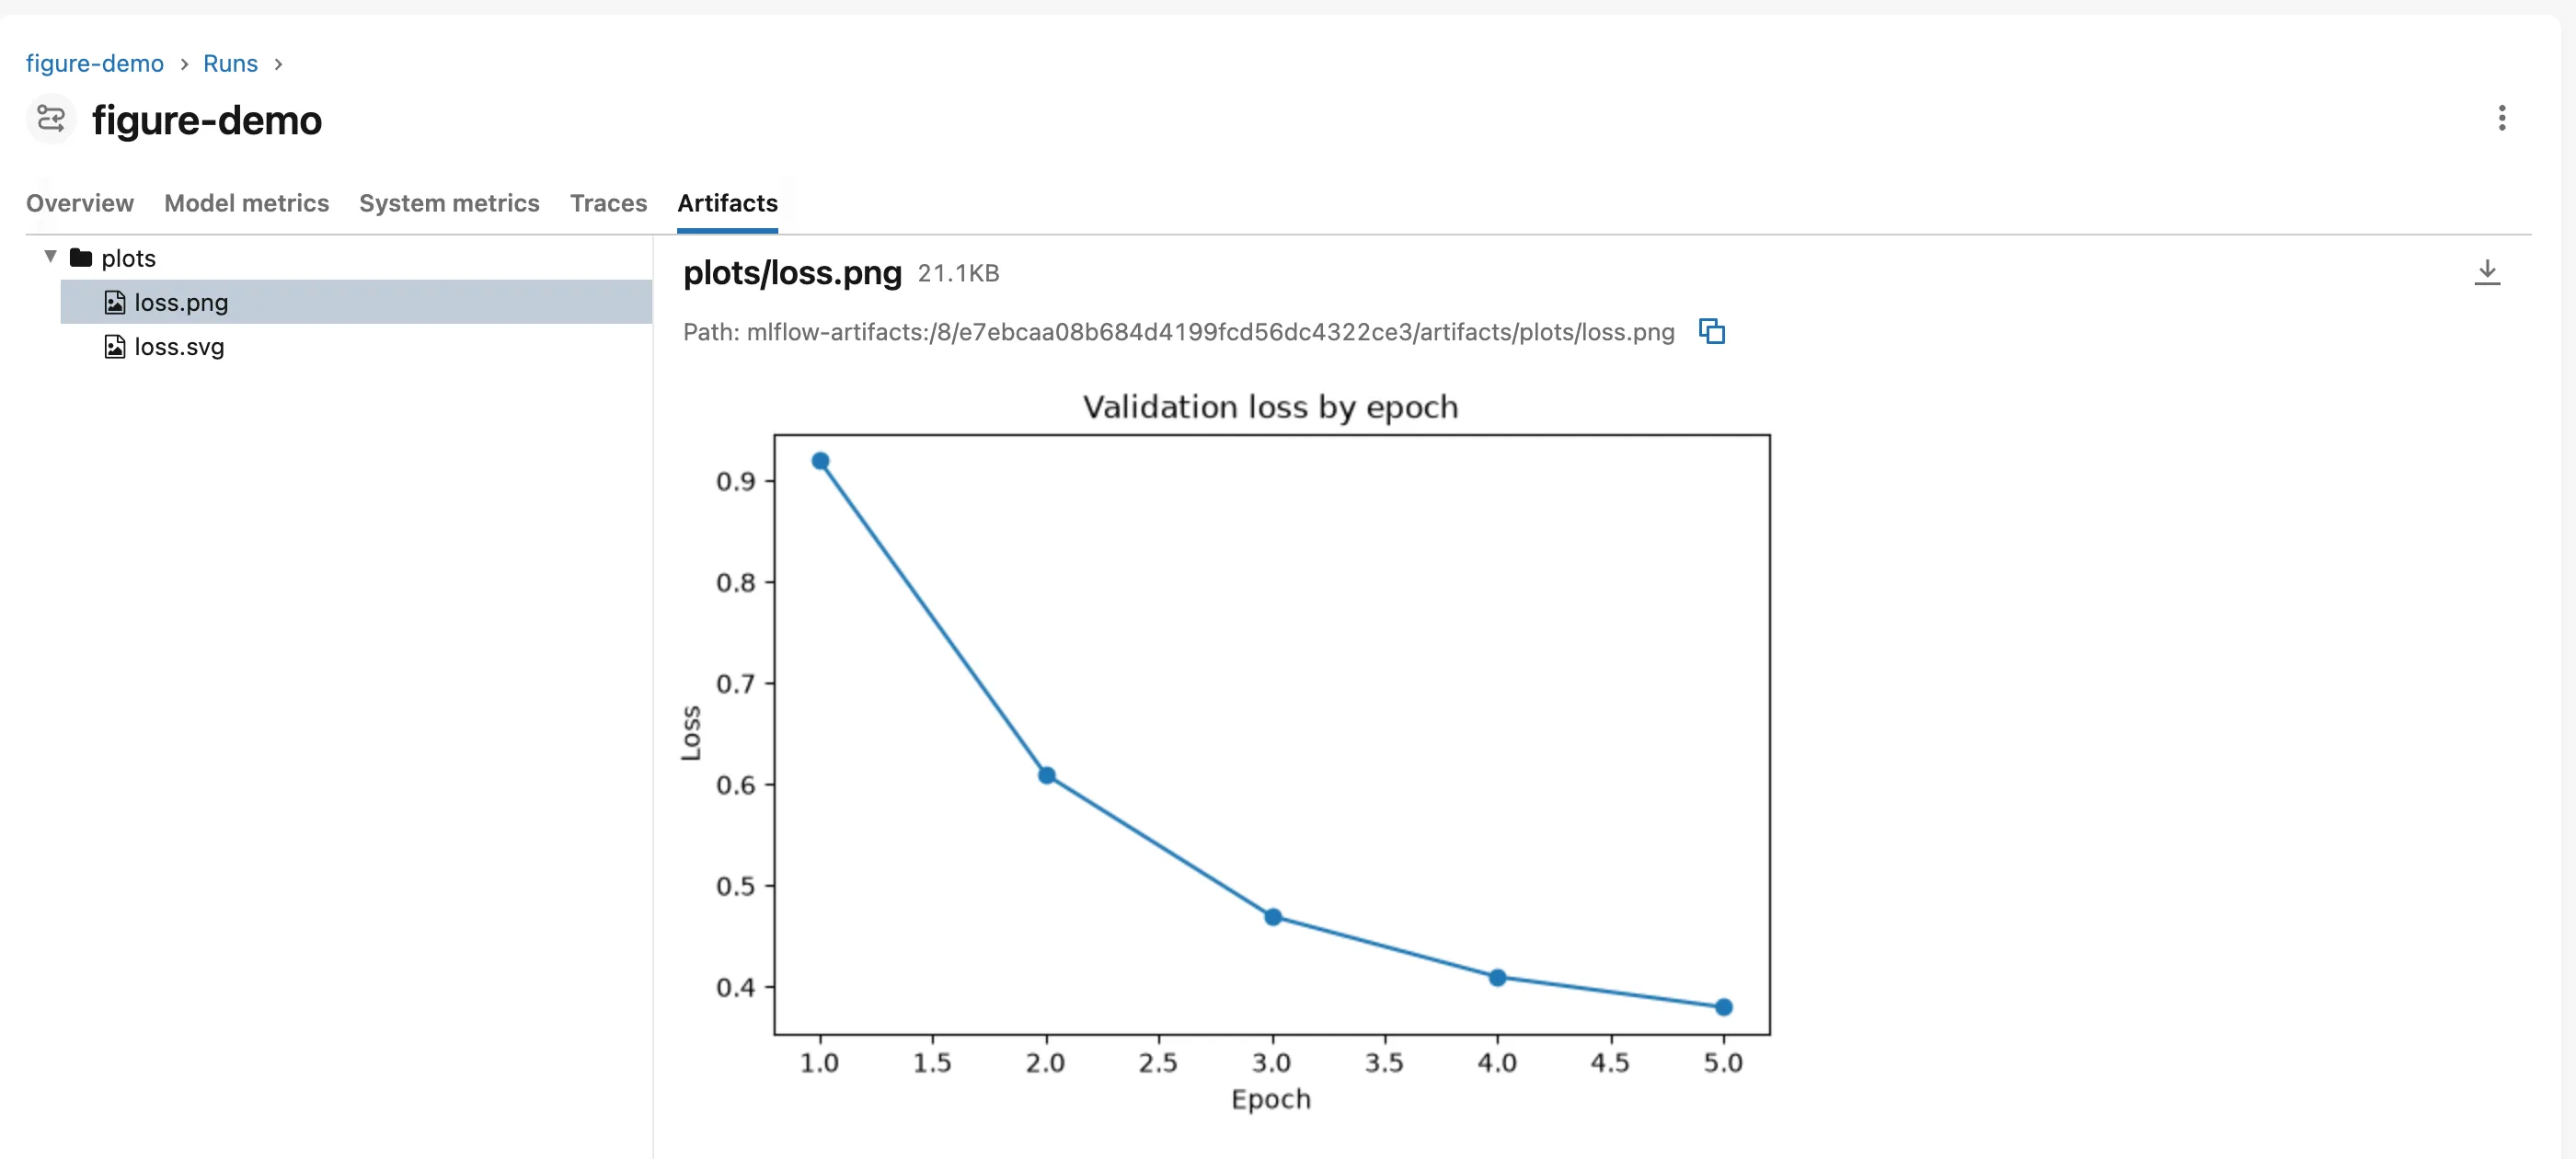
The preview shows the chart, its size and its path. The download icon saves the file.
Step 3: Log a Figure from pyplot
If your code uses matplotlib.pyplot, the call is the same, but close the figure afterwards: pyplot keeps every figure in memory until you do.
import matplotlib

matplotlib.use("Agg")
import matplotlib.pyplot as plt
import mlflow

mlflow.set_tracking_uri("http://127.0.0.1:8080")
mlflow.set_experiment("figure-demo")

fig, ax = plt.subplots(figsize=(6, 4))
ax.bar(["mae", "rmse"], [0.328, 0.506])
ax.set_title("Error metrics")

with mlflow.start_run(run_name="figure-pyplot"):
    mlflow.log_figure(fig, "plots/errors.png")
plt.close(fig)
print("Open figures after closing:", plt.get_fignums())
uv run python figure_pyplot.py
🏃 View run figure-pyplot at: http://127.0.0.1:8080/#/experiments/8/runs/ecc73482af0e4379bc86ff51b81006ee
🧪 View experiment at: http://127.0.0.1:8080/#/experiments/8
Open figures after closing: []
matplotlib.use("Agg") draws without a screen, which training jobs and servers usually don't have. plt.get_fignums() lists the figures pyplot still holds; after plt.close(fig) there are none. Building a Figure directly, as in Step 1, avoids the question altogether: How to Plot Predicted vs Actual Values with Matplotlib.
Common Mistakes
| Mistake | What happens | Do this instead |
|---|---|---|
| Saving the chart to a file, then logging the file | Extra code, and temporary files to clean up | mlflow.log_figure() saves it straight into the run |
Creating pyplot figures in a loop without closing them | Memory grows with every figure | plt.close(fig) after logging, or build a Figure directly |
| Logging every chart at the top level | The Artifacts tab gets crowded | Use folders, such as plots/ |
Troubleshooting
| Symptom | Likely cause | Fix |
|---|---|---|
| The chart is blank | The figure was logged before anything was drawn on it | Draw first, then call log_figure() |
plt.get_fignums() keeps growing in a long job | pyplot figures are logged but never closed | plt.close(fig) after each log_figure() |
FAQ
Does the Artifacts tab preview SVG files?
Yes. Both PNG and SVG files show a preview, with their size and path.
Do I need to call plt.savefig() first?
No. log_figure() saves the figure for you, in the format the file name says.
Can I log Plotly charts too?
Yes. log_figure() also accepts Plotly figures; MLflow's documentation lists the formats.
Where are the files stored?
On the tracking server, in its artifact store: How to See Where MLflow Stores Runs and Artifacts.
Conclusion
mlflow.log_figure() saved one Matplotlib figure into the run twice, as plots/loss.png and plots/loss.svg, with no temporary files. The Artifacts tab previewed the chart, and the pyplot version worked the same once plt.close() released the figure.
Additional Resources
- mlflow.log_figure — the API reference and supported figure types.
- matplotlib.figure.Figure — building figures without
pyplot.
