How to Load the California Housing Dataset in Python with scikit-learn

The California Housing dataset is the classic dataset for learning regression: 20,640 districts, 8 numbers about each, and a house value to predict. scikit-learn downloads it for you with one function. This guide loads it as a pandas table, explains every column, shows where the download is kept, and points out the $500,000 cap that surprises people.
Syntax
from sklearn.datasets import fetch_california_housing

housing = fetch_california_housing(as_frame=False, return_X_y=False, data_home=None)
| Part | What it means | Default |
|---|---|---|
fetch_california_housing() | Downloads the dataset the first time, then loads it from a cache folder | |
as_frame=True | Return pandas tables instead of NumPy arrays | False |
return_X_y=True | Return just the features and the target, as a pair, instead of one object with everything | False |
data_home= | Another folder for the cache | ~/scikit_learn_data |
The result is a Bunch, a dictionary whose keys also work as attributes: housing.data holds the 8 features, housing.target the house values, and housing.feature_names the column names. With as_frame=True, housing.frame holds features and target together in one table.
Prerequisites
- A uv project with scikit-learn and pandas:
uv add scikit-learn pandas. See How to Add a Package to a Python Project with uv. - An internet connection the first time, for the download.
Step 1: Load the Dataset
Create load_housing.py:
import pandas as pd
from sklearn.datasets import fetch_california_housing, get_data_home

pd.set_option("display.width", 120)

housing = fetch_california_housing(as_frame=True)
frame = housing.frame

print("Cached in:", get_data_home())
print("Rows and columns:", frame.shape)
print("Features:", housing.feature_names)
print("Target:", housing.target_names)
print()
print(frame.head())
print()
print(frame["MedHouseVal"].describe().round(3))
fetch_california_housing(as_frame=True)returns the data as pandas objects..frameis one table with the 8 features and the target side by side.get_data_home()returns the folder where scikit-learn keeps downloaded datasets.pd.set_option("display.width", 120)lets pandas print the whole table on one line.
Run it:
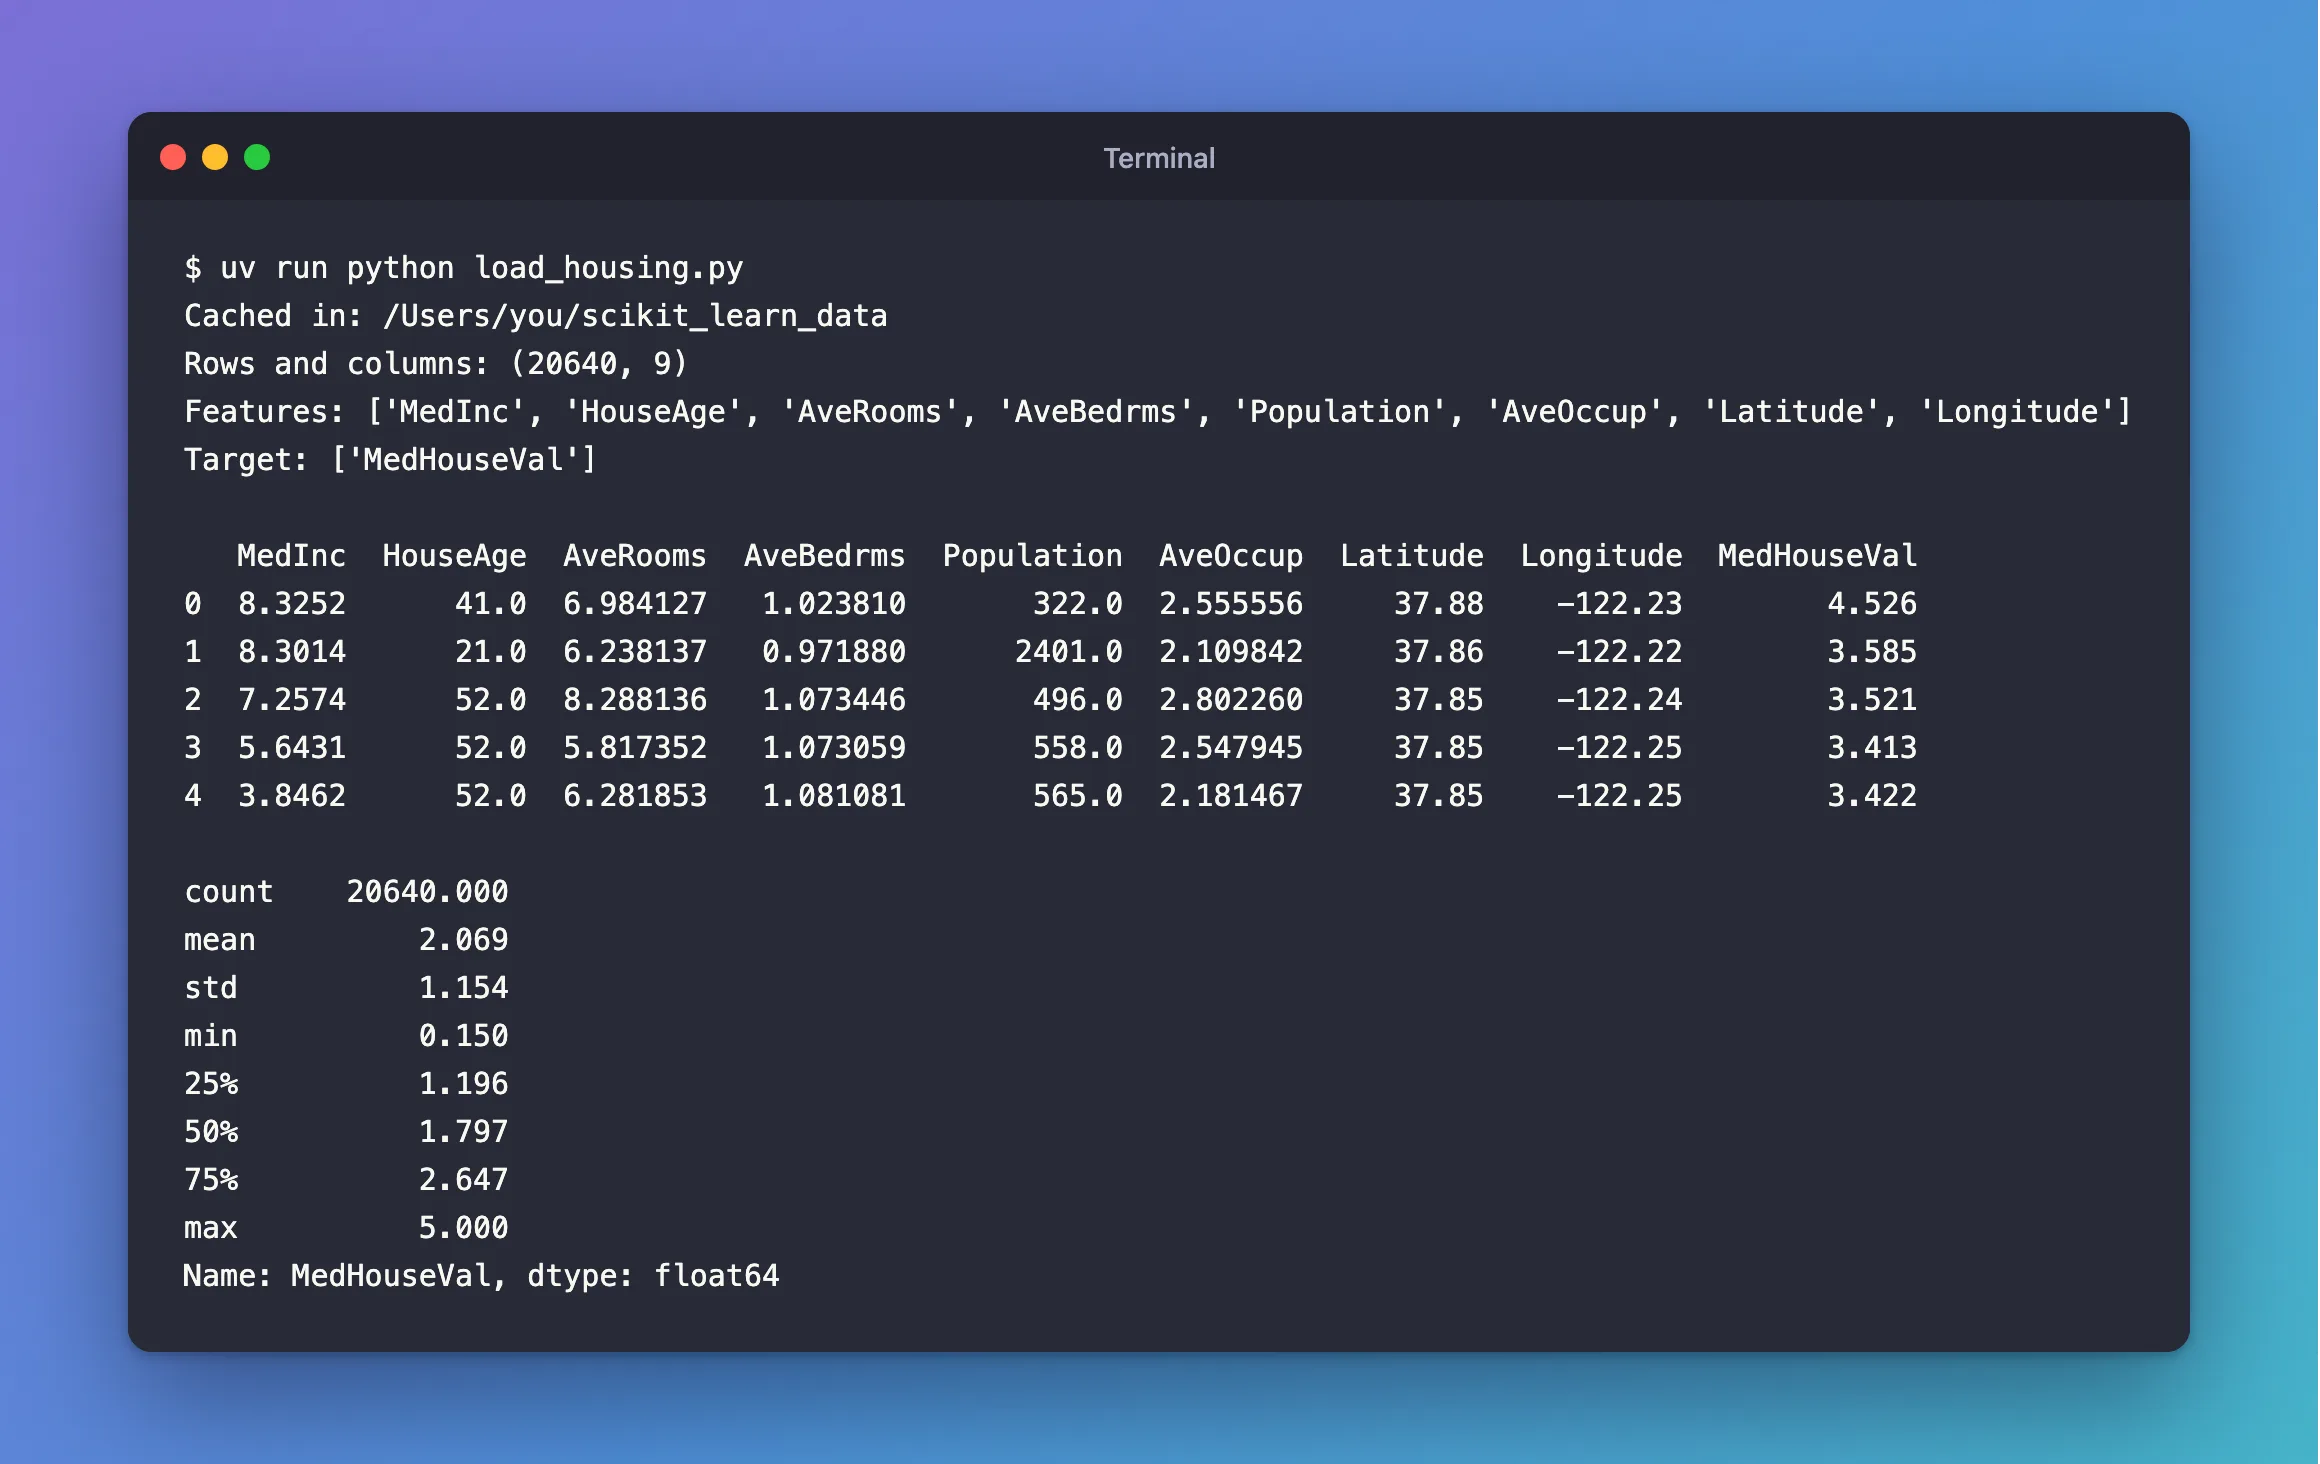
uv run python load_housing.py
Cached in: /Users/you/scikit_learn_data
Rows and columns: (20640, 9)
Features: ['MedInc', 'HouseAge', 'AveRooms', 'AveBedrms', 'Population', 'AveOccup', 'Latitude', 'Longitude']
Target: ['MedHouseVal']

   MedInc  HouseAge  AveRooms  AveBedrms  Population  AveOccup  Latitude  Longitude  MedHouseVal
0  8.3252      41.0  6.984127   1.023810       322.0  2.555556     37.88    -122.23        4.526
1  8.3014      21.0  6.238137   0.971880      2401.0  2.109842     37.86    -122.22        3.585
2  7.2574      52.0  8.288136   1.073446       496.0  2.802260     37.85    -122.24        3.521
3  5.6431      52.0  5.817352   1.073059       558.0  2.547945     37.85    -122.25        3.413
4  3.8462      52.0  6.281853   1.081081       565.0  2.181467     37.85    -122.25        3.422

count    20640.000
mean         2.069
std          1.154
min          0.150
25%          1.196
50%          1.797
75%          2.647
max          5.000
Name: MedHouseVal, dtype: float64
Step 2: Understand the Columns
The dataset describes itself in housing.DESCR. Its own words:
:Number of Instances: 20640

:Number of Attributes: 8 numeric, predictive attributes and the target

:Attribute Information:
    - MedInc        median income in block group
    - HouseAge      median house age in block group
    - AveRooms      average number of rooms per household
    - AveBedrms     average number of bedrooms per household
    - Population    block group population
    - AveOccup      average number of household members
    - Latitude      block group latitude
    - Longitude     block group longitude

:Missing Attribute Values: None

This dataset was obtained from the StatLib:
https://lib.stat.cmu.edu/datasets/houses.zip

The target variable is the median house value for California districts,
expressed in hundreds of thousands of dollars ($100,000).

This dataset was derived from the 1990 U.S. census, using one row per census
block group. A block group is the smallest geographical unit for which the U.S.
Census Bureau publishes sample data (a block group typically has a population
of 600 to 3,000 people).
So each row is one district (a census block group) in 1990, and the value to predict, MedHouseVal, is in hundreds of thousands of dollars: 4.526 means $452,600. Of the eight features, MedInc (median income) matters most: in How to Train a Random Forest Regression Model with scikit-learn it carries more than half of the forest's importance.
Step 3: Know About the Cap
Look at the summary again: max 5.000. The exact maximum is 5.00001, and 965 districts, 4.7% of the data, share it. Values above $500,000 were all recorded as the same number, so a model can never learn how expensive those districts really are, and charts of its predictions show a column of points at 5.0. How to Plot Predicted vs Actual Values with Matplotlib shows what that looks like.
Where the Download Goes
The first call downloads about 360 KB and saves it in scikit_learn_data in your home folder. Every later call reads that file, with no internet needed. If your program logs at INFO level, the first call prints:
INFO sklearn.datasets._california_housing: Downloading Cal. housing from https://ndownloader.figshare.com/files/5976036 to /Users/you/scikit_learn_data
scikit-learn's documentation explains how to move it: "By default the data directory is set to a folder named 'scikit_learn_data' in the user home folder. Alternatively, it can be set by the 'SCIKIT_LEARN_DATA' environment variable or programmatically by giving an explicit folder path." In code, that's fetch_california_housing(data_home="path/to/folder").
Common Mistakes
| Mistake | What happens | Do this instead |
|---|---|---|
Forgetting as_frame=True | You get plain NumPy arrays without column names | Pass as_frame=True and use .frame |
Reading MedHouseVal as dollars | A value of 4.5 looks absurd | Multiply by $100,000 |
| Expecting values above $500,000 | The data stops at 5.0 | Treat 5.0 as "$500,000 or more" |
| Training on all 20,640 rows | You have no fair way to measure the model | Split first: How to Split Data into Training and Test Sets with scikit-learn |
Troubleshooting
| Symptom | Likely cause | Fix |
|---|---|---|
ModuleNotFoundError: No module named 'sklearn' | The script ran outside the project's environment | Run it with uv run: How to Run a Python Script with uv run |
| The table wraps across several lines | pandas' default width is narrow | pd.set_option("display.width", 120) |
FAQ
Is the California Housing dataset free to use?
It's distributed with scikit-learn's dataset loaders and comes from the StatLib archive. Check its source if you plan to redistribute the data itself.
Why 1990?
It's the census the dataset was built from. It's ideal for learning, not for valuing a house today.
Can I load it without pandas?
Yes: leave out as_frame=True and you get NumPy arrays in housing.data and housing.target.
Conclusion
fetch_california_housing(as_frame=True).frame gave a 20,640 × 9 table: 8 numeric features per 1990 census district, and MedHouseVal, the median house value in units of $100,000, capped at 5.0. The download is cached in scikit_learn_data, so only the first call needs the internet.
Additional Resources
- fetch_california_housing — the function and its options.
- Real world datasets — scikit-learn's guide to its downloadable datasets.
- get_data_home — where downloads are cached.
