How to Keep Only Some Columns of a Table in Power Apps with ShowColumns

A table often has more columns than the next step needs. ShowColumns returns the table with only the columns you name, and drops all the others.
Syntax
ShowColumns(Table, Column1, Column2, ...)
| Part | What it is |
|---|---|
| Table | The table to shape. A record works too. |
| Column1, Column2, … | The columns to keep, by name, without quotes. At least one. |
From Microsoft's ShowColumns reference:
- It includes columns of a table or record and drops all other columns.
- The result is a new table. The original isn't changed.
- DropColumns is its opposite: it names the columns to drop and keeps the rest.
- With a data source, its output is limited to the number of records Power Apps fetches without delegation, 500 by default.
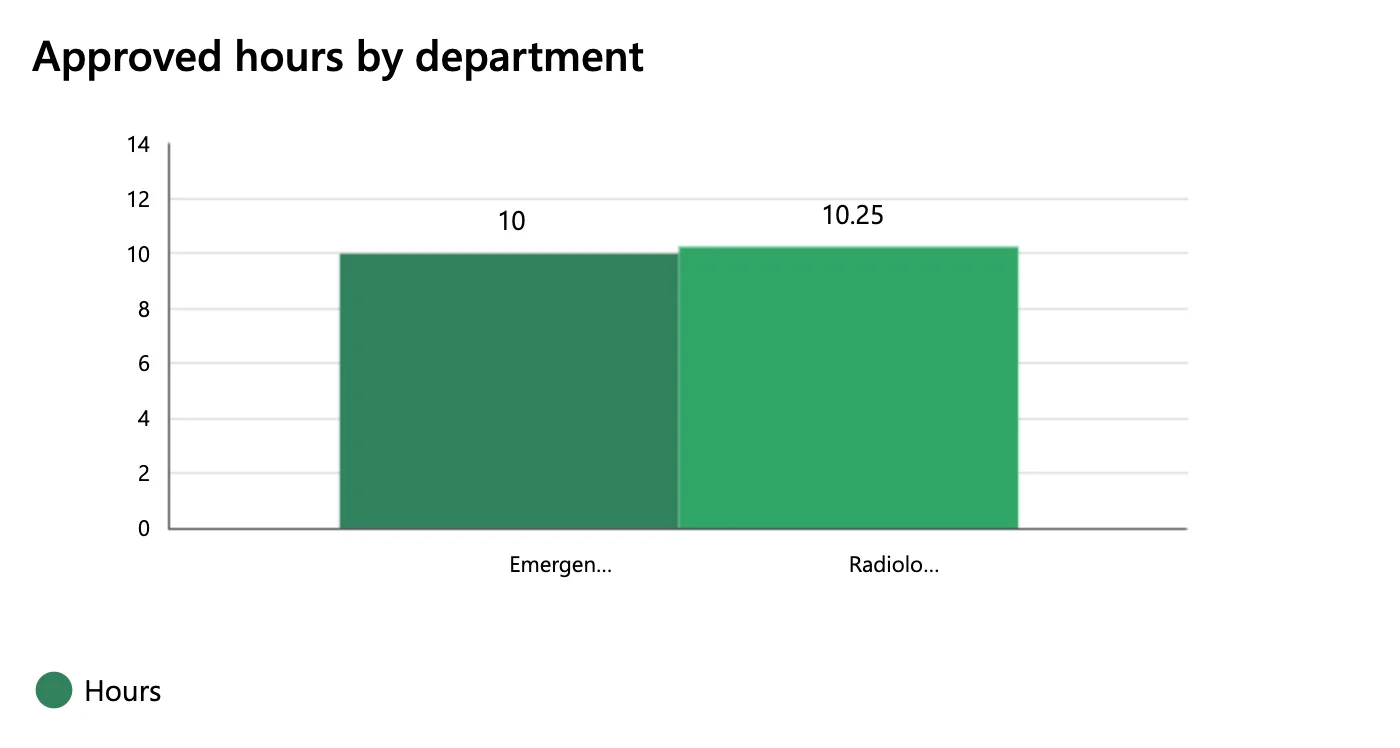
The example is the chart on the Reports screen of the Overtime Timesheet app, which shows each department's approved overtime hours. A column chart takes its labels from the table's first column and draws the columns after it (How to Add a Column Chart in Power Apps), so it needs one label column and one number column.
Step 1: Look at the Table's Columns
locRowsRS holds the month's entries, with Employee, Email, Department and Hours columns. This formula gives one row per department with its total:
AddColumns(GroupBy(locRowsRS, Department, Rows), Hours, Sum(Rows, Hours))
Its rows have three columns: Department, Rows, which holds the department's entries, and Hours. The chart needs only Department and Hours.
Step 2: Name the Columns to Keep
Wrap the table in ShowColumns and name the two columns:
ShowColumns(
    AddColumns(GroupBy(locRowsRS, Department, Rows), Hours, Sum(Rows, Hours)),
    Department,
    Hours
)
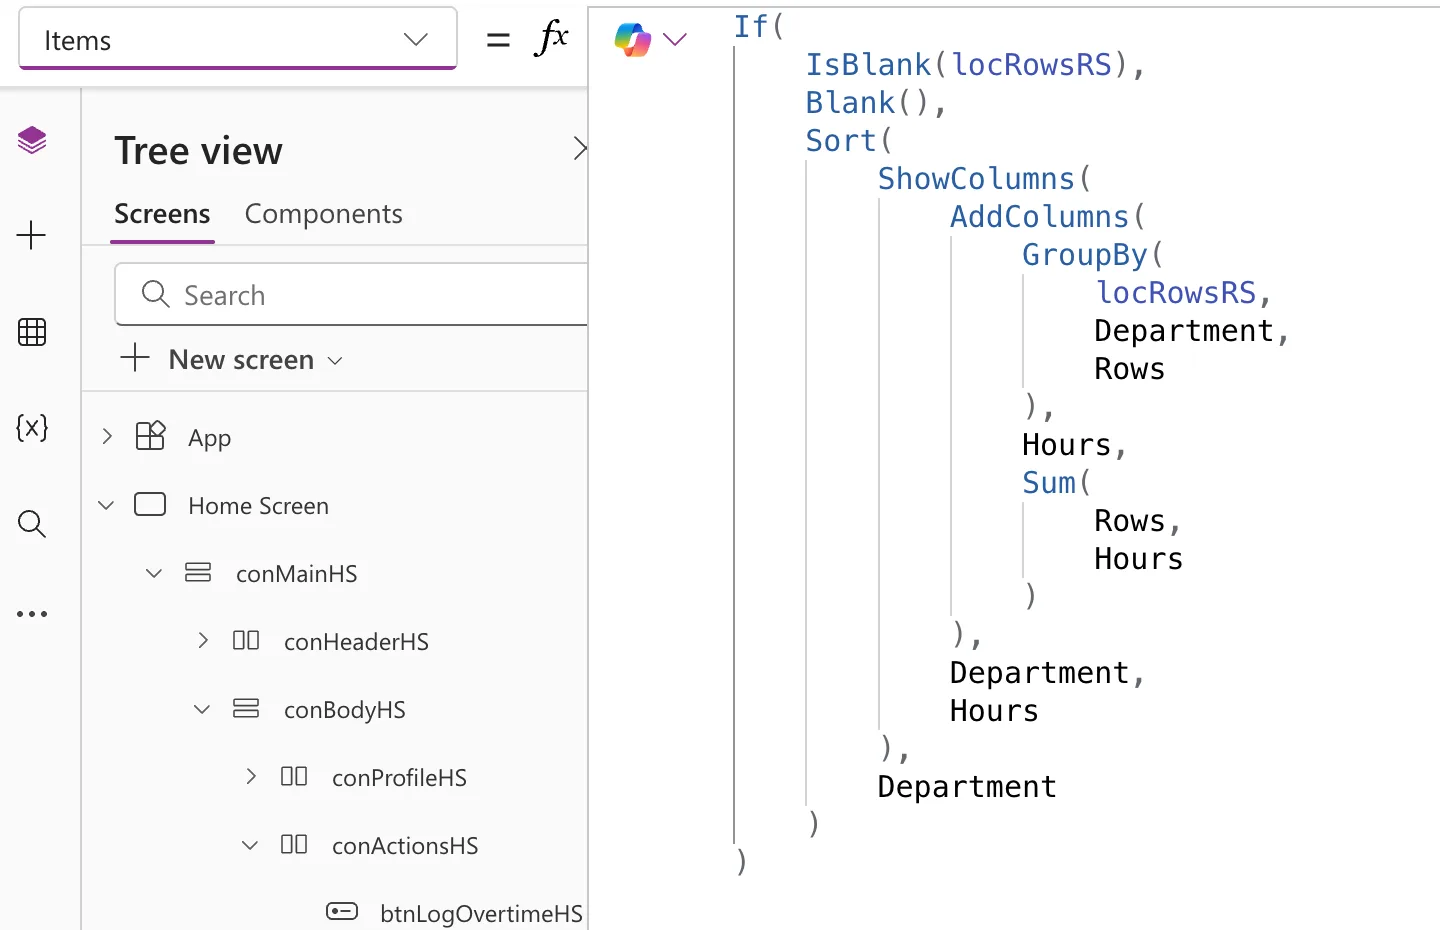
In the app, the chart's Items also sorts the departments and checks that the table has been loaded:
The Result
The chart got a label and a number for each department:
Common Mistakes
| Mistake | What happens | Do this instead |
|---|---|---|
| Expecting the original table to change | ShowColumns returns a new table; the source keeps every column | Use the result where it's needed |
| Naming many columns to drop one | A long formula | DropColumns with the one column |
| Using it on a large data source | Only the first records Power Apps fetches are in the result | Filter in the data source first, with delegable functions |
Troubleshooting
| Symptom | Likely cause | Fix |
|---|---|---|
| A column you need is missing later | It wasn't named in ShowColumns | Add it to the list |
| Column names in quotes from an older app | Apps before version 3.24042 used quoted names | Microsoft's reference says apps were updated to unquoted names automatically; write new formulas without quotes |
FAQ
ShowColumns or DropColumns?
Name whichever list is shorter. ShowColumns keeps the columns you name; DropColumns removes them.
Can ShowColumns make a one-column table?
Yes. Microsoft's reference gives that as a use: a one-column table for functions that take one, such as Lower on a column of texts.
Does it work on a record?
Yes. The reference's first argument is a table or a record, and the result is the same kind.
Conclusion
ShowColumns(Table, Column1, Column2, ...) keeps the columns you name and drops the rest, without changing the original table. Here it turned a grouped and totalled table into the two columns a chart needs.
Additional Resources
- AddColumns, DropColumns, RenameColumns, and ShowColumns functions
- Understand delegation in a canvas app
