How to Get the History of a Metric in MLflow

When a run logs a metric many times, such as a loss after every round of training, MLflow keeps every value. The run's summary shows only the latest one, though. MlflowClient.get_metric_history returns them all, each with its step and the moment it was logged. This guide reads a short curve back and finds its best step, with real output from MLflow 3.18.0.
Syntax
from mlflow import MlflowClient

history = MlflowClient().get_metric_history("<run ID>", "<metric name>")
for point in history:
    print(point.step, point.value, point.timestamp)
| Part | What it means |
|---|---|
MlflowClient() | MLflow's lower-level client. It talks to the tracking server you set with mlflow.set_tracking_uri() or MLFLOW_TRACKING_URI |
get_metric_history(run_id, key) | "Return a list of metric objects corresponding to all values logged for a given metric", in MLflow's words |
"<run ID>" | The run's ID, not its name. The run page shows it, and run.info.run_id holds it in code |
point.step | The step the value was logged at: the "x-coordinate" of the curve |
point.value | The number that was logged |
point.timestamp | When it was logged, "as an integer (milliseconds since the Unix epoch)" |
mlflow.get_run(run_id).data.metrics, by contrast, holds one value per metric: the latest.
Prerequisites
- MLflow in a uv project and a running tracking server at
http://127.0.0.1:8080: see How to Start an MLflow Tracking Server on Your Computer. - A metric logged at several steps. The script below logs one; How to Log Metrics in MLflow explains
step.
Step 1: Log a Short Curve and Read It Back
The example logs a falling "loss" at five steps, as a training loop would, then reads it back. Create metric_history.py:
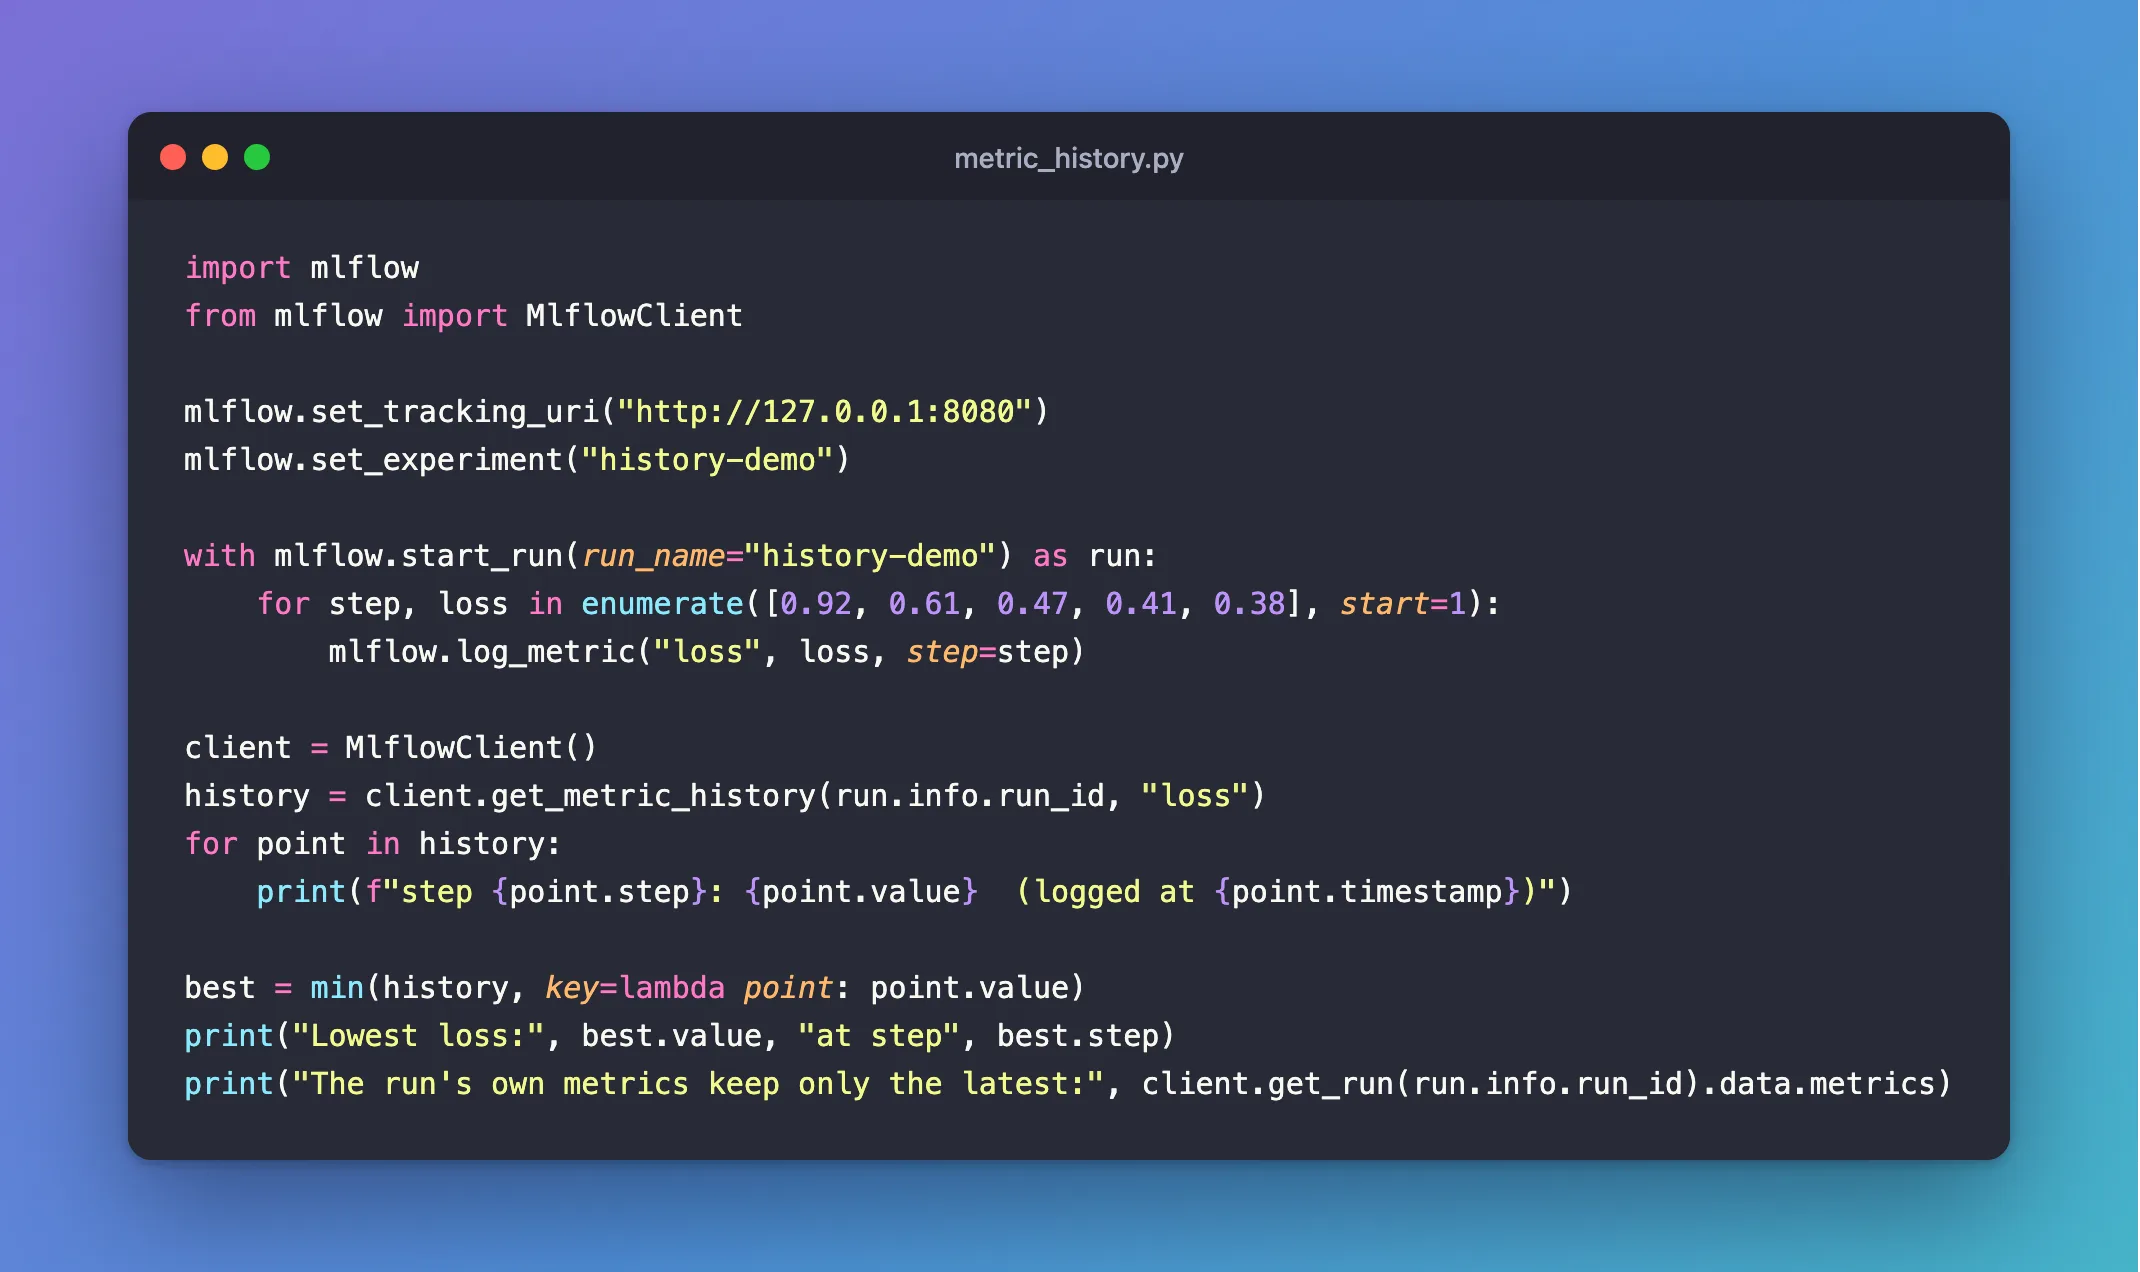
import mlflow
from mlflow import MlflowClient

mlflow.set_tracking_uri("http://127.0.0.1:8080")
mlflow.set_experiment("history-demo")

with mlflow.start_run(run_name="history-demo") as run:
    for step, loss in enumerate([0.92, 0.61, 0.47, 0.41, 0.38], start=1):
        mlflow.log_metric("loss", loss, step=step)

client = MlflowClient()
history = client.get_metric_history(run.info.run_id, "loss")
for point in history:
    print(f"step {point.step}: {point.value}  (logged at {point.timestamp})")

best = min(history, key=lambda point: point.value)
print("Lowest loss:", best.value, "at step", best.step)
print("The run's own metrics keep only the latest:", client.get_run(run.info.run_id).data.metrics)
| Line | What it does |
|---|---|
The with block | Logs loss five times, at steps 1 to 5. The values are made up to keep the example short; in real training they come from your model |
client.get_metric_history(run.info.run_id, "loss") | Reads back all five points of the run's loss |
min(history, key=lambda point: point.value) | Picks the point with the lowest value. For a score where higher is better, use max |
client.get_run(...).data.metrics | The run's summary, for comparison |
Step 2: Run It
uv run python metric_history.py
2026/11/18 11:04:18 INFO mlflow.tracking.fluent: Experiment with name 'history-demo' does not exist. Creating a new experiment.
🏃 View run history-demo at: http://127.0.0.1:8080/#/experiments/2/runs/5001cfd7fe3040ca8c03faab17152385
🧪 View experiment at: http://127.0.0.1:8080/#/experiments/2
step 1: 0.92  (logged at 1794980058692)
step 2: 0.61  (logged at 1794980058707)
step 3: 0.47  (logged at 1794980058715)
step 4: 0.41  (logged at 1794980058722)
step 5: 0.38  (logged at 1794980058728)
Lowest loss: 0.38 at step 5
The run's own metrics keep only the latest: {'loss': 0.38}
All five points came back, each with its step and a timestamp in milliseconds; the five were logged within 36 milliseconds of each other. The run's summary kept only 0.38, the value from the last step.
Step 3: See the Same Curve in the UI
Open the run with the View run link and click Model metrics. The chart draws the same five points, with Step along the bottom:
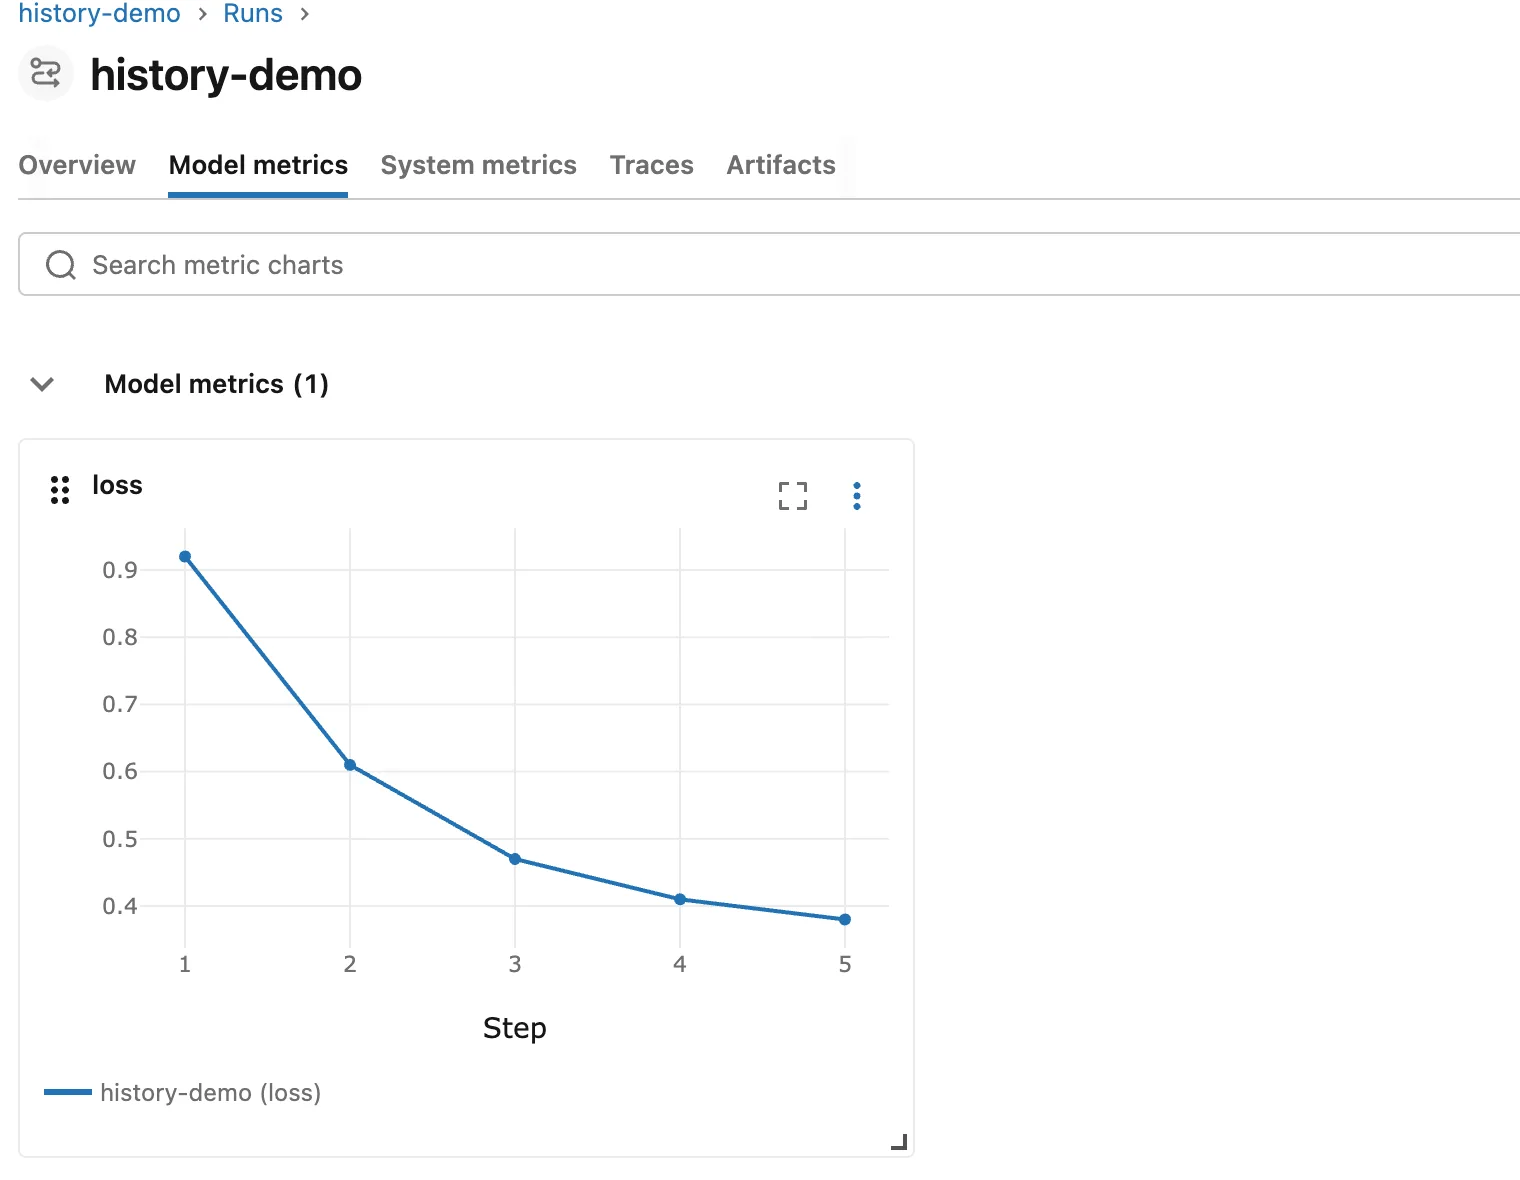
get_metric_history gives you the numbers behind that line, ready to compare, plot or test in code.
Common Mistakes
| Mistake | What happens | Do this instead |
|---|---|---|
Reading run.data.metrics for a curve | You get one value per metric, the latest | Use get_metric_history |
| Passing the run's name instead of its ID | An empty list, with no error | Pass run.info.run_id, or the Run ID from the run page |
| Misspelling the metric name | An empty list, with no error | Copy the name from the run's Model metrics tab |
| Assuming the lowest value is always best | For scores such as R², higher is better | Use max for scores where higher is better |
Troubleshooting
| Symptom | Likely cause | Fix |
|---|---|---|
[] | The run ID or the metric name is wrong. MLflow returns an "empty list" for both rather than an error | Check both against the run page |
| One point, at step 0 | The metric was logged once, without step | Log it with step= at each round of training |
Timestamps like 1794980058692 | They're milliseconds since 1 January 1970 (UTC) | Divide by 1,000 and use Python's datetime.fromtimestamp to read them as a date |
FAQ
Can I get the history of several metrics at once?
get_metric_history reads one metric of one run. Call it once per metric, or once per run in a loop.
Is there a limit on how many points it returns?
MLflow's reference for the method doesn't mention one. In every run I read for this series, the longest with 15 points per metric, it returned all of them.
Where else can I see the history?
On the run's Model metrics tab, and on the experiment's chart view, which draws the same metric for several runs side by side: How to Compare Runs in the MLflow UI.
Conclusion
MlflowClient().get_metric_history(run_id, "loss") returned all five values of a metric with their steps and timestamps, while the run's own summary kept only the latest. min picked the best step, and the run's Model metrics tab drew the same curve.
Additional Resources
- MlflowClient.get_metric_history — MLflow's reference for the method.
- mlflow.entities.Metric — what each point holds.
