How to Get Data from a SharePoint List in Power BI in the Browser

You don't need Power BI Desktop to report on a SharePoint list. The Power BI service can create a semantic model straight from the browser, with the same Power Query editor to shape the data. Here's how to get two SharePoint lists into a new semantic model.
Microsoft's Edit semantic models in the Power BI service explains that Get Data launches the Power Query Get data experience, where you choose a connector and make transformations, then either create a report or a semantic model only. The example reads two lists from a SharePoint site: Expenses, with eight expense claims, and Expense Categories, with three categories and their managers.
Prerequisites
- A Power BI workspace you can add items to, with a Power BI Pro or Premium Per User license.
- Read access to the SharePoint lists.
Step 1: Create a Semantic Model Item
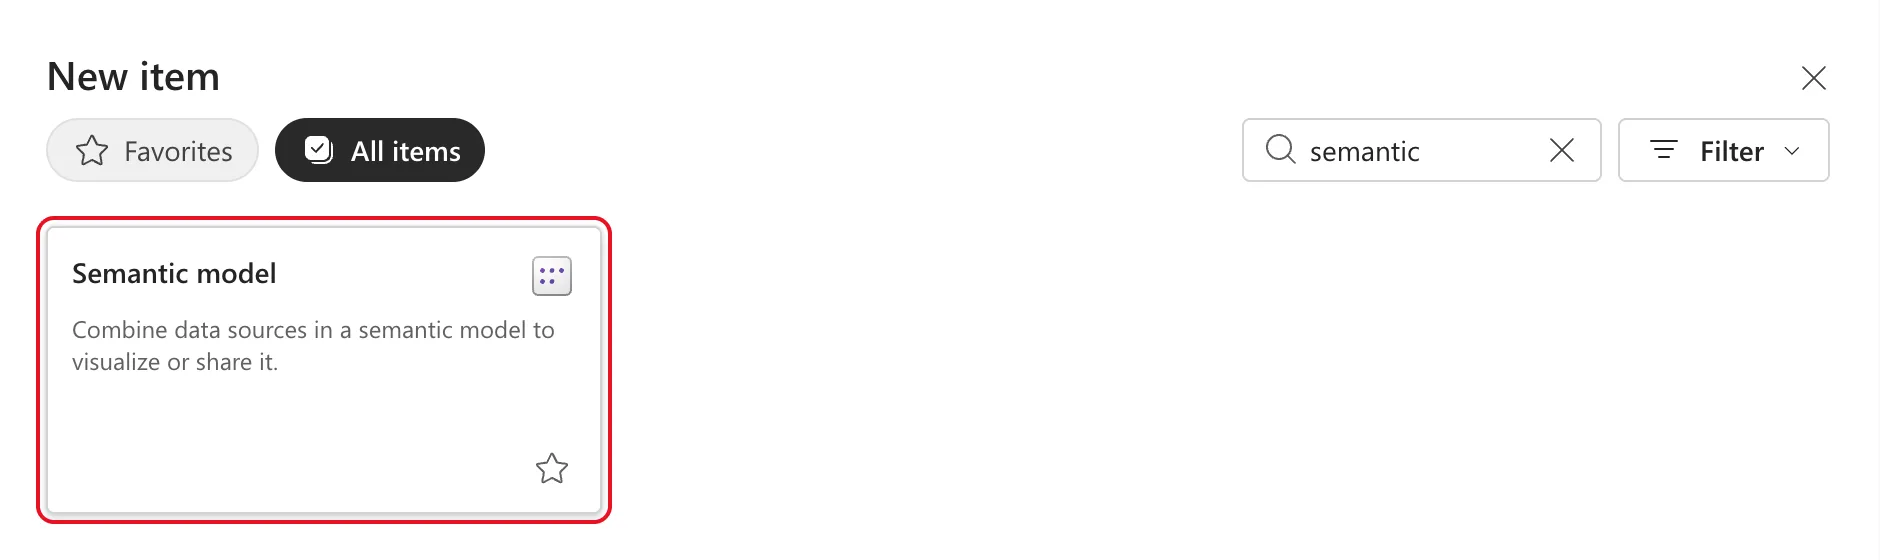
Open the workspace and select New item. Type semantic in the search box and select Semantic model, Combine data sources in a semantic model to visualize or share it:
Step 2: Select Get Data
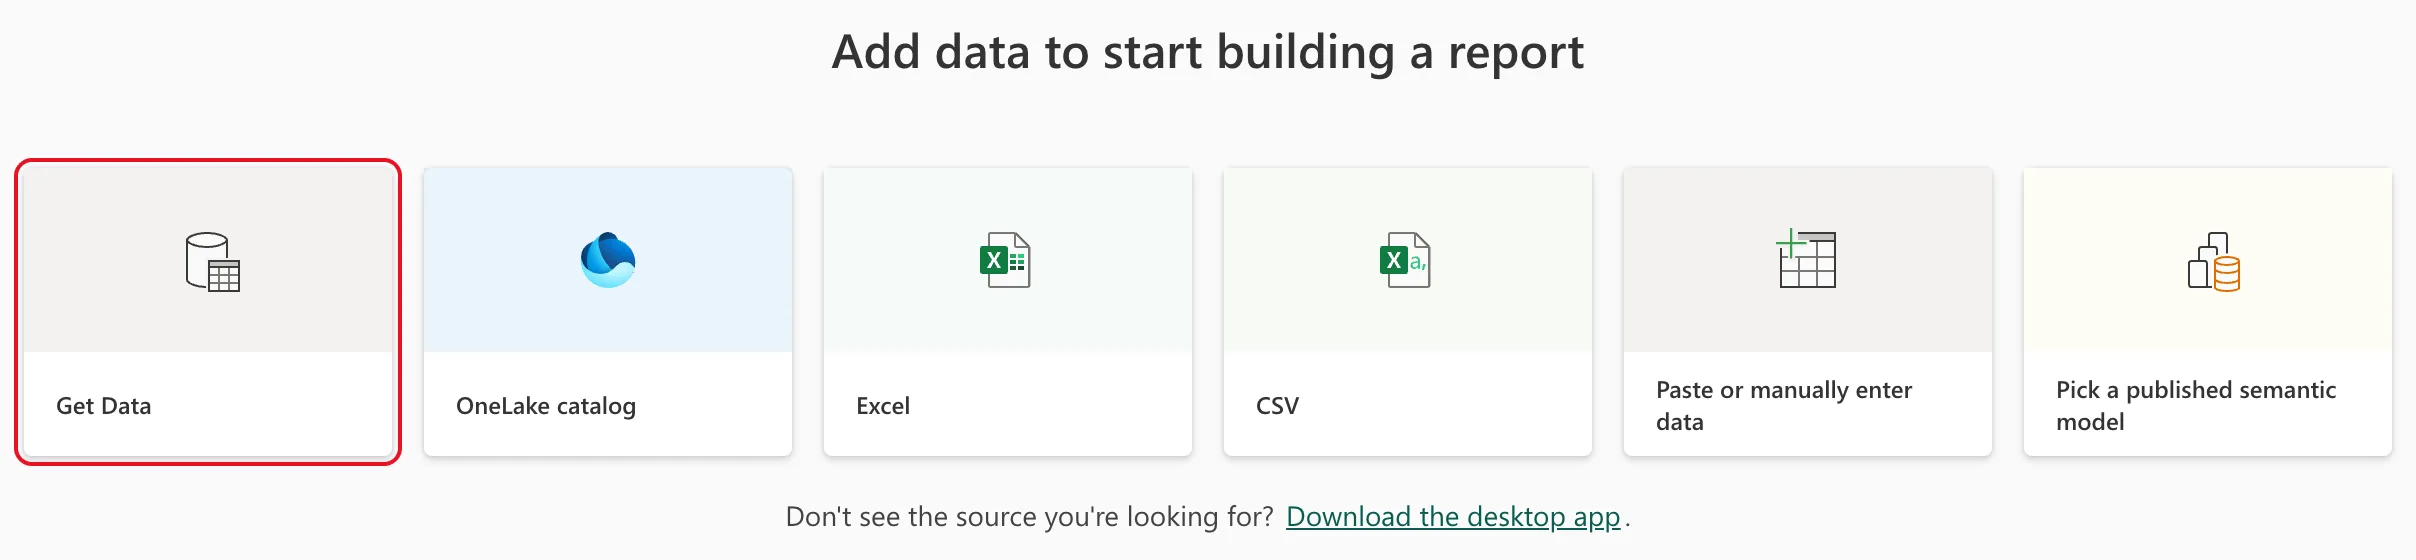
A page titled Add data to start building a report offers several sources. Select Get Data, which opens every connector:
Step 3: Choose SharePoint Online List
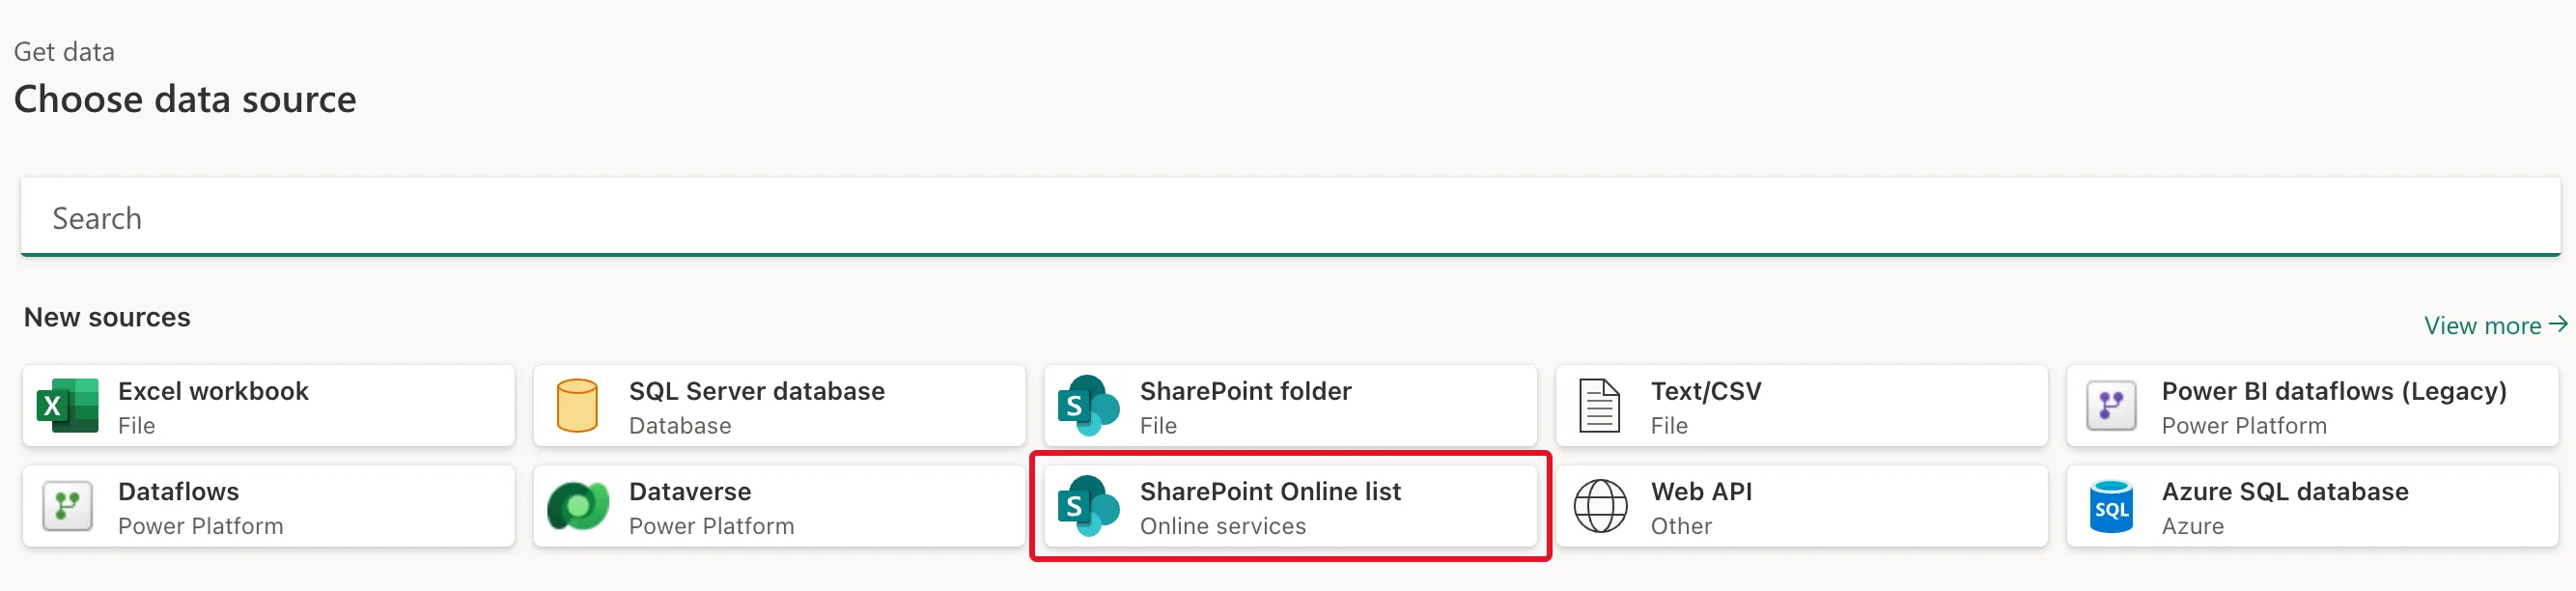
Under Choose data source, select SharePoint Online list:
Step 4: Fill In the Connection Settings
Fill in Connection settings:
- Site URL: the address of the site, not of a list. The connector's troubleshooting notes ask for the root address of the site, without subfolders or documents.
- Implementation: 2.0. Microsoft's SharePoint Online list connector article calls it the updated version of the connector, generally available since September 2022.
- Advanced options > View mode: All - Retrieve all columns from a SharePoint List. The same article says the All view includes all user-created and system-defined columns, while Default follows the list's default view.
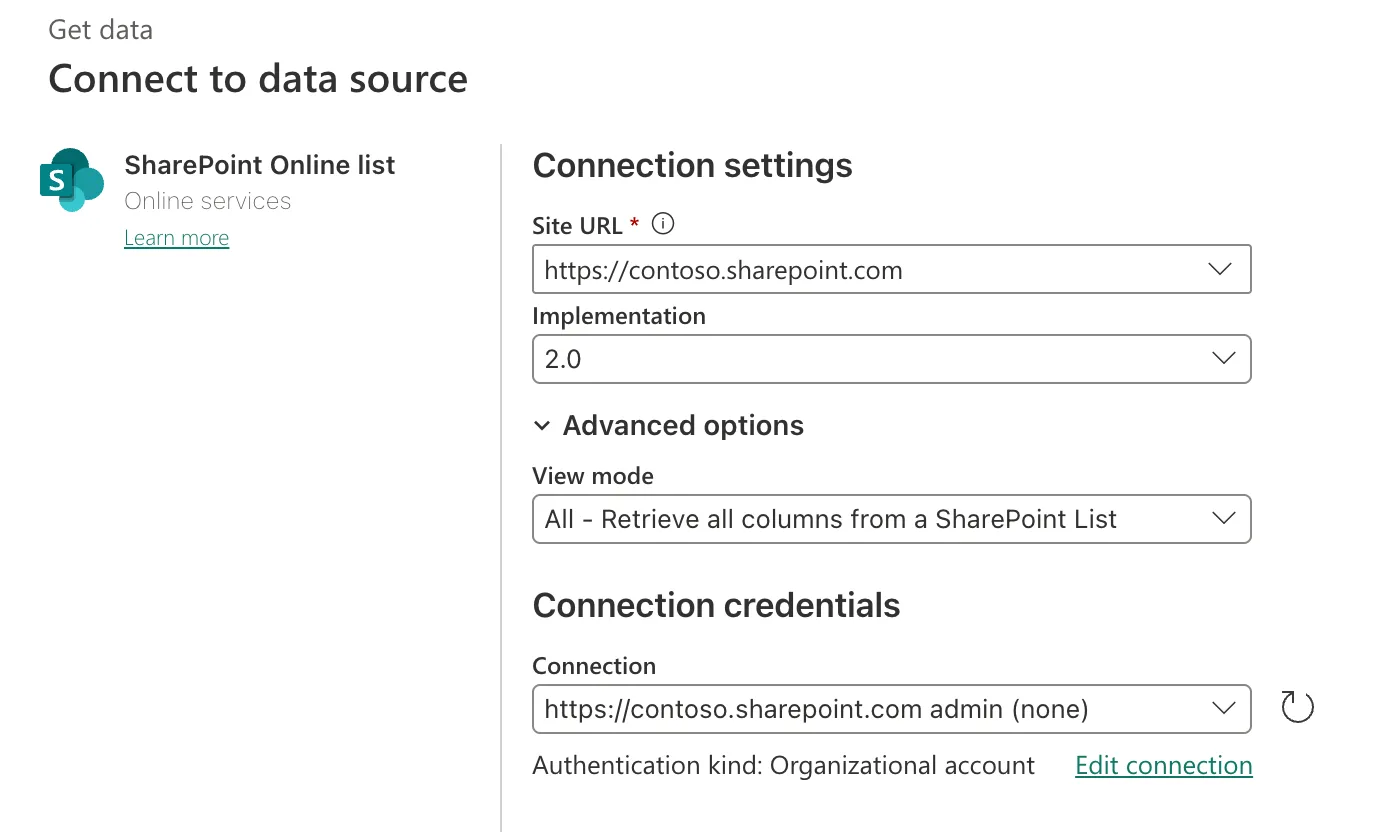
Under Connection credentials, Power BI picked a connection I already had for the site, signed in with my organizational account. If you've never connected to the site, the Connection box offers Create new connection: keep Organizational account and sign in.
Select Next.
Step 5: Choose the Lists
Choose data lists everything on the site, here 21 lists and libraries. Selecting a list's name previews its rows on the right. Tick the box of each list you want, here Expense Categories and Expenses:
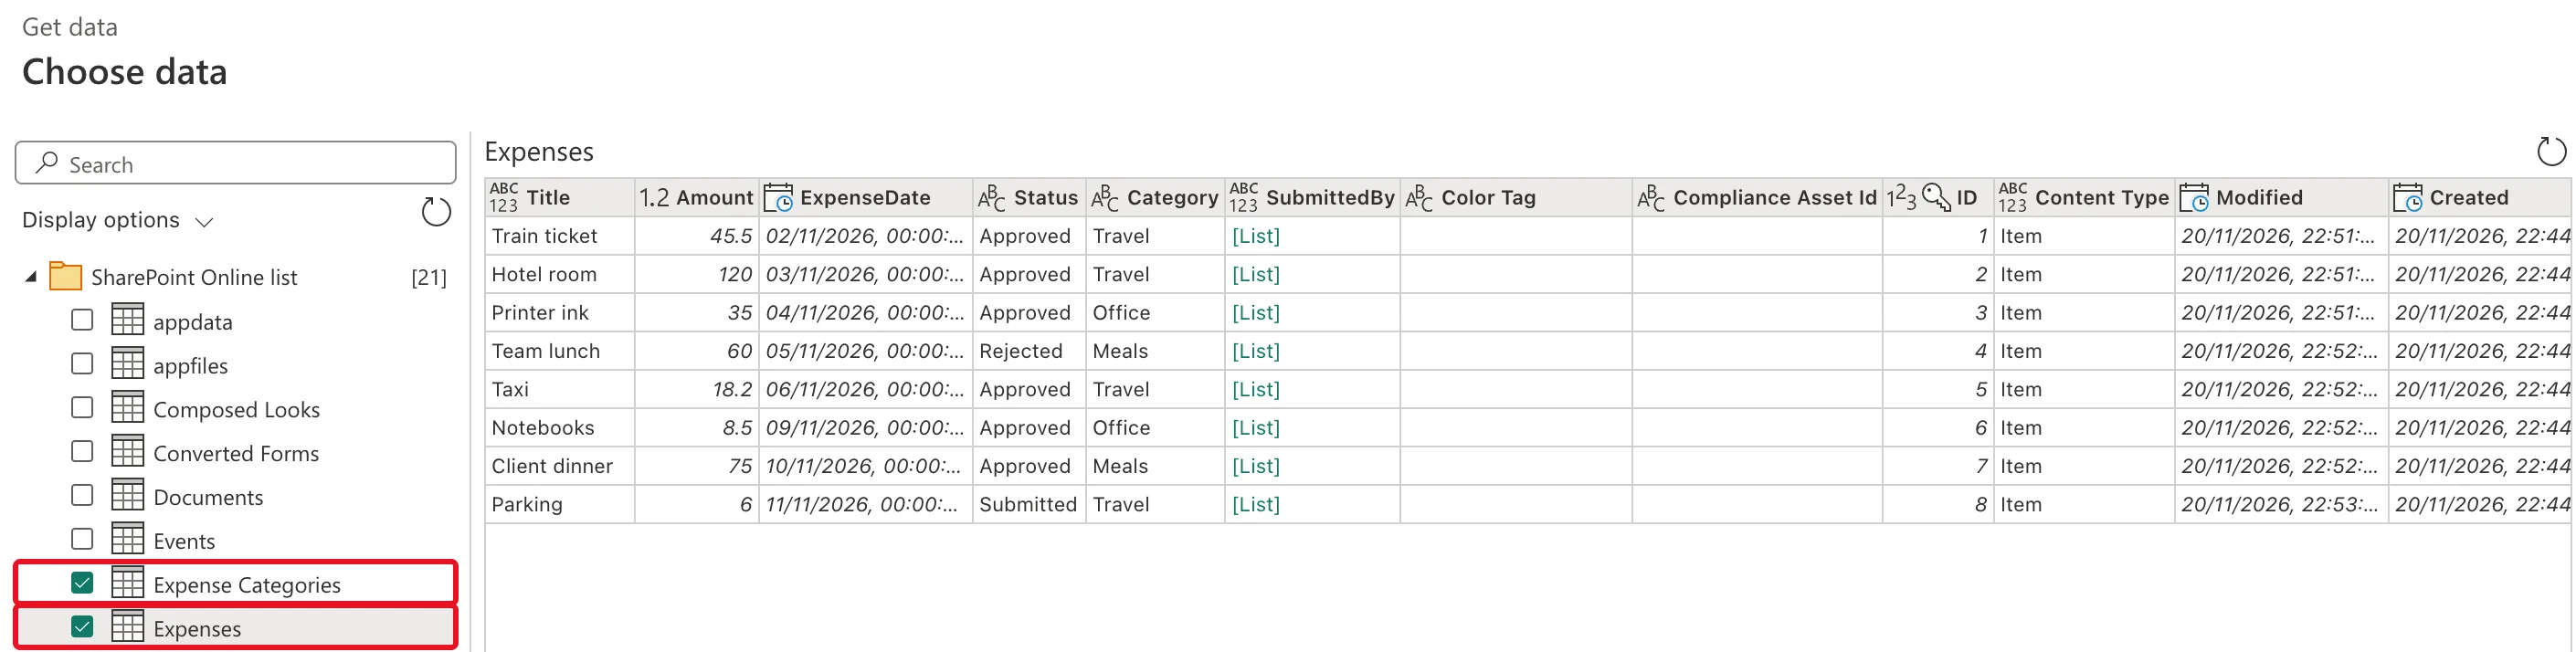
The preview already shows what needs shaping: system columns such as Color Tag and Content Type, and the SubmittedBy person column as [List].
Step 6: Select Transform Data
At the bottom right, select Transform data:

The Power Query editor opens with one query per list, under Queries [2]:

The data is in Power Query, not yet in a model. Shape each query first, for example choose its columns, then create the semantic model.
Common Mistakes
| Mistake | What happens | Do this instead |
|---|---|---|
| Pasting a list's address as the Site URL | The connector can't find the site | The site's address only |
| Leaving View mode on Default | You get only the columns in the list's default view | All, then choose columns in Power Query |
| Ticking every list on the site | The model fills with lists you don't use | Tick only the lists the report needs |
Troubleshooting
| Symptom | Likely cause | Fix |
|---|---|---|
| No New item button | You're in a workspace where you can only view | Use a workspace where you're an Admin, Member or Contributor |
| The connection fails | Signed in with an account that can't read the site | Edit the connection and sign in with an account that can |
| A person or choice column shows [List] or [Table] | It holds a list of values | Expand it in Power Query (How to Get the Email from a SharePoint Person Column in Power Query) |
FAQ
Can I do this on a Mac?
Yes. Everything here runs in the browser at app.powerbi.com. Power BI Desktop runs only on Windows.
Does the model update when the list changes?
Only when the model refreshes (How to Schedule a Refresh of a Power BI Semantic Model).
Conclusion
In a workspace, New item > Semantic model > Get Data > SharePoint Online list, with the site's address, implementation 2.0 and view mode All. Tick the lists, select Transform data, and each list becomes a query in Power Query.
