How to Get Class Probabilities with predict_proba in scikit-learn

A classifier's predict gives you one answer per sample, the class it picks. predict_proba tells you how sure it is: a probability for every class. That's what you need to rank customers by how likely they are to buy, or to pick your own cut-off. This guide compares the two on three flowers, with real output from scikit-learn 1.9.1.
Syntax
probabilities = model.predict_proba(X)
| Part | What it means |
|---|---|
model | A trained classifier that supports probabilities, such as LogisticRegression |
X | The samples, one per row, with the columns the model was trained on |
probabilities | An array with one row per sample and one column per class, in the order of model.classes_. Each row adds up to 1 |
Step 1: Compare predict and predict_proba
The example trains a logistic regression on scikit-learn's iris flowers, three species numbered 0, 1 and 2, and asks about three flowers, one from each species:
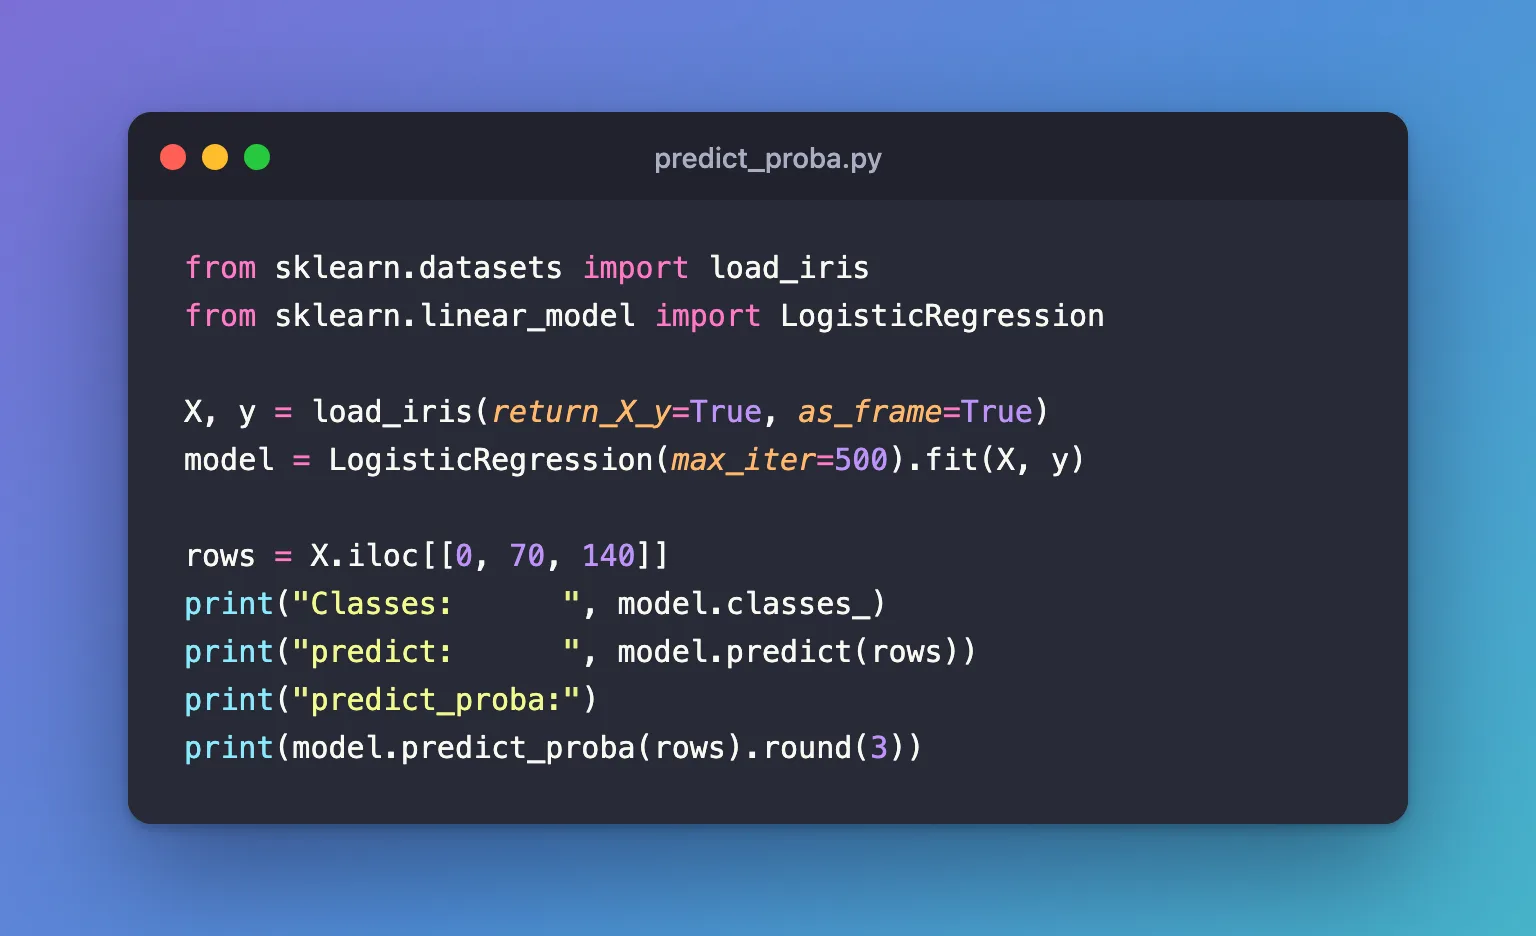
from sklearn.datasets import load_iris
from sklearn.linear_model import LogisticRegression

X, y = load_iris(return_X_y=True, as_frame=True)
model = LogisticRegression(max_iter=500).fit(X, y)

rows = X.iloc[[0, 70, 140]]
print("Classes:      ", model.classes_)
print("predict:      ", model.predict(rows))
print("predict_proba:")
print(model.predict_proba(rows).round(3))
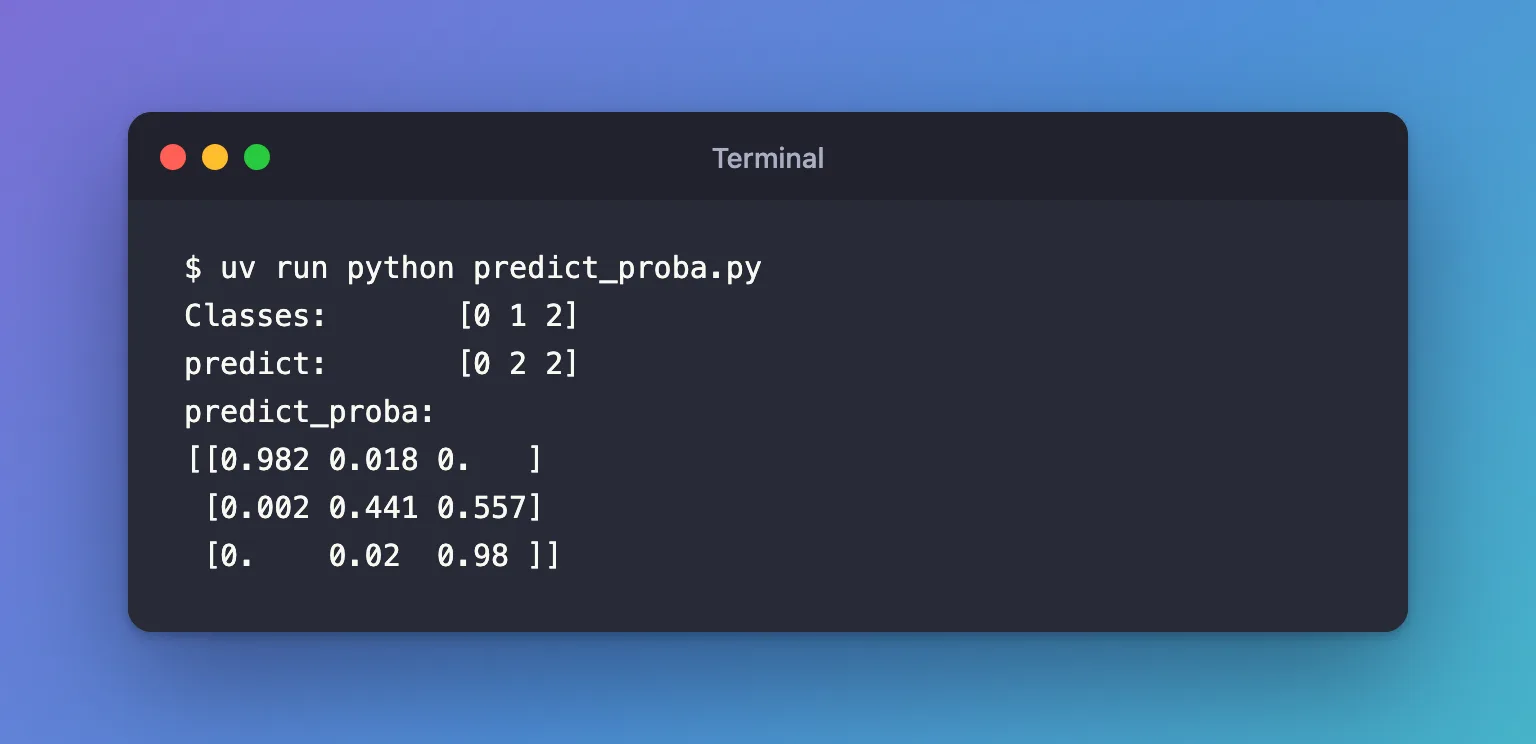
uv run python predict_proba.py
Classes:       [0 1 2]
predict:       [0 2 2]
predict_proba:
[[0.982 0.018 0.   ]
 [0.002 0.441 0.557]
 [0.    0.02  0.98 ]]
- The columns follow
classes_: the first column is class 0, the second class 1, the third class 2. - The first and last flowers are clear cases: 0.982 for class 0, 0.98 for class 2.
- The middle flower is not: 0.441 for class 1 against 0.557 for class 2.
predictsays 2, the class with the highest probability, though the flower is in fact from species 1 (row 70 of the data).predicthides that doubt;predict_probashows it.
Step 2: Take One Class's Column
For a yes/no model, the column you usually want is the probability of "yes". With classes 0 and 1, that's the second column: model.predict_proba(X)[:, 1]. How to Calculate ROC AUC in scikit-learn scores a model with exactly that column.
Common Mistakes
| Mistake | What happens | Do this instead |
|---|---|---|
| Assuming the columns are in alphabetical or any fixed order | You read the wrong class's probability | Check model.classes_ |
Using predict to rank samples by how likely they are | Every sample gets only 0 or 1 | predict_proba(X)[:, 1] |
Troubleshooting
| Symptom | Likely cause | Fix |
|---|---|---|
AttributeError: 'LinearSVC' object has no attribute 'predict_proba' | Not every classifier gives probabilities; LinearSVC doesn't | Use a classifier that does, such as LogisticRegression |
FAQ
Do the probabilities in a row always add up to 1?
Yes: each row shares 1 across the classes, as all three rows above do.
Can I change the 0.5 cut-off for a yes/no model?
Yes: compare predict_proba(X)[:, 1] with your own threshold instead of calling predict.
Conclusion
predict gave one class per flower; predict_proba gave three probabilities each, in the order of classes_, and showed that the middle flower was a close call. For a yes/no model, take the second column for the probability of yes.
Additional Resources
- LogisticRegression.predict_proba — what it returns and the column order.
