How to Evaluate a Regression Model with mlflow.models.evaluate

A regression model predicts a number, so its test scores are about distance: how far off it is on average, at worst, and how much of the spread it explains. mlflow.models.evaluate with model_type="regressor" computes them all in one call and logs them to the run, linked to the model. This guide evaluates a model of diabetes progression, with real output from MLflow 3.18.0.
Syntax
result = mlflow.models.evaluate(
    model_uri,
    data,
    targets="target_column",
    model_type="regressor",
)
| Part | What it means |
|---|---|
model_uri | The model to evaluate, such as models:/m-... |
data | A pandas DataFrame with the model's input columns and the true values |
targets | The name of the column of true values in data |
model_type | "regressor", so MLflow computes the regression metrics |
result | An EvaluationResult; result.metrics holds the scores |
The reference for mlflow.models.evaluate lists what a regressor gets: "example_count, mean_absolute_error, mean_squared_error, root_mean_squared_error, sum_on_target, mean_on_target, r2_score, max_error, mean_absolute_percentage_error."
Prerequisites
- An MLflow tracking server at
http://127.0.0.1:8080. MLflow's tracking server guide shows how to start one. mlflowandscikit-learnin your project, for example withuv add mlflow scikit-learn pandas.
Step 1: Log and Evaluate the Model
The example fits a linear regression to three quarters of scikit-learn's diabetes data, which predicts how far each patient's disease progressed after a year. It logs the model and evaluates it on the other quarter:
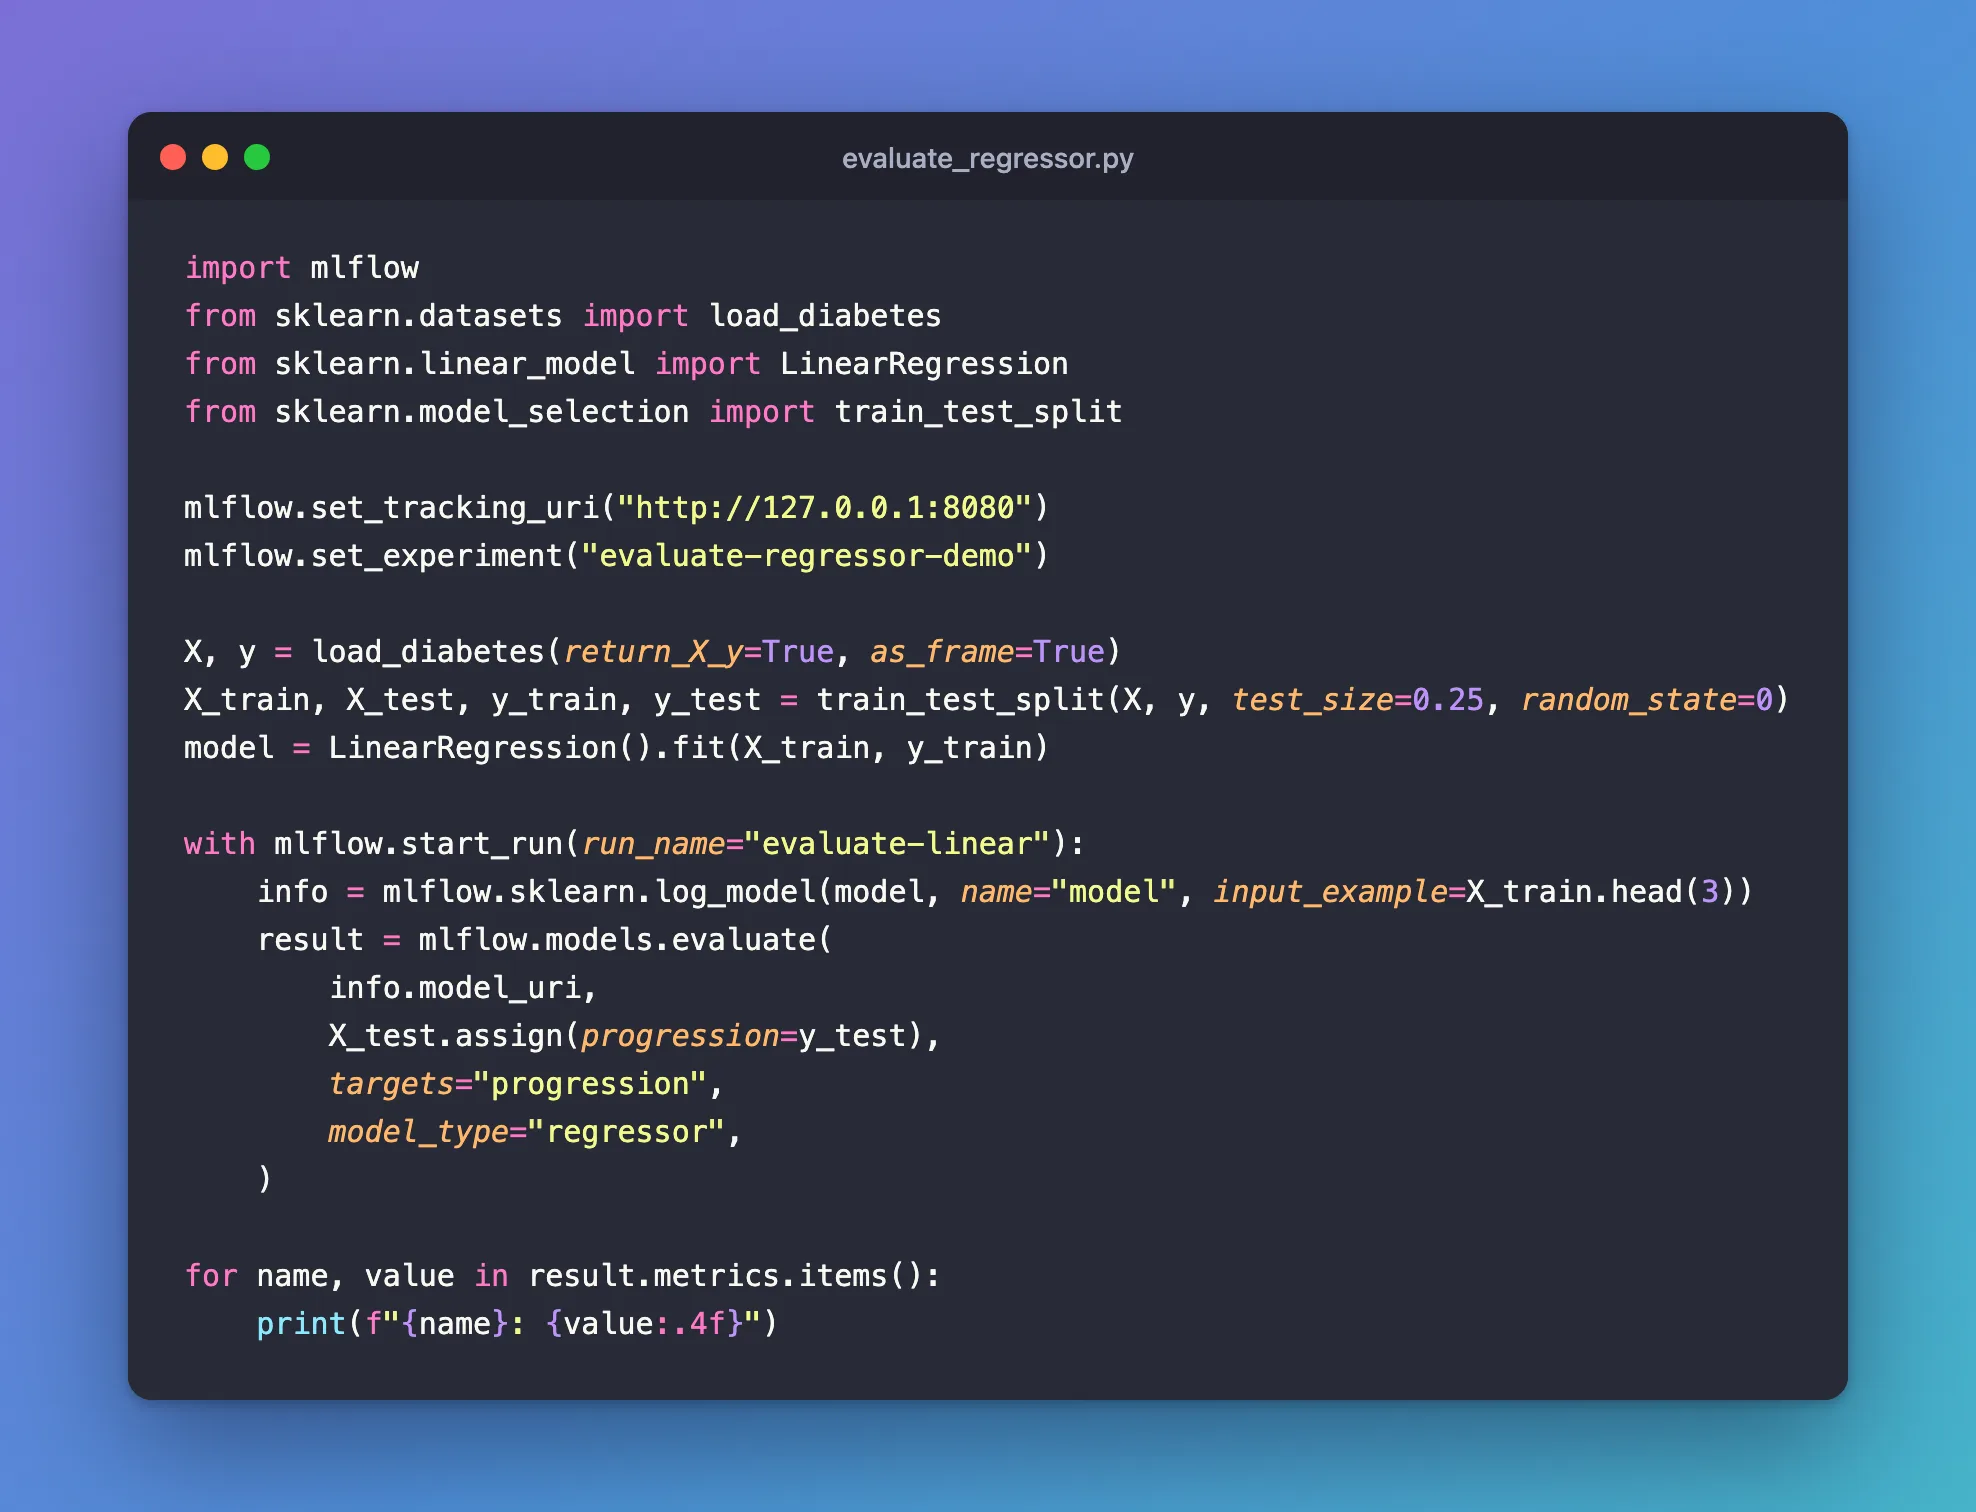
import mlflow
from sklearn.datasets import load_diabetes
from sklearn.linear_model import LinearRegression
from sklearn.model_selection import train_test_split

mlflow.set_tracking_uri("http://127.0.0.1:8080")
mlflow.set_experiment("evaluate-regressor-demo")

X, y = load_diabetes(return_X_y=True, as_frame=True)
X_train, X_test, y_train, y_test = train_test_split(X, y, test_size=0.25, random_state=0)
model = LinearRegression().fit(X_train, y_train)

with mlflow.start_run(run_name="evaluate-linear"):
    info = mlflow.sklearn.log_model(model, name="model", input_example=X_train.head(3))
    result = mlflow.models.evaluate(
        info.model_uri,
        X_test.assign(progression=y_test),
        targets="progression",
        model_type="regressor",
    )

for name, value in result.metrics.items():
    print(f"{name}: {value:.4f}")
uv run python evaluate_regressor.py
2026/11/21 17:52:02 INFO mlflow.tracking.fluent: Active model is set to the logged model with ID: m-efdb7e4071df4f1ba3e11d2a89539c4c
2026/11/21 17:52:02 INFO mlflow.tracking.fluent: Use `mlflow.set_active_model` to set the active model to a different one if needed.
2026/11/21 17:52:02 INFO mlflow.models.evaluation.default_evaluator: Testing metrics on first row...
2026/11/21 17:52:02 WARNING mlflow.models.evaluation.evaluators.shap: SHAP or matplotlib package is not installed, so model explainability insights will not be logged.
🏃 View run evaluate-linear at: http://127.0.0.1:8080/#/experiments/6/runs/c405c4547aa14fd7a61ed5e9c431d06b
🧪 View experiment at: http://127.0.0.1:8080/#/experiments/6
score: 0.3594
example_count: 111.0000
mean_absolute_error: 45.1206
mean_squared_error: 3180.1596
root_mean_squared_error: 56.3929
sum_on_target: 16957.0000
mean_on_target: 152.7658
r2_score: 0.3594
max_error: 162.4418
mean_absolute_percentage_error: 0.3796
Step 2: Read the Metrics
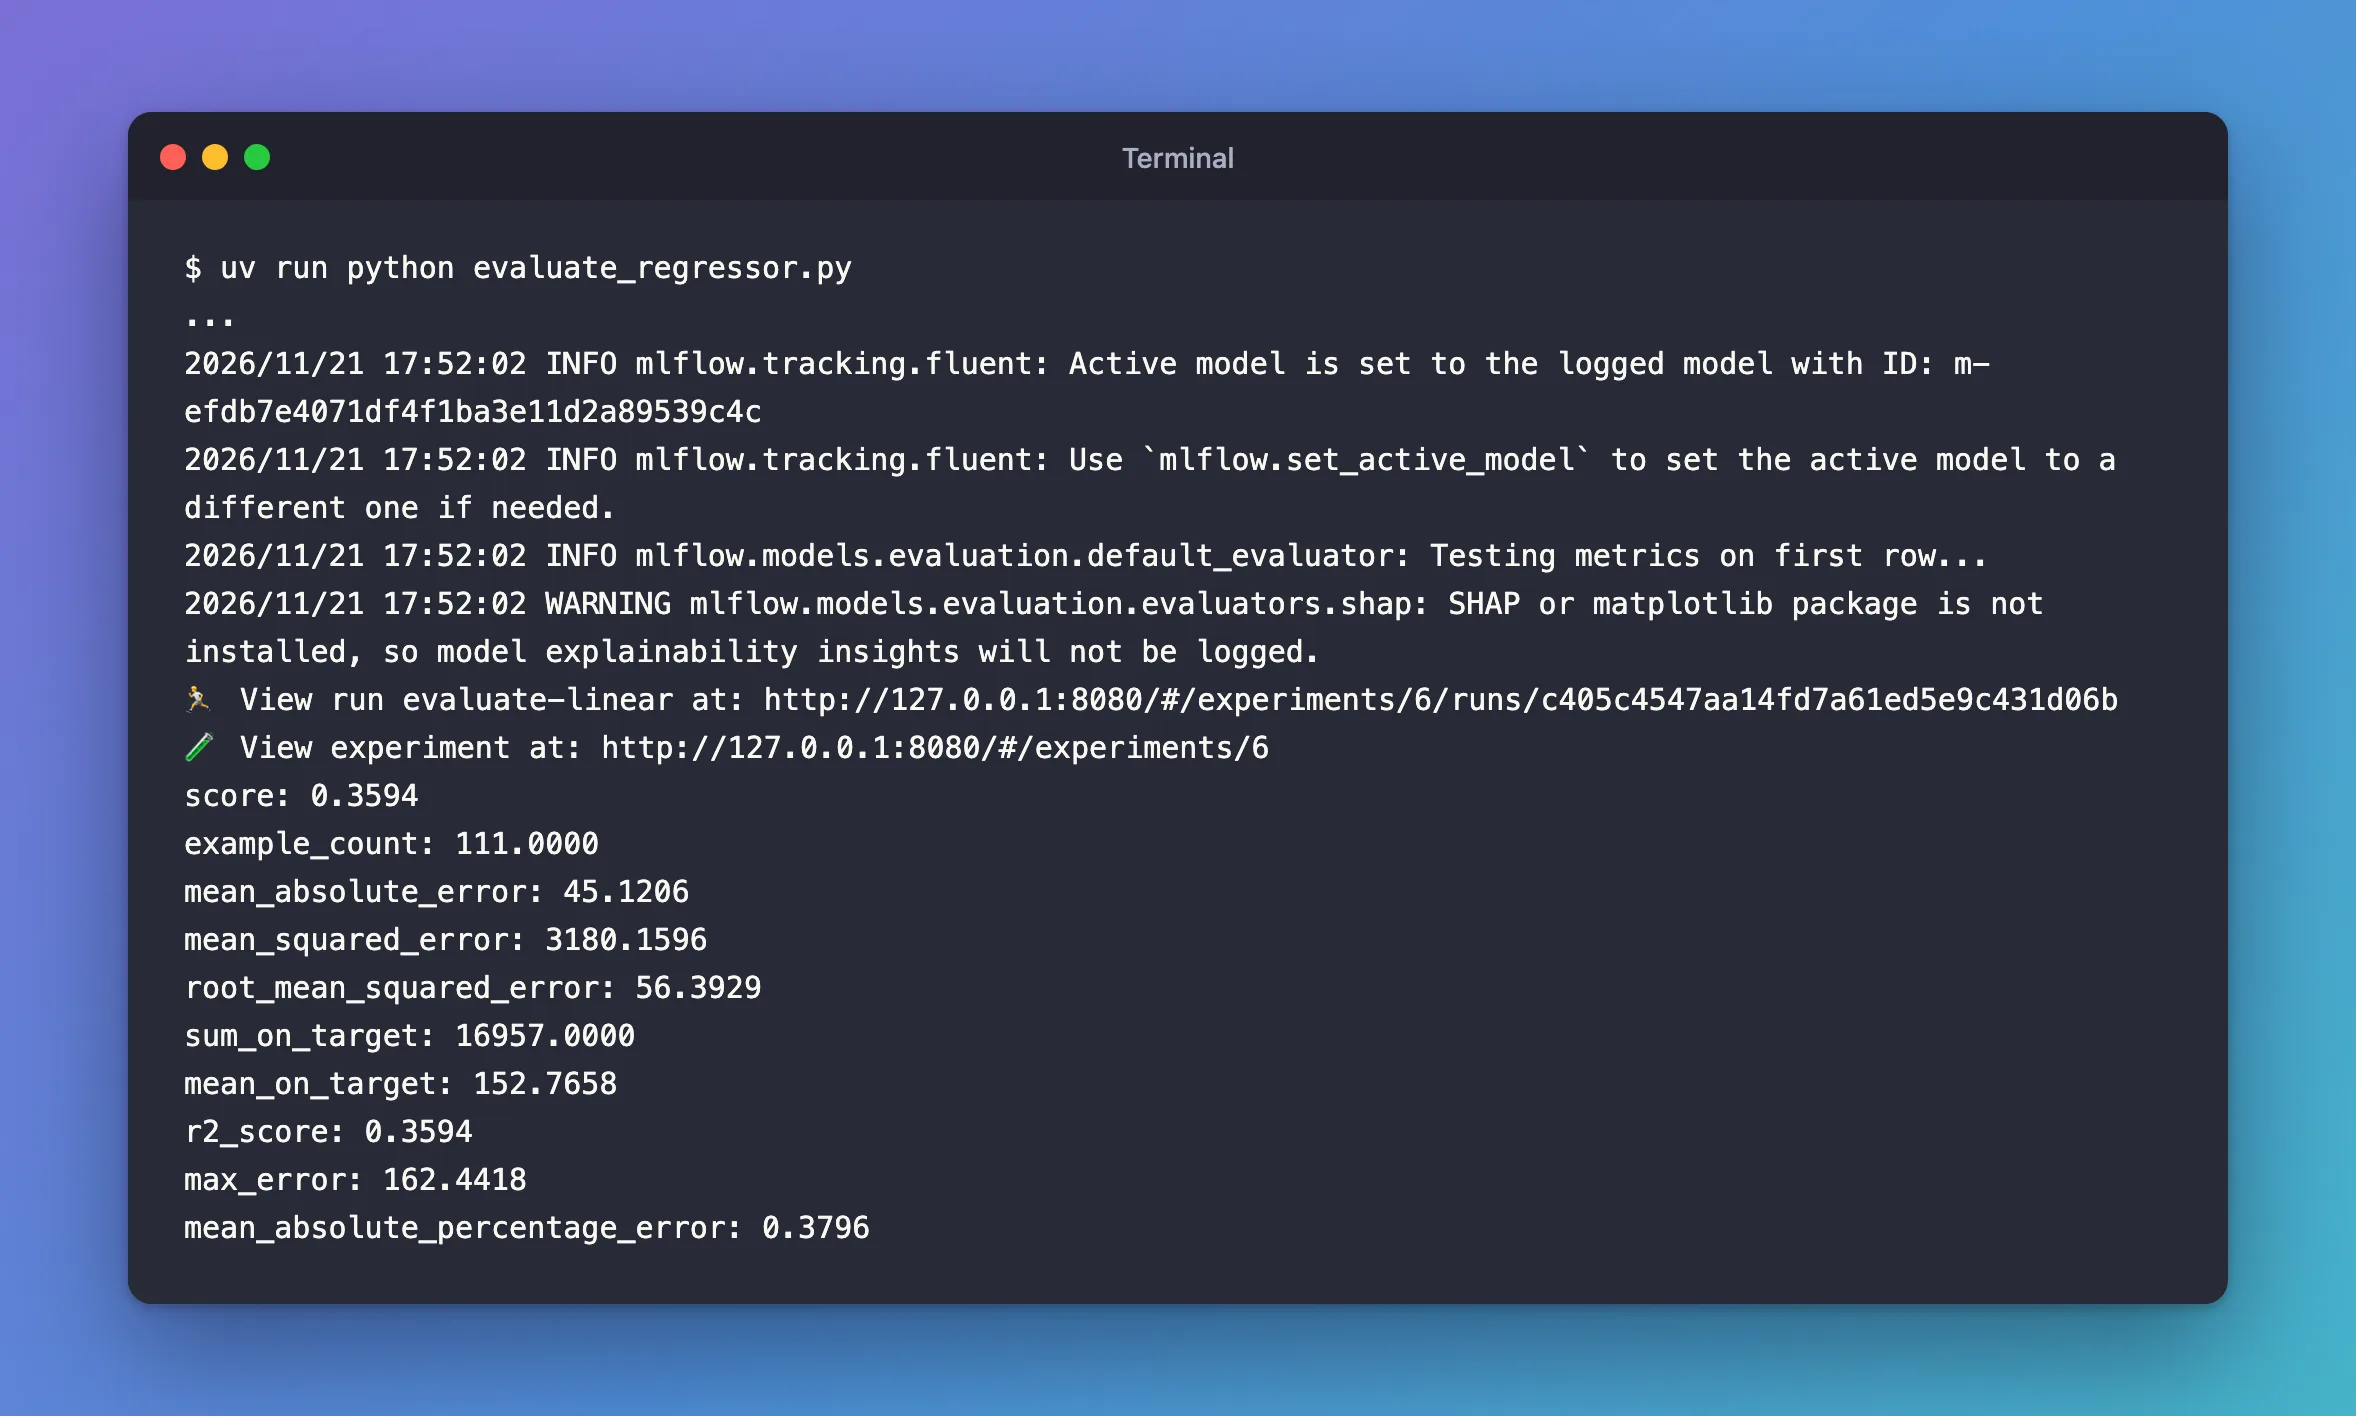
On the 111 test patients (example_count), whose true values average 152.8 (mean_on_target):
mean_absolute_error45.12: on average, a prediction is 45 points off.root_mean_squared_error56.39, the square root ofmean_squared_error3180.16: like the MAE, but large errors count more.max_error162.44: the worst single prediction.mean_absolute_percentage_error0.3796: about 38% off, relative to the true value.r2_score0.3594, andscore, the same from scikit-learn's ownmodel.score: the model explains about a third of the variation. How to Calculate MAE, RMSE and R² in scikit-learn explains these three.sum_on_target16957, the sum of the true values, which withexample_countgives their mean.
A regressor gets no plots: the five plots MLflow draws are classifier plots, and its regression plots come from SHAP, which isn't installed here, as the WARNING line says. How to Log SHAP Explanations with mlflow.models.evaluate adds them.
Common Mistakes
| Mistake | What happens | Do this instead |
|---|---|---|
| Reading MAPE when true values can be near zero | Tiny true values blow the percentage up | Read the MAE and RMSE, in the target's own units |
| Evaluating on the rows the model trained on | The errors look smaller than they will be | Keep test rows aside with train_test_split |
Troubleshooting
| Symptom | Likely cause | Fix |
|---|---|---|
SHAP or matplotlib package is not installed | No shap package | Fixed: SHAP or matplotlib package is not installed |
| No files on the run's Artifacts tab | A regressor without SHAP logs metrics only | Install shap, or add your own plot: How to Add a Custom Plot to an MLflow Evaluation |
FAQ
Which of these metrics should I watch?
The MAE for a plain "how far off", the RMSE when big misses hurt more, and R² to compare models on the same data.
Can I add a metric MLflow doesn't compute?
Yes, with make_metric: How to Add a Custom Metric to an MLflow Evaluation with make_metric.
Conclusion
mlflow.models.evaluate(..., model_type="regressor") scored the diabetes model on 111 test patients: 45 points off on average, 162 at worst, R² 0.36, all logged to the run and linked to the model.
Additional Resources
- mlflow.models.evaluate — the regressor's metrics and every option.
