How to Create a Measure in Power BI in the Browser

A measure is a named DAX calculation, such as a total or a count, that Power BI works out for whatever a visual shows: the whole table, one category, one month. You can add measures to a semantic model straight from the browser. Here's how.
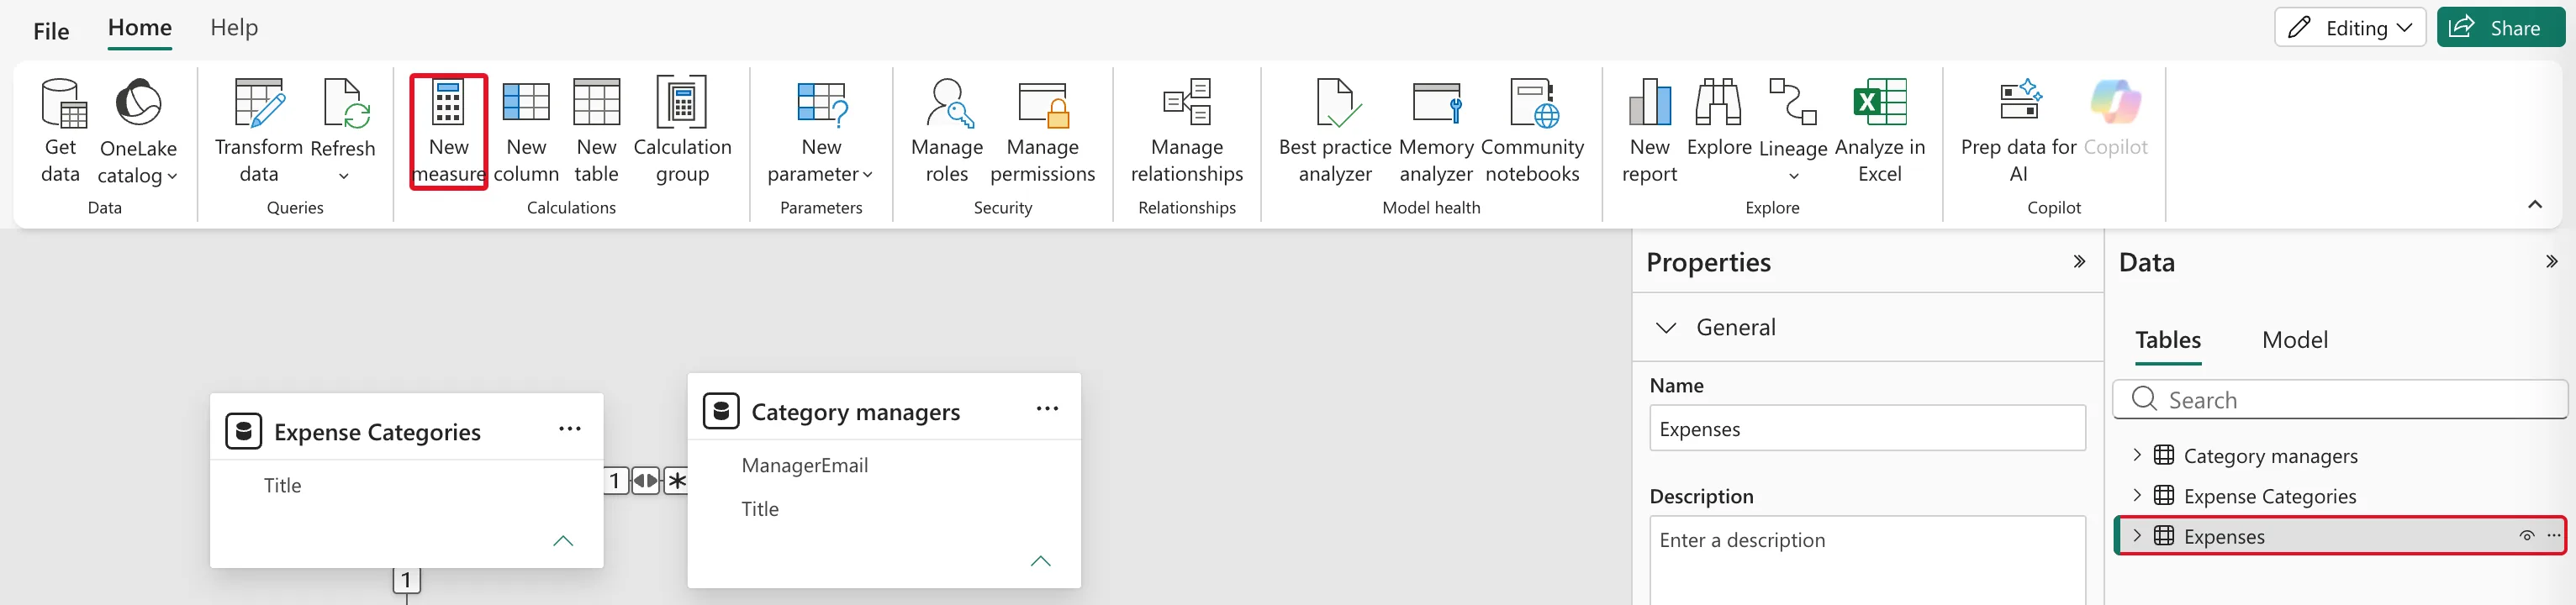
Microsoft's Edit semantic models in the Power BI service says to select the table in the Data pane and select the New measure button from the ribbon, then enter the measure in the formula bar. The example adds Total amount, the sum of the Amount column, to the Expenses table of a model of expense claims (How to Create a Semantic Model Without a Report in Power BI).
Step 1: Select the Table and New Measure
Open the model in Editing mode. In the Data pane, select the table the measure belongs to, here Expenses, then select New measure on the Home tab:
Step 2: Type the Formula
A formula bar appears above the diagram with Measure = selected:

Type over it. A measure is written as its name, an equals sign and a DAX formula:
Total amount = SUM(Expenses[Amount])
Total amountis the measure's name, as reports will show it. Names can have spaces.SUM(Expenses[Amount])adds up the Amount column of Expenses (How to Add Up a Column in Power BI with SUM).

Press Enter, or select the tick, to commit it. Esc or the cross cancels the edit: in the example, Esc threw the typed formula away.
Step 3: Find the Measure
The measure appears in the Data pane under its table, with a calculator icon, and the Properties pane shows its Name and Home table:
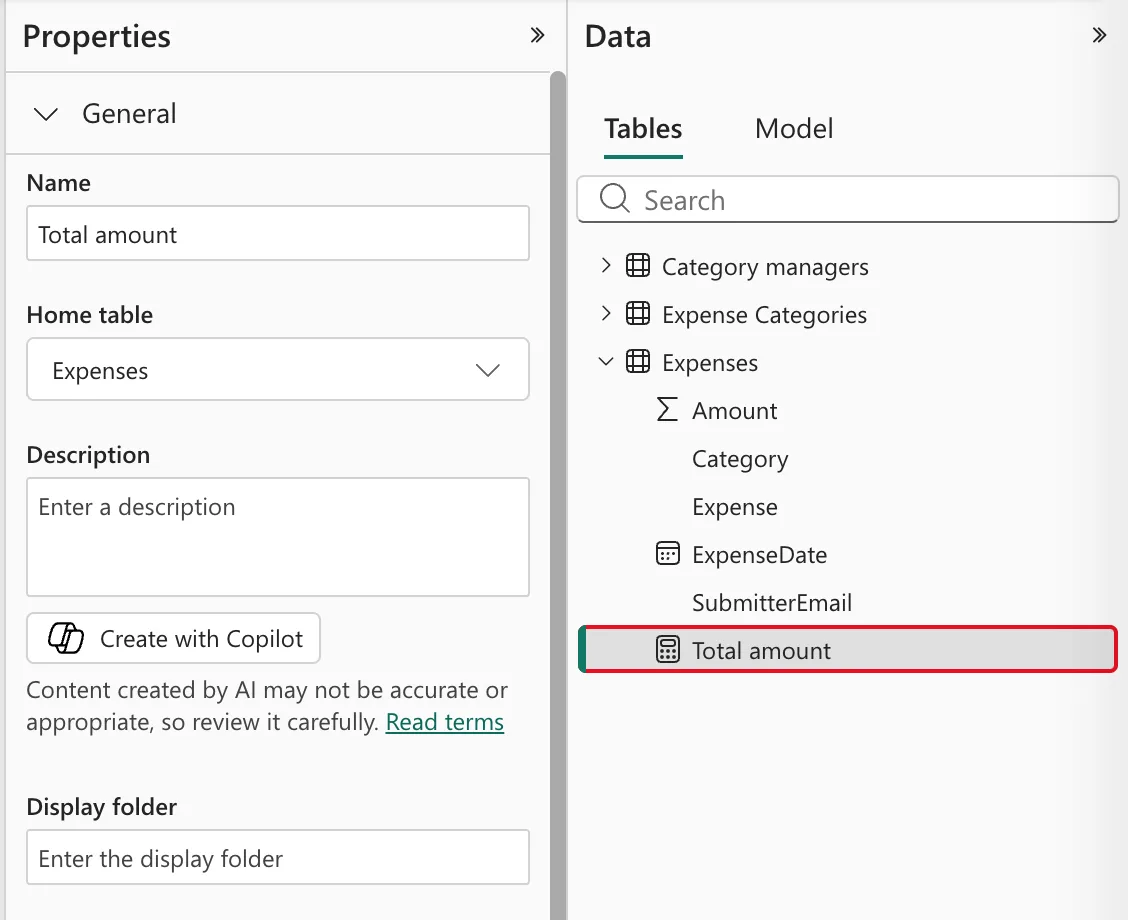
The model saves the measure at once. Reports built on the model can use it like a column, for example on a card (How to Add a Card to a Power BI Report).
Common Mistakes
| Mistake | What happens | Do this instead |
|---|---|---|
| Pressing Esc to finish | The formula is thrown away | Enter or the tick |
| A calculated column for a total | One value per row, not one for the visual | A measure |
| Leaving the name Measure | Reports show Measure | Type the name before the equals sign |
Troubleshooting
| Symptom | Likely cause | Fix |
|---|---|---|
| New measure is greyed out | The model is in Viewing mode | Switch to Editing |
| The formula is underlined in red | A typo, or a table or column name that doesn't exist | Check the names; table names with spaces need quotes, as in 'Expense Categories' |
| The measure shows too many decimals | Its format is the default | Set its format (How to Show a Measure with Two Decimal Places in Power BI) |
FAQ
What's the difference between a measure and a calculated column?
Microsoft's Measures in Power BI Desktop explains that a measure is calculated for the data a visual shows, while a calculated column stores a value for each row.
Can I move a measure to another table?
Yes: change Home table in its Properties.
Does the formula bar help with names?
Yes. Microsoft's article says the editor offers autocomplete as you type.
Conclusion
Select the table, New measure, type Name = formula and press Enter. The example's Total amount appeared under Expenses, ready for reports.
