How to Count Distinct Values in Power BI with DISTINCTCOUNT

DISTINCTCOUNT counts how many different values a column holds. Five expense claims from four people have five rows but four people, and DISTINCTCOUNT is how you count the people. Here's its general form and that example.
Syntax
DISTINCTCOUNT(<column>)
From Microsoft's DISTINCTCOUNT function reference:
<column>: the column that contains the values to be counted. The reference says the only argument allowed to this function is a column, of any type.- The result is the number of distinct values in column, or BLANK when there are no rows to count.
- Blank counts as a value. The reference says DISTINCTCOUNT function counts the BLANK value; DISTINCTCOUNTNOBLANK skips it.
The example is a measure on the Expenses table of a semantic model with five approved expense claims. Its SubmitterEmail column holds who made each claim: one person made two of them.
Step 1: Create the Measure
Select the Expenses table and New measure (How to Create a Measure in Power BI in the Browser), and enter:
People = DISTINCTCOUNT(Expenses[SubmitterEmail])
Peopleis the measure's name.Expenses[SubmitterEmail]is the column whose different values are counted. An email identifies a person better than a name, which two people can share.

Press Enter.
Step 2: Show It on a Card
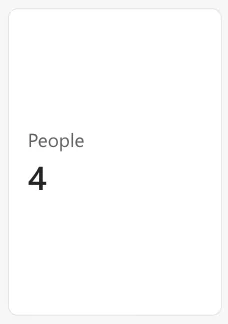
On a card (How to Add a Card to a Power BI Report), People shows 4, while the five rows would give 5 with COUNTROWS:
Common Mistakes
| Mistake | What happens | Do this instead |
|---|---|---|
| Counting people with COUNTROWS | Someone with two claims counts twice | DISTINCTCOUNT on a column that identifies them |
| Counting names instead of emails | Two people with the same name count once | A unique column, such as the email |
| Adding up per-category distinct counts | The sum is higher than the real total | Let the measure work out the total itself |
Troubleshooting
| Symptom | Likely cause | Fix |
|---|---|---|
| The count is one higher than expected | A blank value is counted | DISTINCTCOUNTNOBLANK |
| The total row is less than the sum of its lines | Expected: the same person appears in several lines | Nothing to fix; the reference explains it |
| The card shows (Blank) | The filters leave no rows | Expected |
FAQ
Why isn't the total the sum of the categories?
The reference's section Understanding distinct count totals says distinct count totals are not additive: one person with claims in two categories counts once in each category, and once in the total.
Can I count distinct values of two columns together?
Not with DISTINCTCOUNT, which takes one column.
Conclusion
DISTINCTCOUNT(Table[Column]) counts the different values in a column. The example's People = DISTINCTCOUNT(Expenses[SubmitterEmail]) showed 4 people behind 5 claims.
