How to Compare Runs in the MLflow UI

Tracking runs pays off when you compare them: which settings gave the lowest error, and was the extra training time worth it? The MLflow UI gives you a runs table you can filter and sort, a chart view, and a Compare page with four plots and side-by-side tables. This guide uses all of them on four real runs, with screenshots from MLflow 3.18.0.
Syntax
Most of this guide is clicks. The one thing you type is a query in the runs page's search box, and it follows this form:
<prefix>.<name> <comparator> <value>
| Part | What it means |
|---|---|
<prefix> | What to filter on: metrics, params or tags |
<name> | The name it was logged with, such as r2 or n_estimators |
<comparator> | Metrics are numbers, so =, !=, >, >=, < and <= all work. Parameters and tags are stored as text, so they take =, !=, LIKE and ILIKE |
<value> | A number for a metric; text in quotes for a parameter or tag, such as "300" |
Join conditions with and, as in metrics.r2 > 0.8 and params.max_depth = "None". OR isn't supported.
Prerequisites
- A tracking server with a few finished runs that logged parameters and metrics. This guide uses the four house-price runs from Part 1, Step 14 of the MLflow series; any runs with parameters and metrics work the same way.
- The MLflow UI open in your browser: How to Open the MLflow UI and Find Your Runs.
The four runs are random forests that predict house values. They differ in two settings, the number of trees (n_estimators) and how deep each tree may grow (max_depth), and each logged three error scores: mae, rmse (lower is better) and r2 (higher is better).
Step 1: Show Metrics and Parameters as Columns
Open the experiment, here house-price-prediction. The runs table starts with names, times and sources, not results. Click Columns:
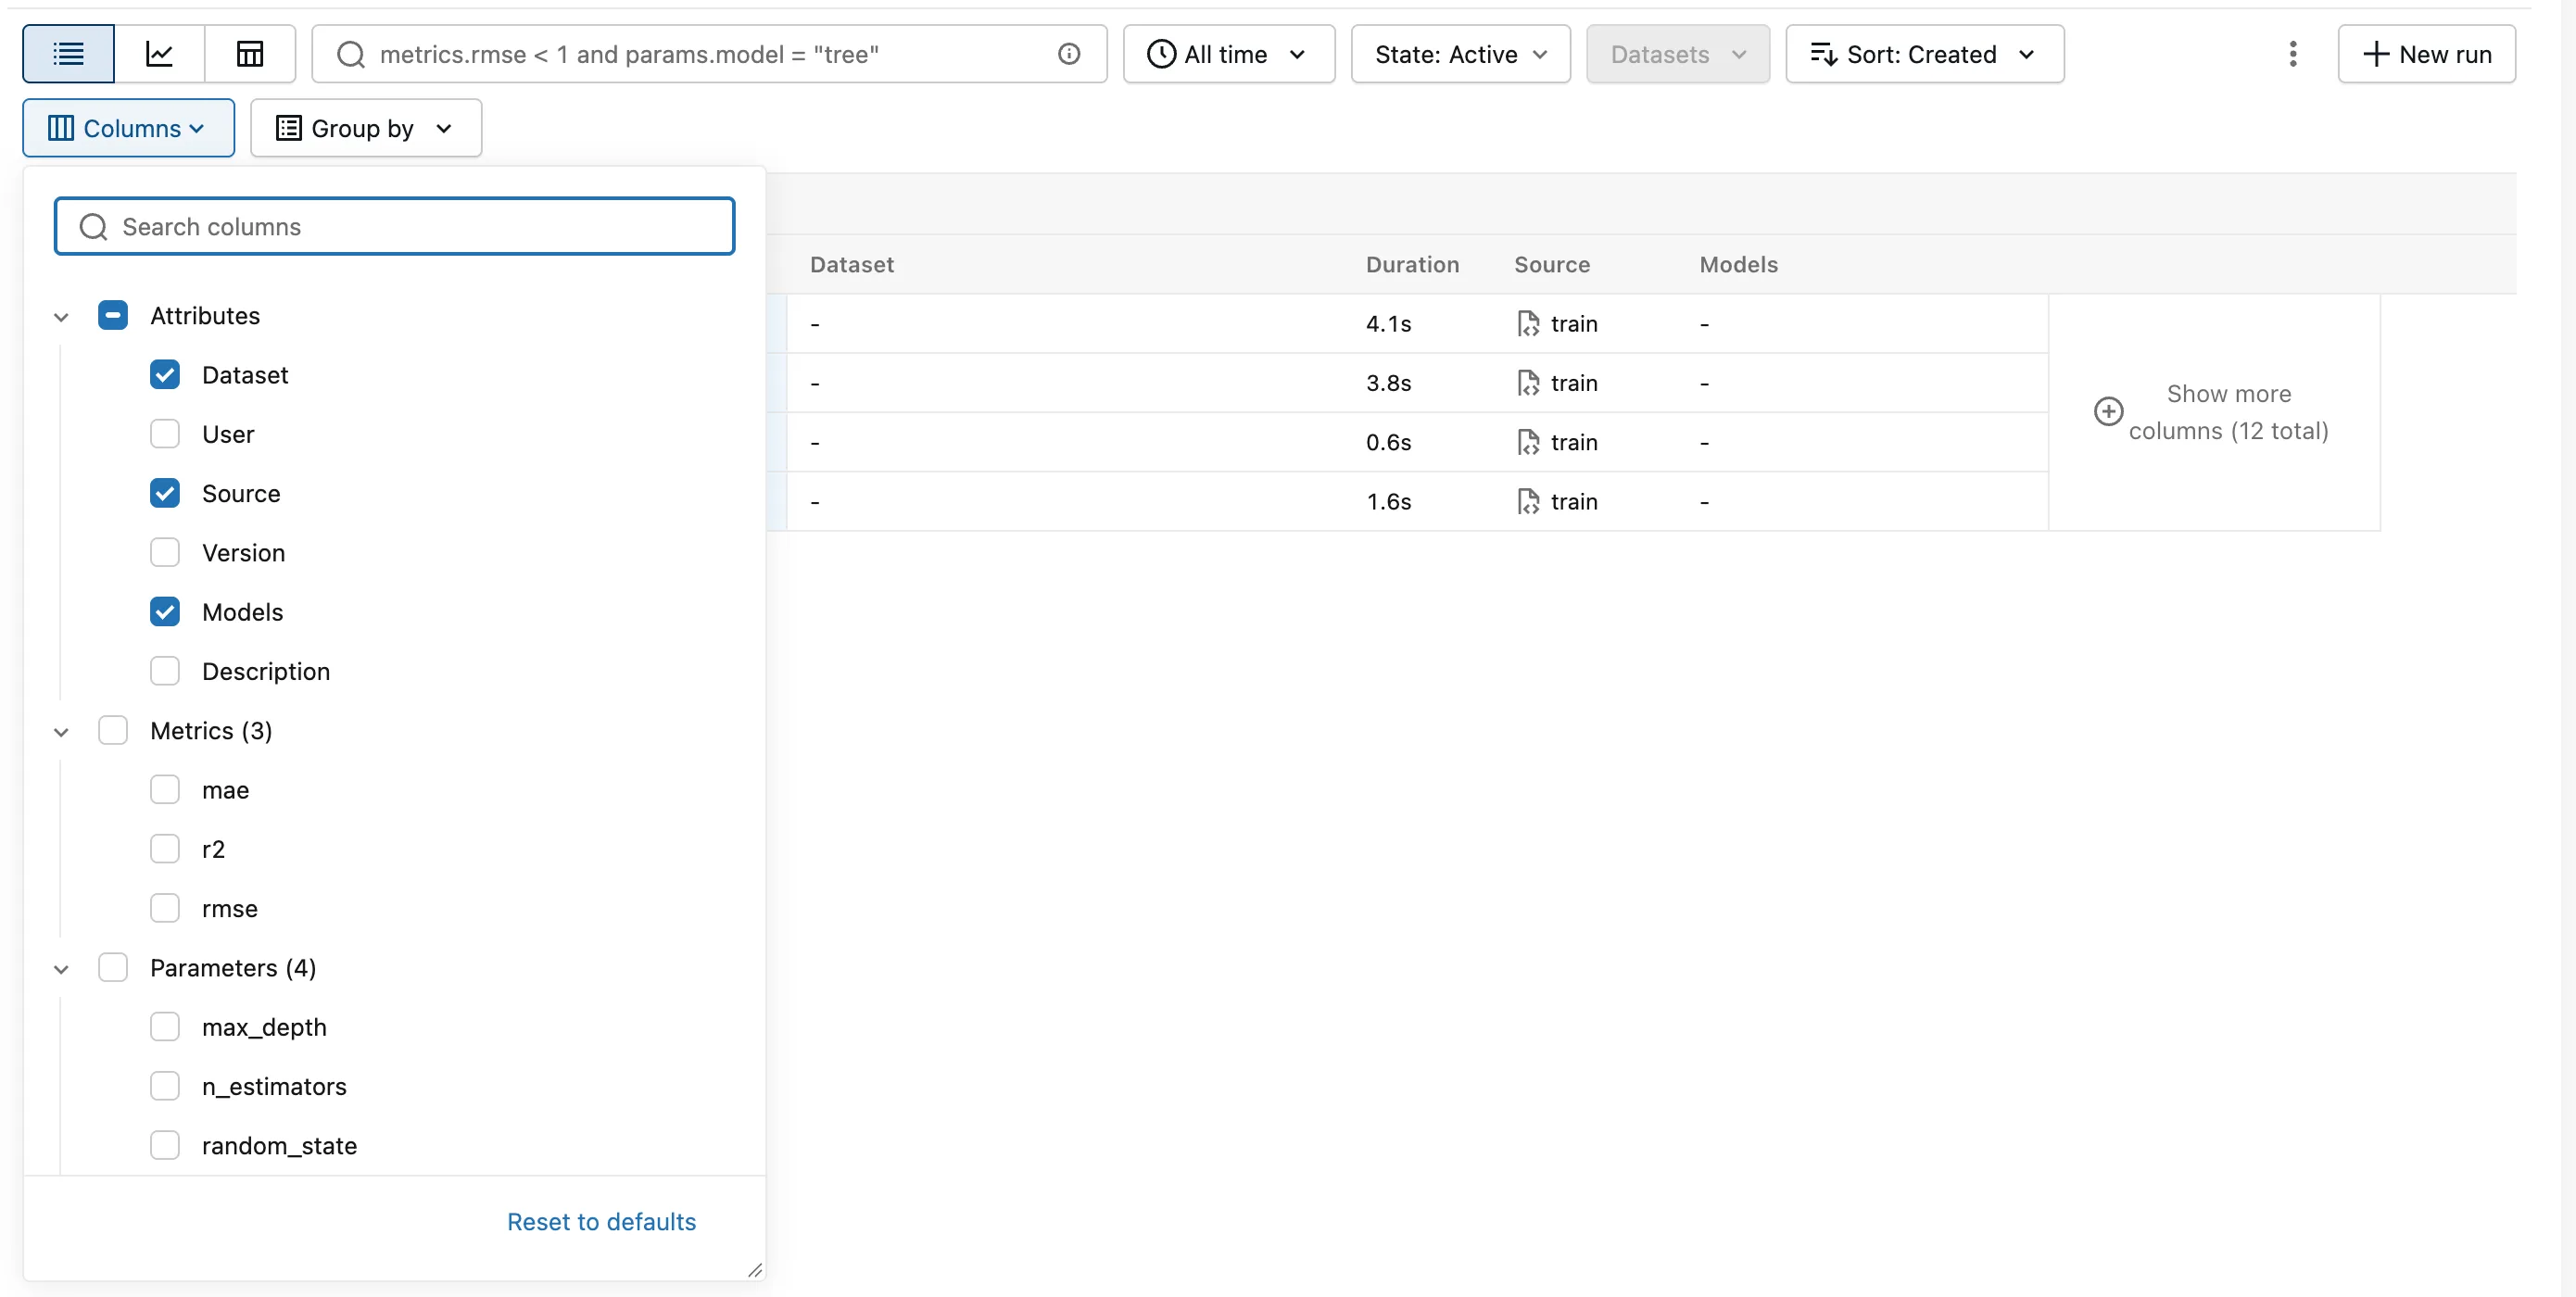
The menu lists every column the runs have, in groups: Attributes, Metrics, Parameters and, further down, Tags. Tick mae, r2 and rmse under Metrics and max_depth and n_estimators under Parameters, then untick Dataset, Source and Models to make room. Each run's results now sit next to its settings:
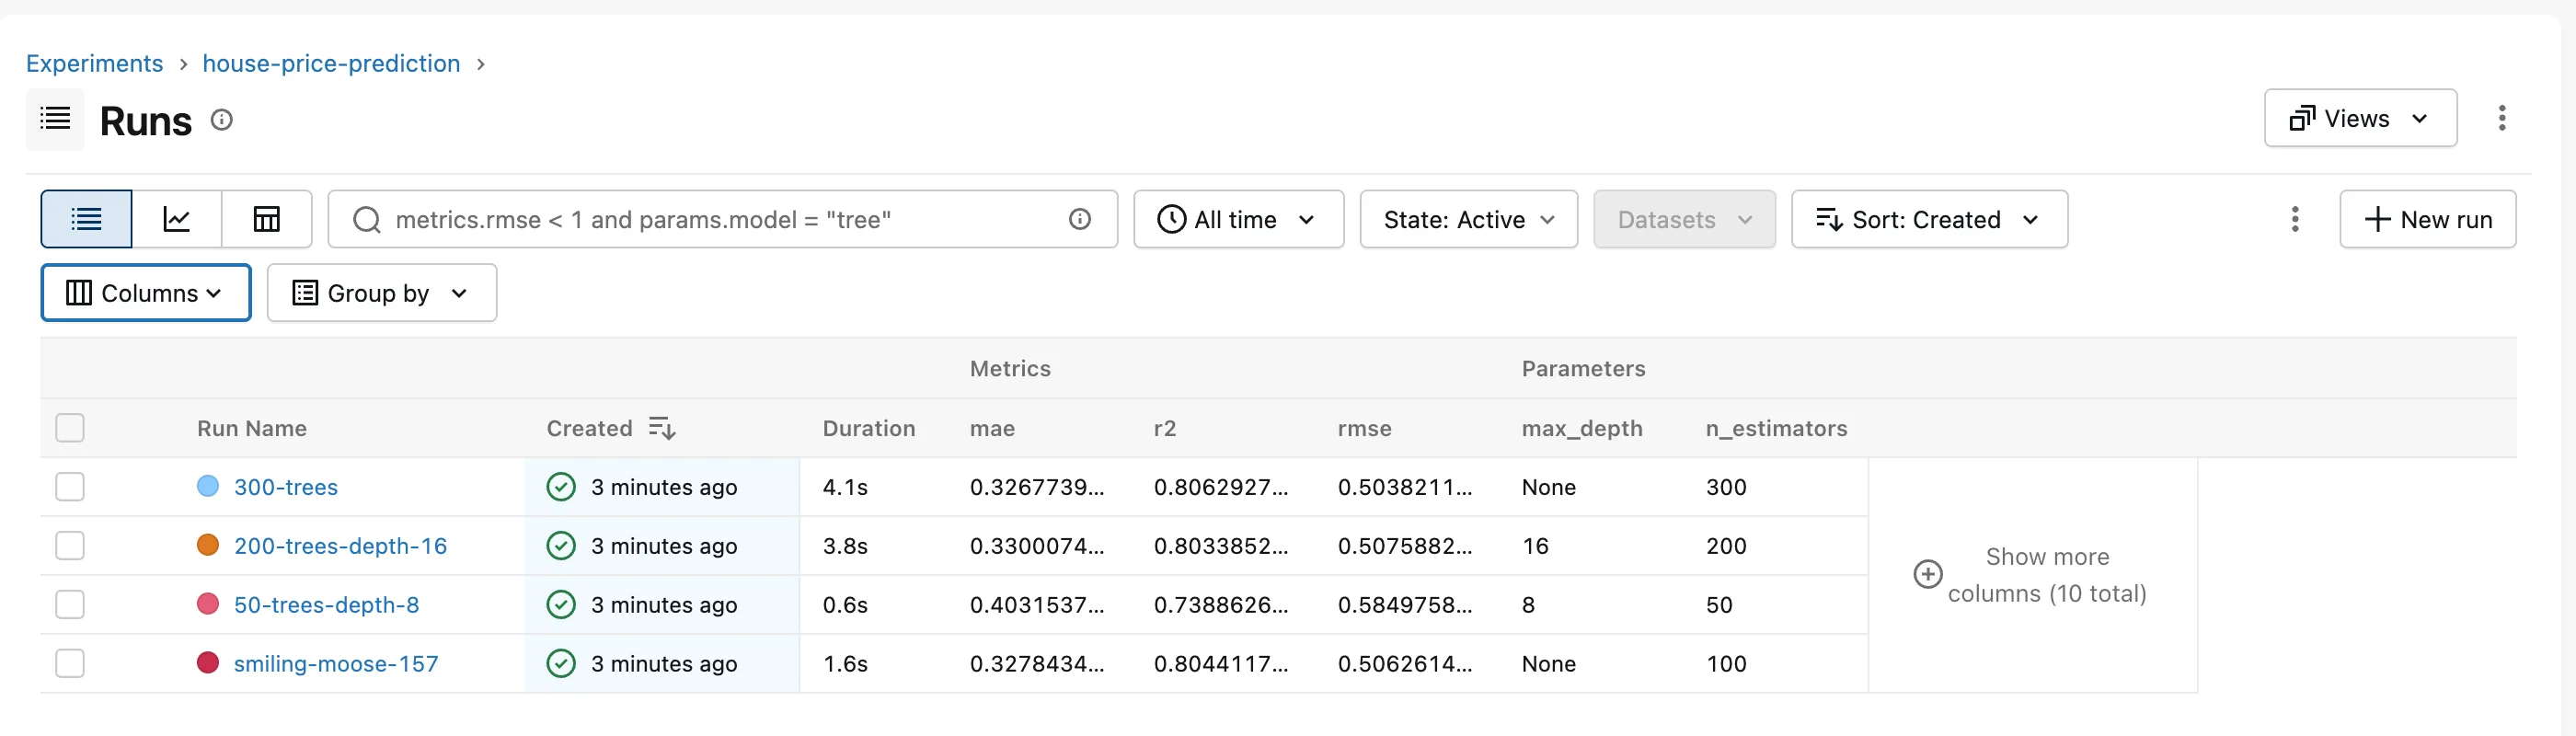
Long numbers are cut to fit, such as 0.8062927…. The Compare page in Step 5 shows them rounded.
Step 2: Filter Runs with a Search Query
Type a query into the search box and press Enter. To keep only the runs that explain more than 80% of the variation in house prices:
metrics.r2 > 0.8

Three runs match; 50-trees-depth-8, with an r2 of 0.739, is gone. The ✕ in the search box clears the filter.
Each query follows the syntax at the top of this page. Here's what each one keeps from the four runs:
| Query | Runs it keeps |
|---|---|
metrics.r2 > 0.8 | 300-trees, 200-trees-depth-16, smiling-moose-157 |
metrics.rmse < 0.506 | 300-trees |
params.n_estimators = "300" | 300-trees |
metrics.r2 > 0.8 and params.max_depth = "None" | 300-trees, smiling-moose-157 |
tags.model_type = "random_forest" | All four |
> or <params.n_estimators > "100" doesn't filter anything: the table shows Request error with Invalid comparator '>' not one of …. The cause and the fix are in Fixed: "Invalid comparator '>' not one of" When You Search MLflow Runs by a Parameter.
Step 3: Sort by a Metric
Keep metrics.r2 > 0.8 in the search box. Click Sort: Created and choose rmse. That sorts the highest error first, so open the menu again and click the ↑ button, Sort ascending:
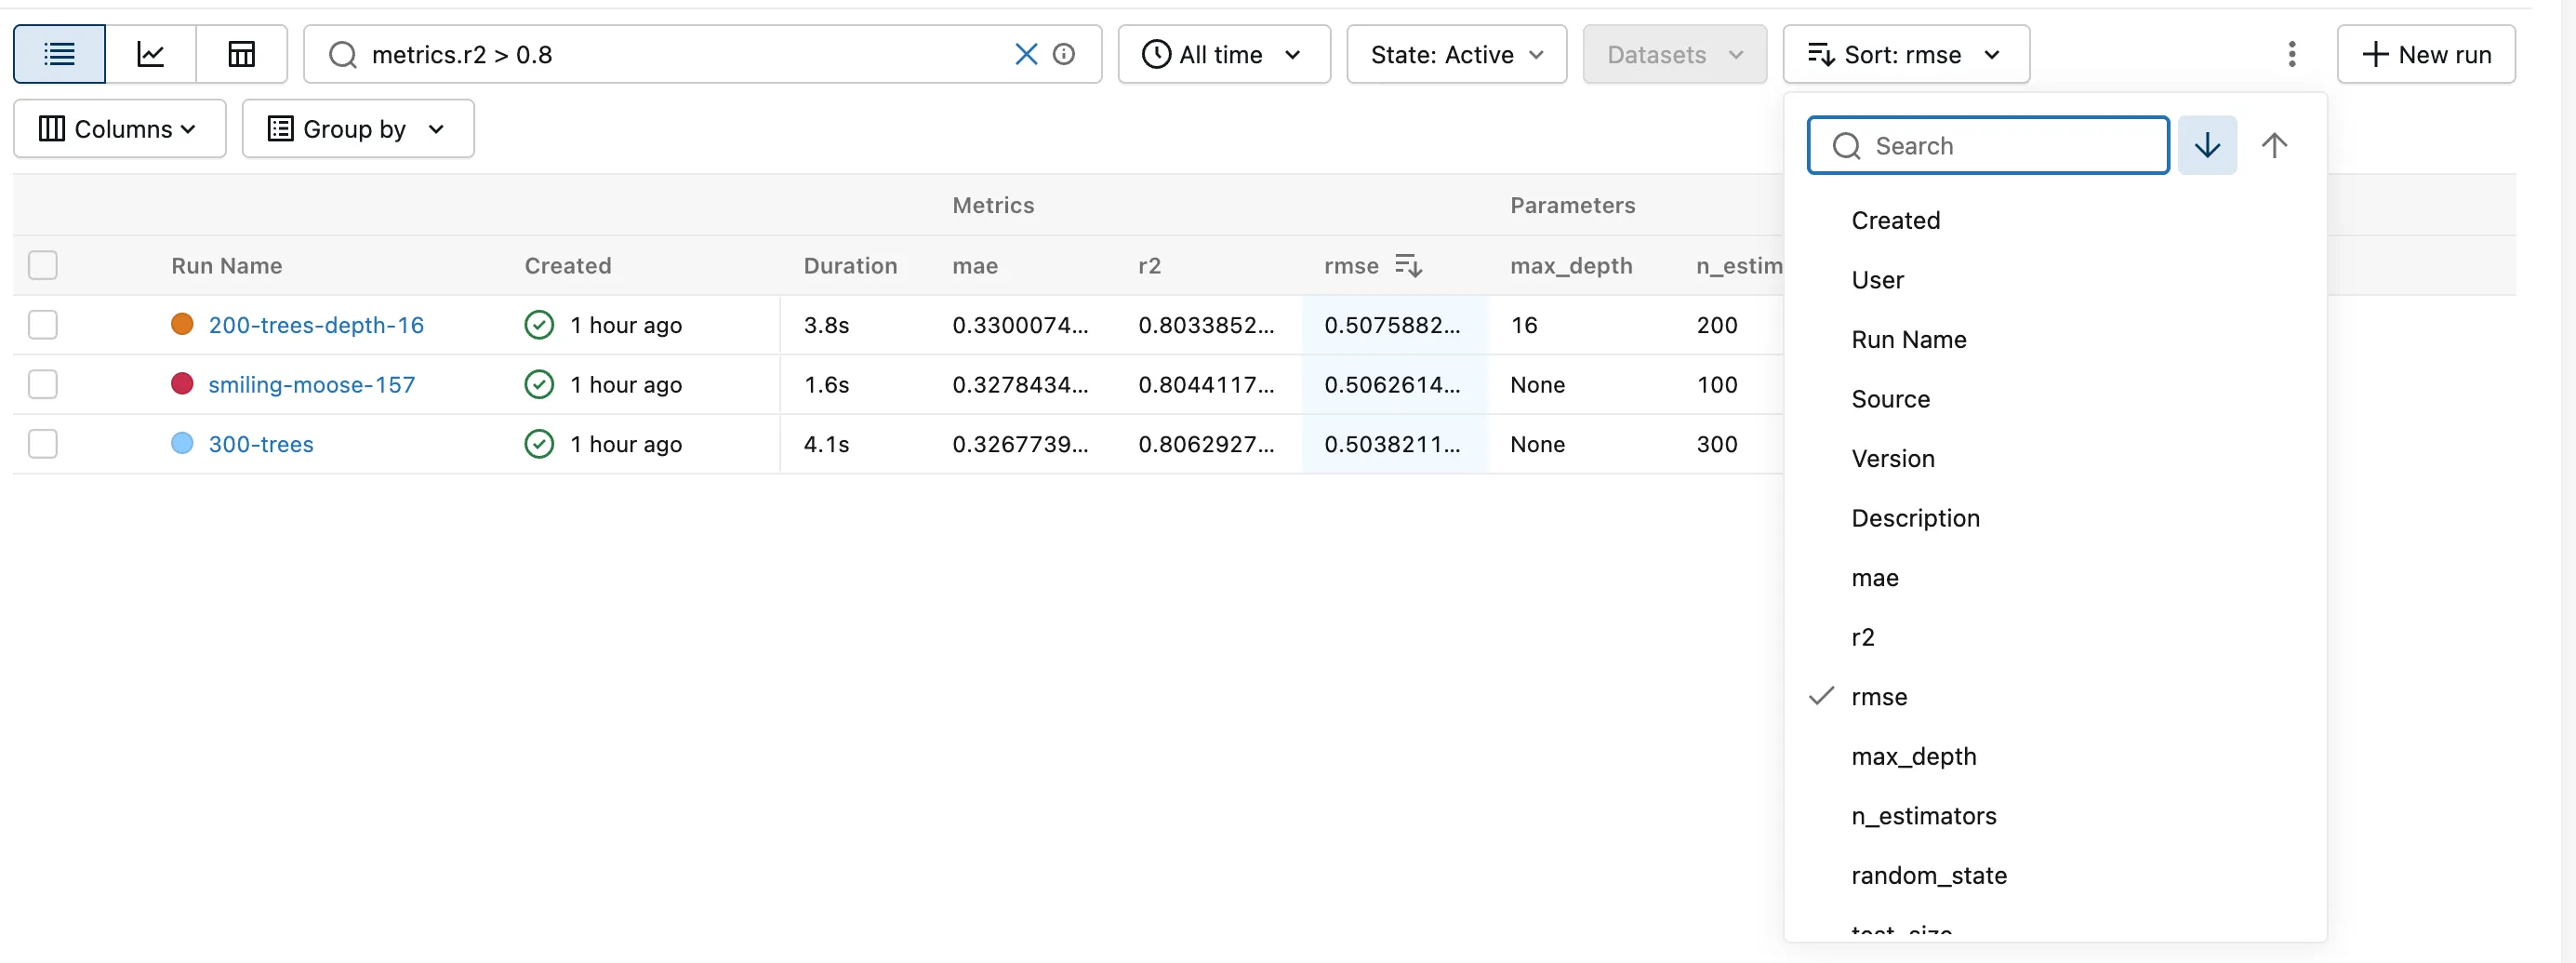
The best run is now on top:

Clicking a column header, such as rmse, also sorts by that column.
Step 4: See the Runs as Charts
Click the chart icon, the second button left of the search box. Each metric becomes a bar chart with one bar per run, in the run's color:
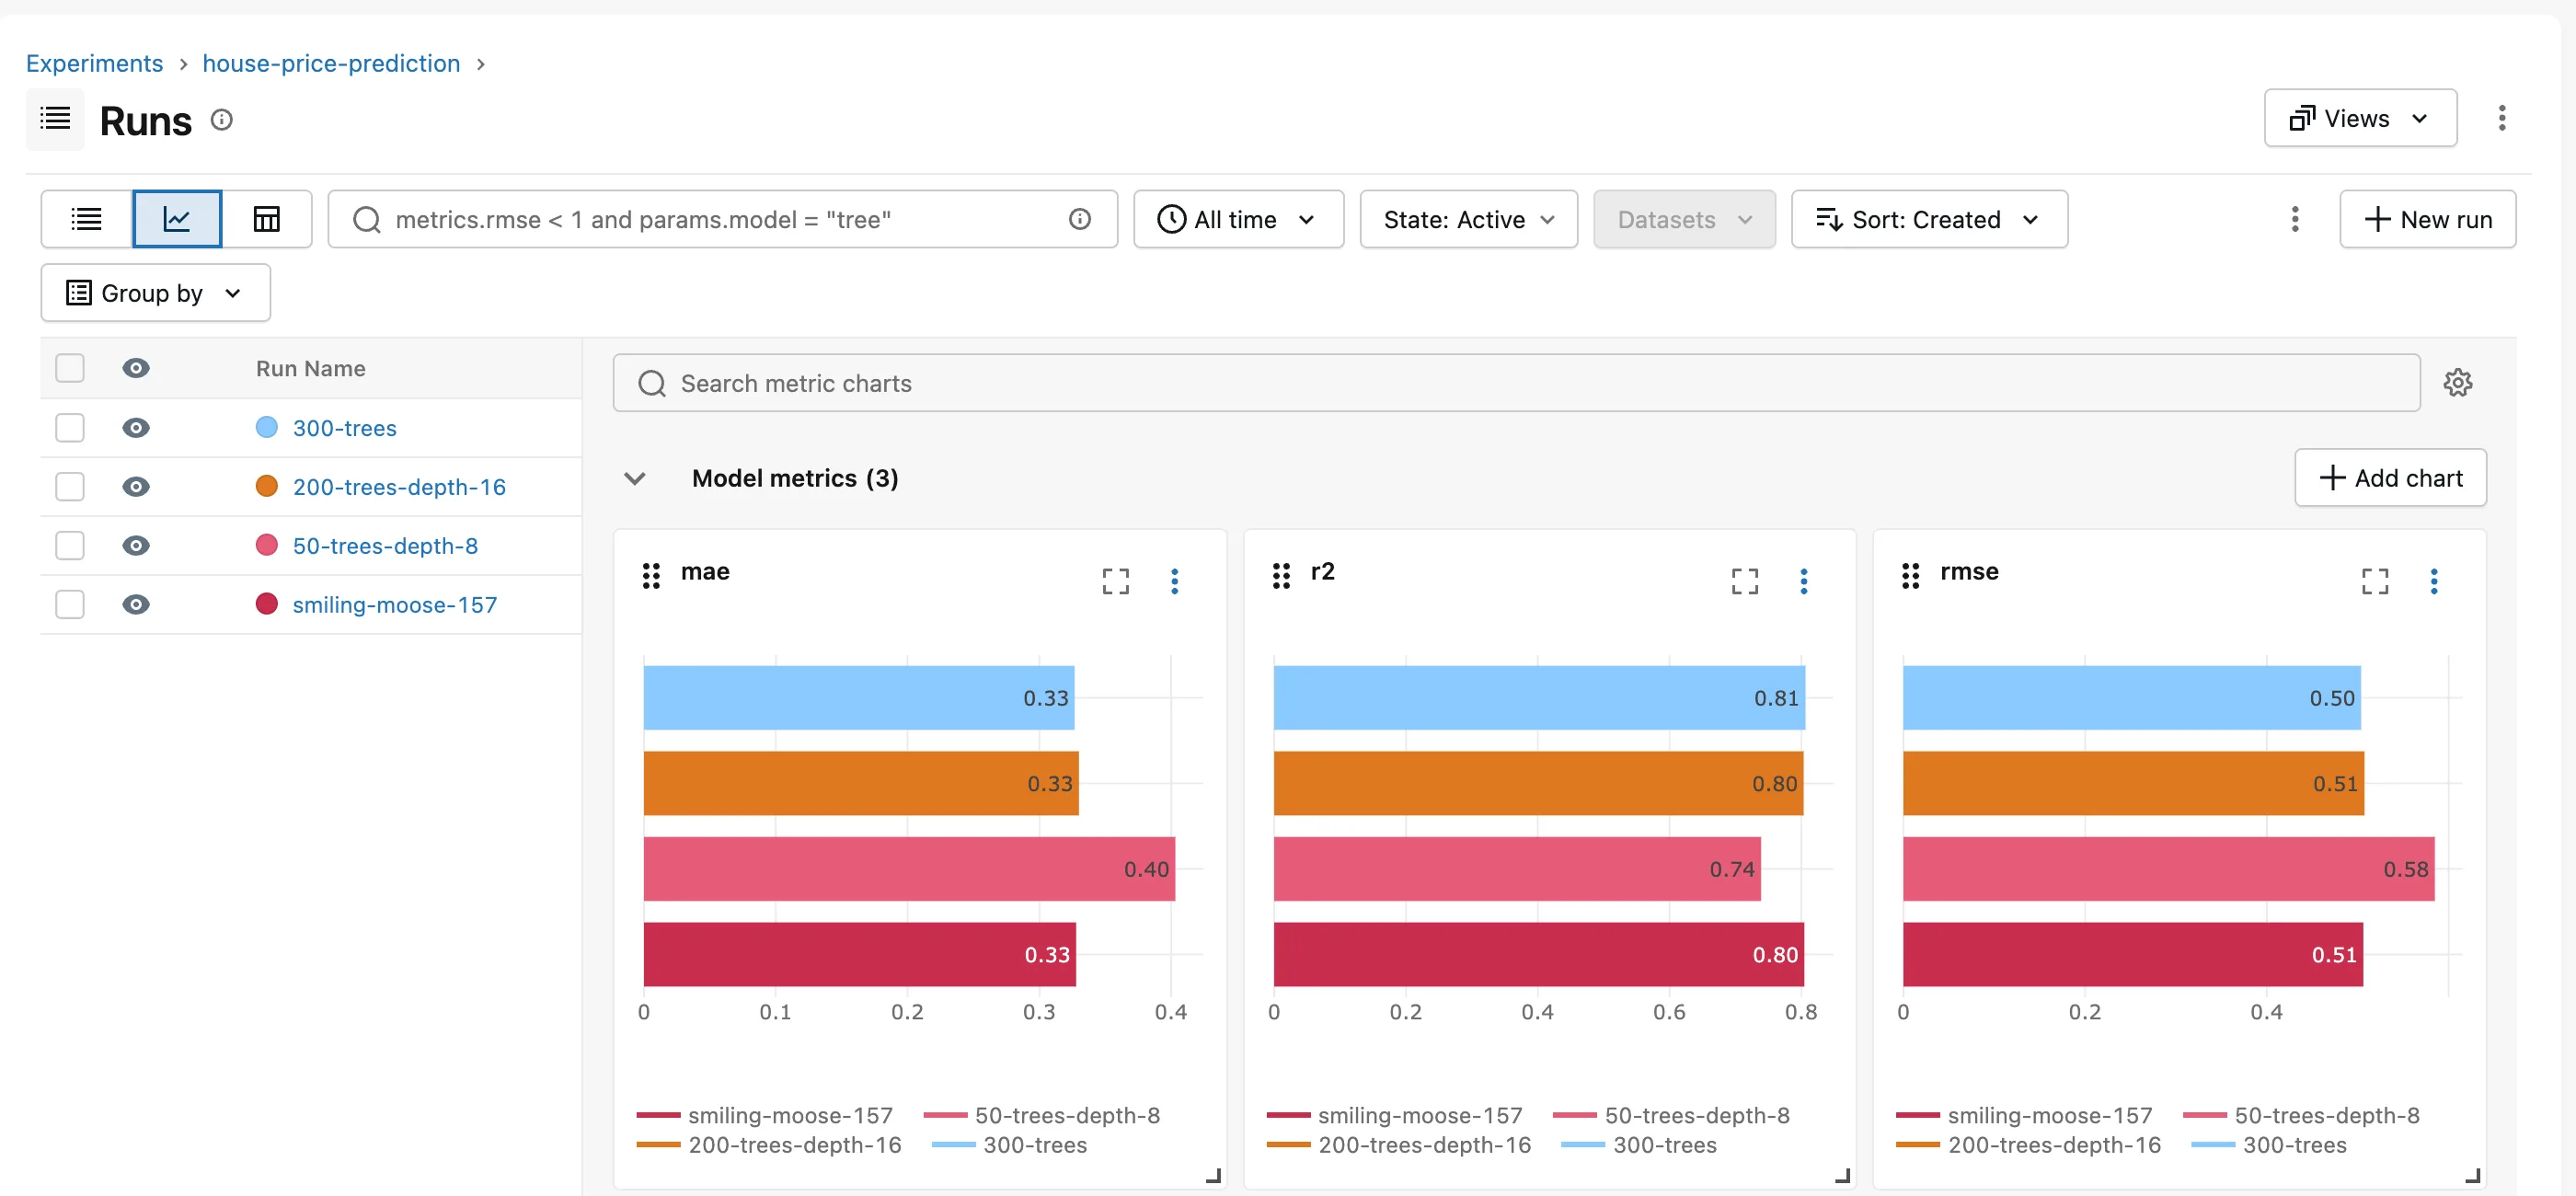
The odd one out is easy to spot: 50-trees-depth-8 has the longest error bars and the shortest r2 bar. The first icon brings the table back.
Step 5: Select Runs and Open the Compare Page
Back in the table, clear the search and tick the runs to compare. The box in the header row ticks them all. The toolbar changes to Rename, Delete, Compare and Add tags:

With one run ticked, Compare is greyed out, because a comparison needs at least two; with all four ticked, Rename is. Delete sits right next to Compare, so click carefully. Click Compare.
Step 6: Read the Parallel Coordinates Plot
The page is titled Comparing 4 Runs from 1 Experiment, with four plots under Visualizations. The first one, the Parallel Coordinates Plot, shows every run's settings and result at once:
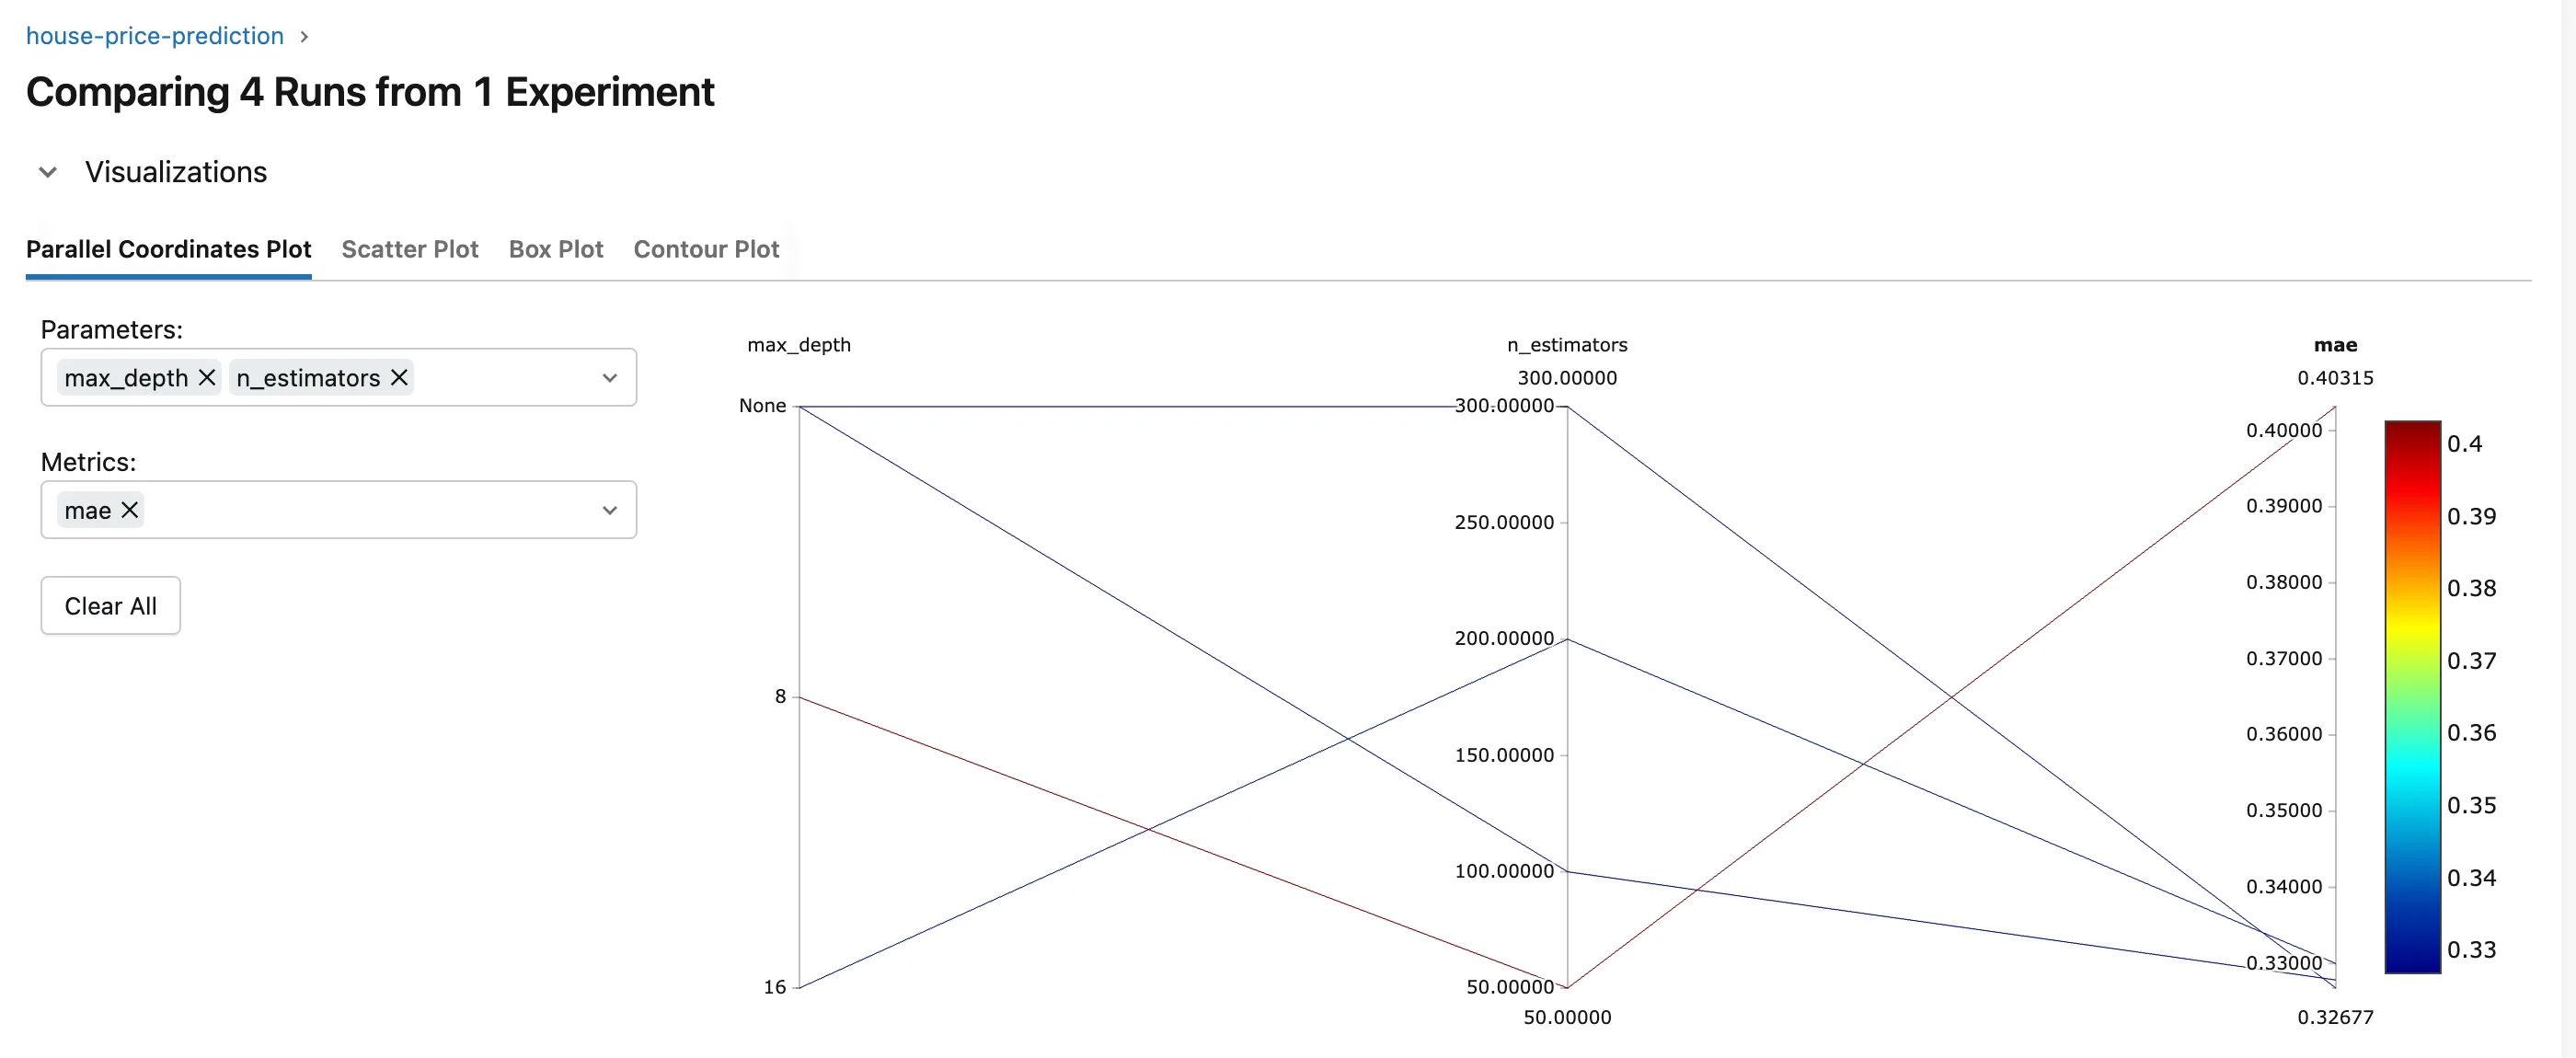
- Each line is one run. It crosses one axis per parameter, here
max_depthandn_estimators, and ends on the metric, heremae. - The color comes from the metric: dark blue for the lowest error, red for the highest. The one red line is
50-trees-depth-8: depth 8, 50 trees, anmaeof 0.403. - The Parameters and Metrics boxes choose the axes. Clear All empties them.
Step 7: Plot One Setting Against a Result
Open the Scatter Plot tab and choose n_estimators for the X-axis and rmse for the Y-axis:
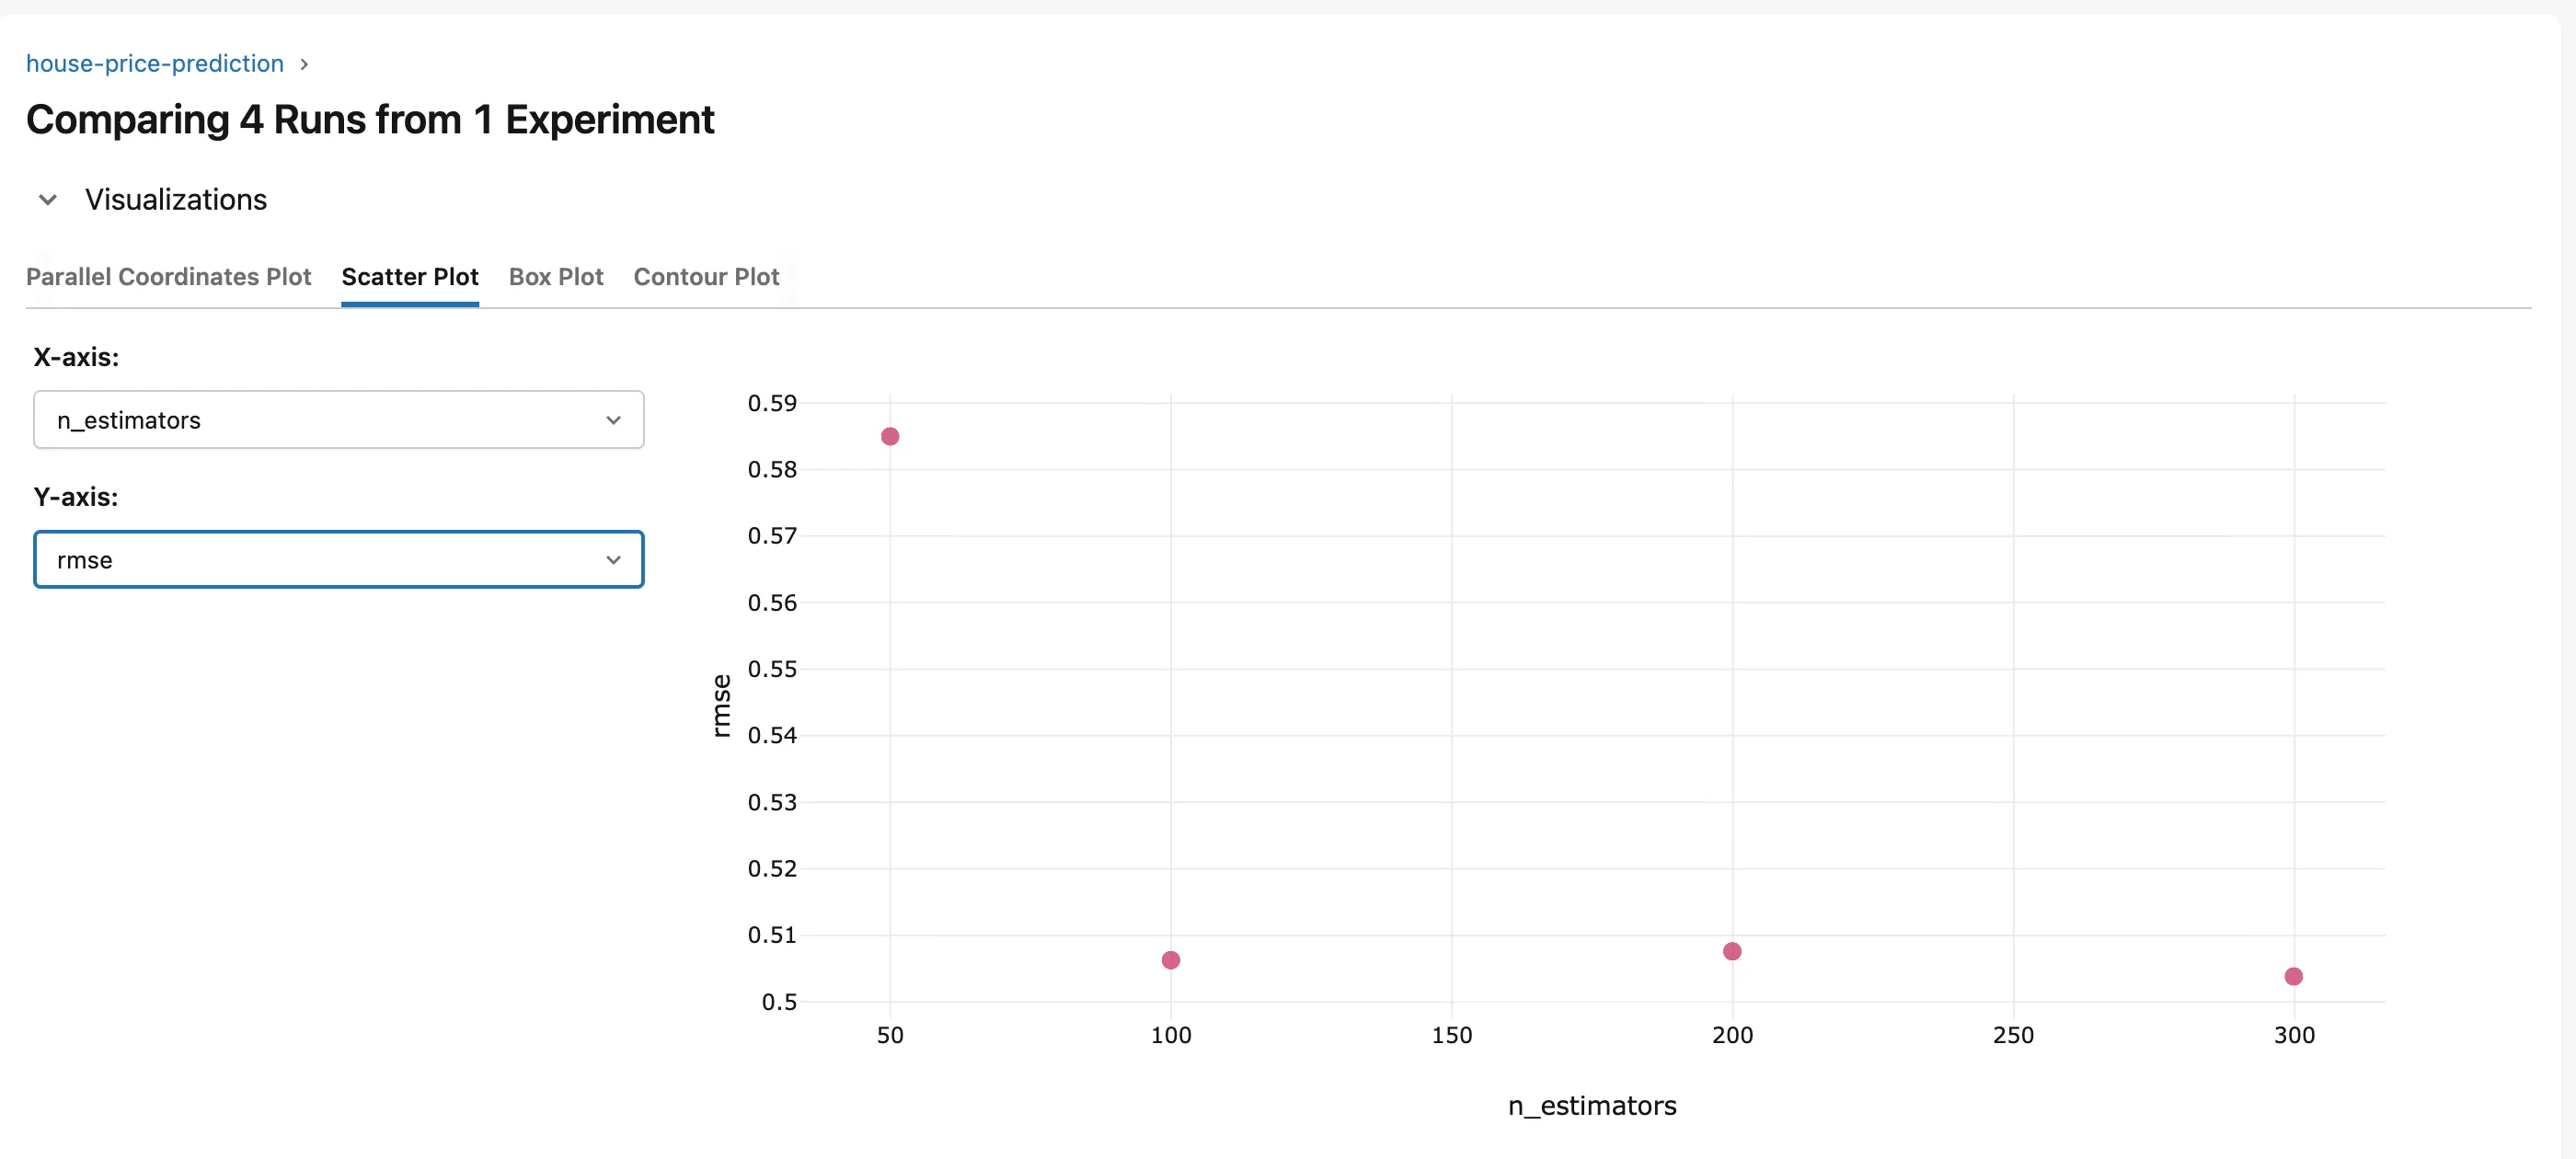
Each dot is a run. The 50-tree run, which was also limited to a depth of 8, sits far above the rest; 100, 200 and 300 trees all land near 0.505.
Step 8: Try the Box and Contour Plots
The Box Plot groups runs that share a parameter value. Choose max_depth for the X-axis and rmse for the Y-axis:
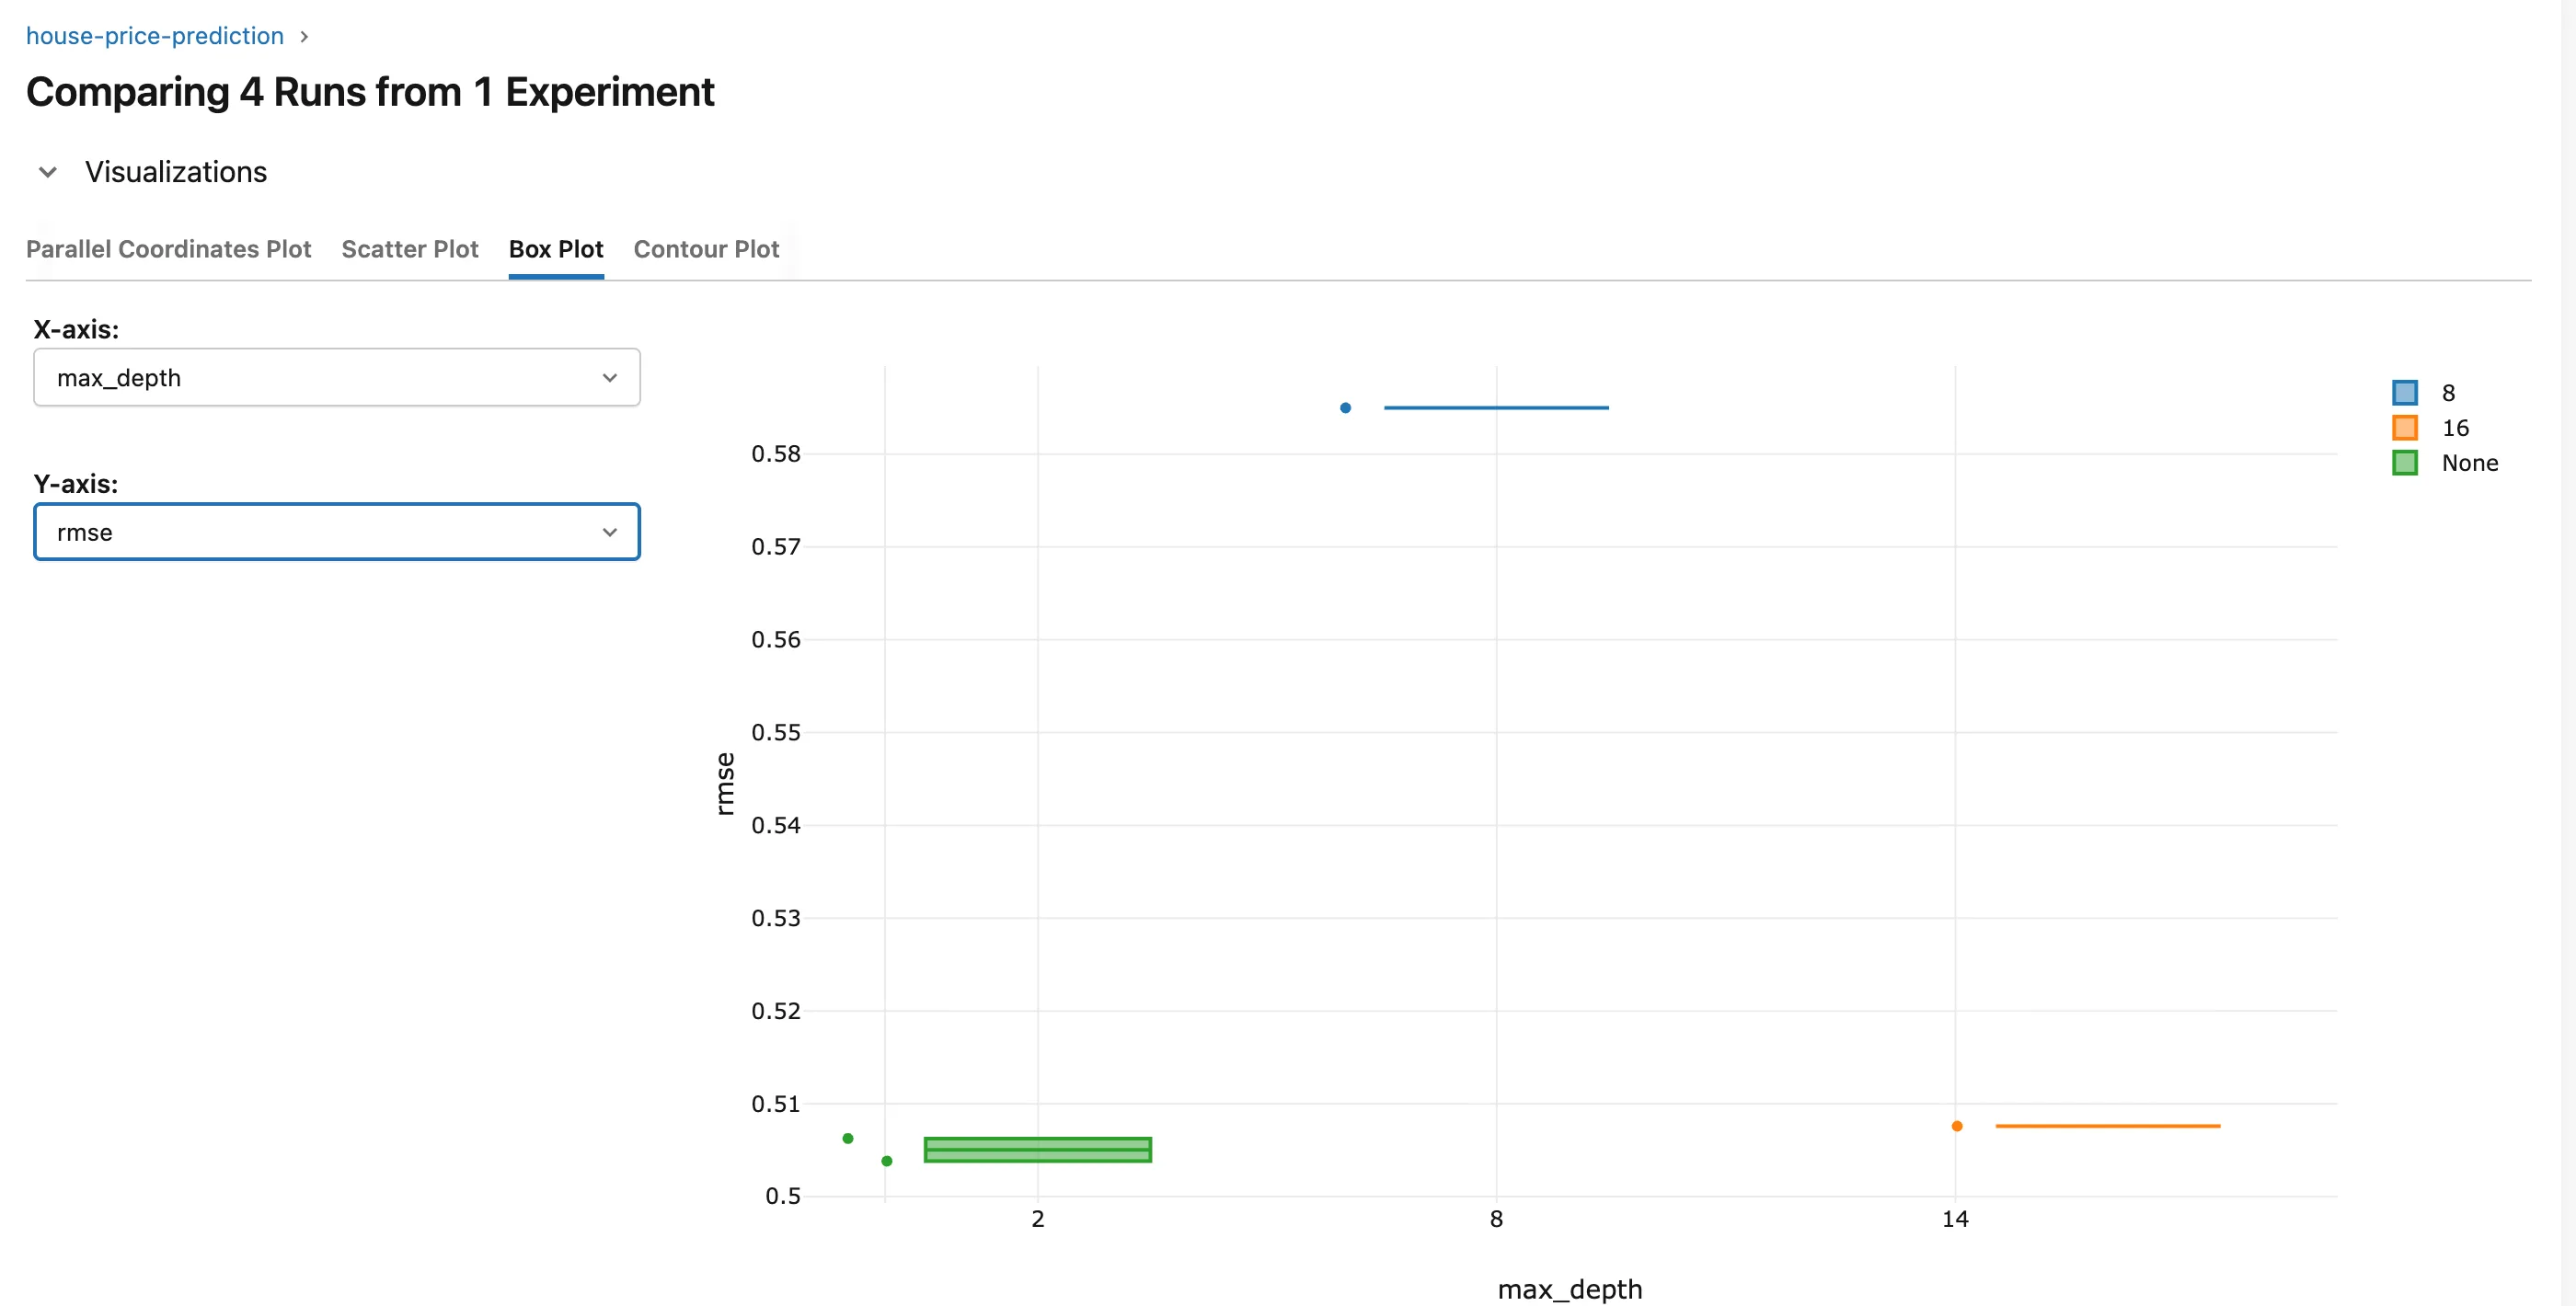
Each max_depth value gets a box in the legend's color. With only one or two runs per value, the boxes are thin; the plot becomes useful when many runs share each value, as in a hyperparameter search.
The Contour Plot draws a result over two numeric settings. With these four runs, it shows a message instead of a plot:
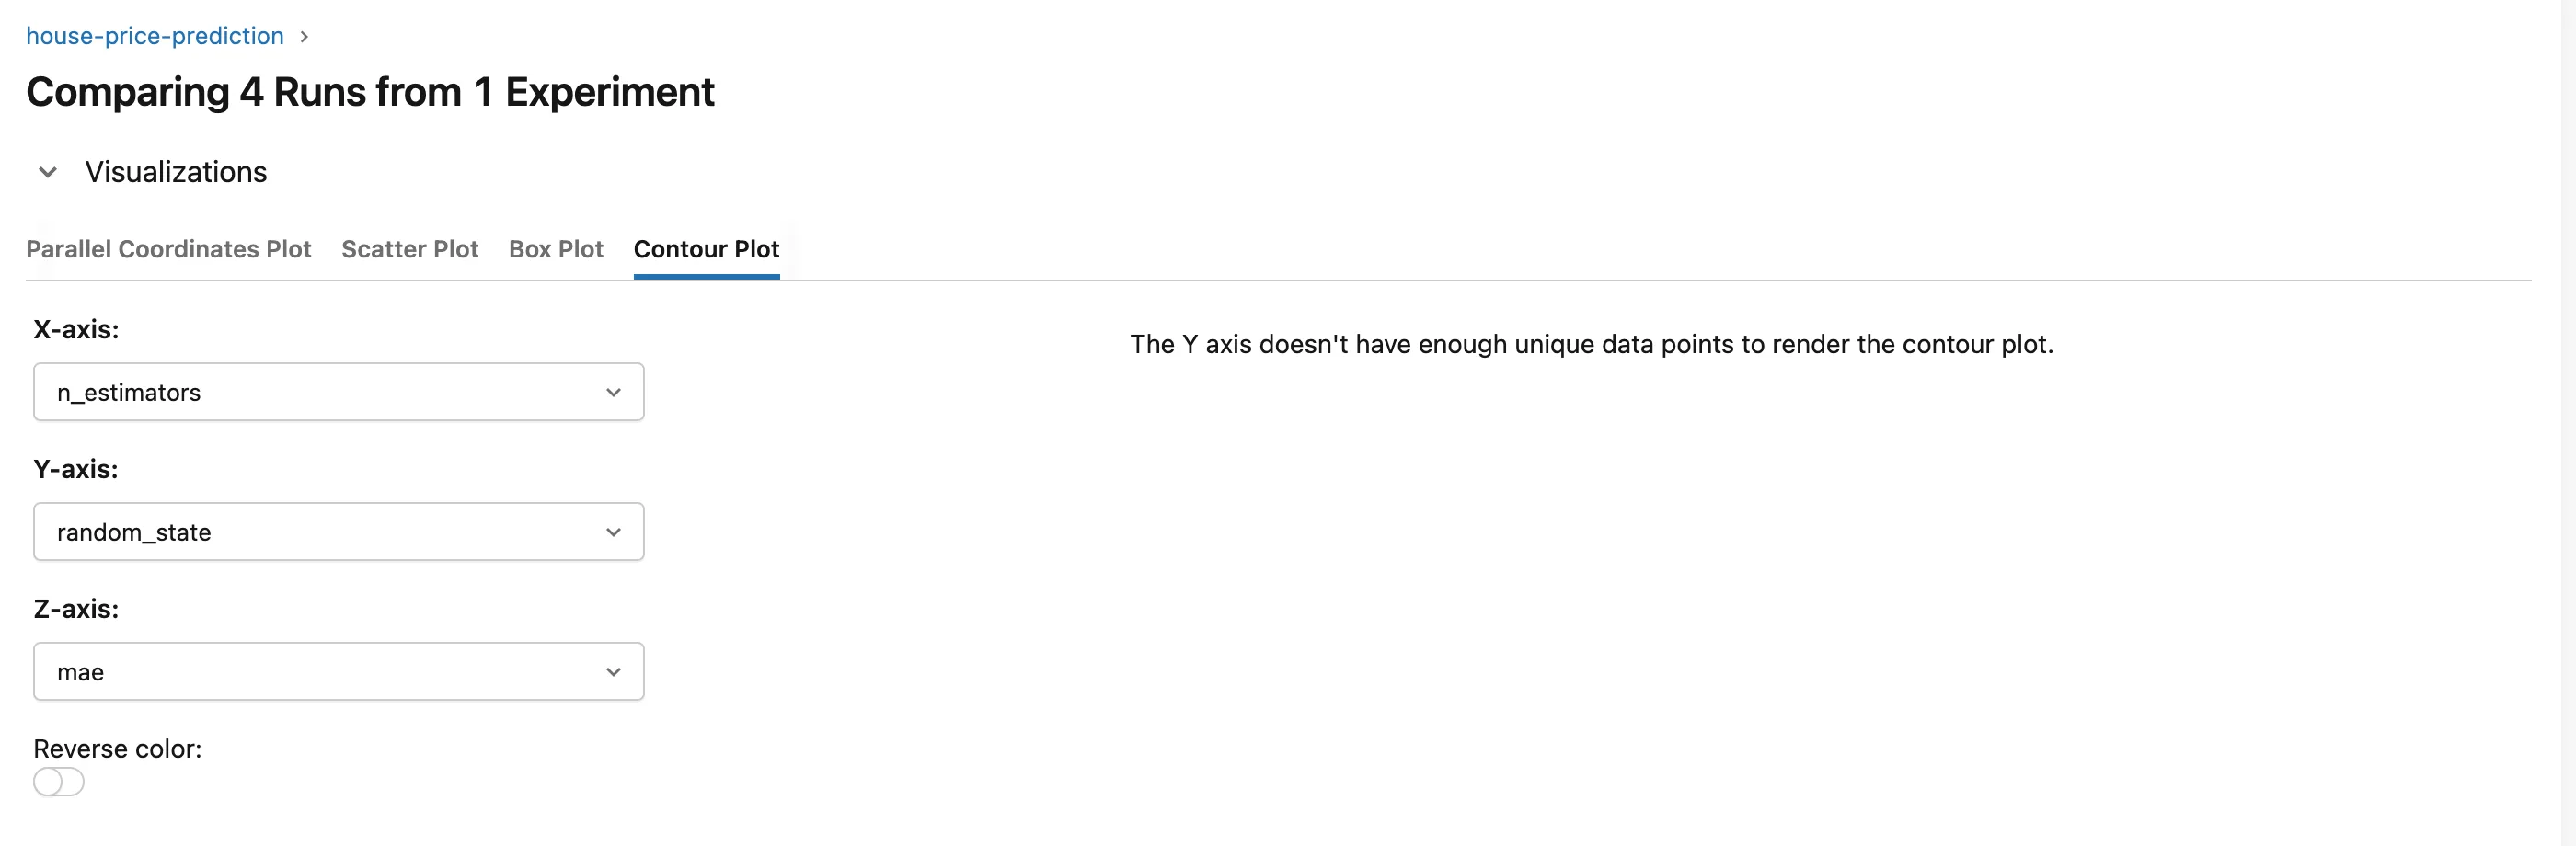
The Y axis doesn't have enough unique data points to render the contour plot. The contour needs at least two different values on each axis, and random_state is 42 in every run. Its lists only offer values that are numbers in every run, so max_depth, which is None in two runs, isn't there either. That leaves n_estimators as the only setting that changes, and a contour of a result over two settings needs two. A search over two numeric settings, such as a grid search, gives it what it needs.
Step 9: Read the Tables and Show Only the Differences
Below the plots, the page lists the runs side by side: Run details (ID, name, start, end and duration), Parameters, Metrics, Artifacts and Tags:
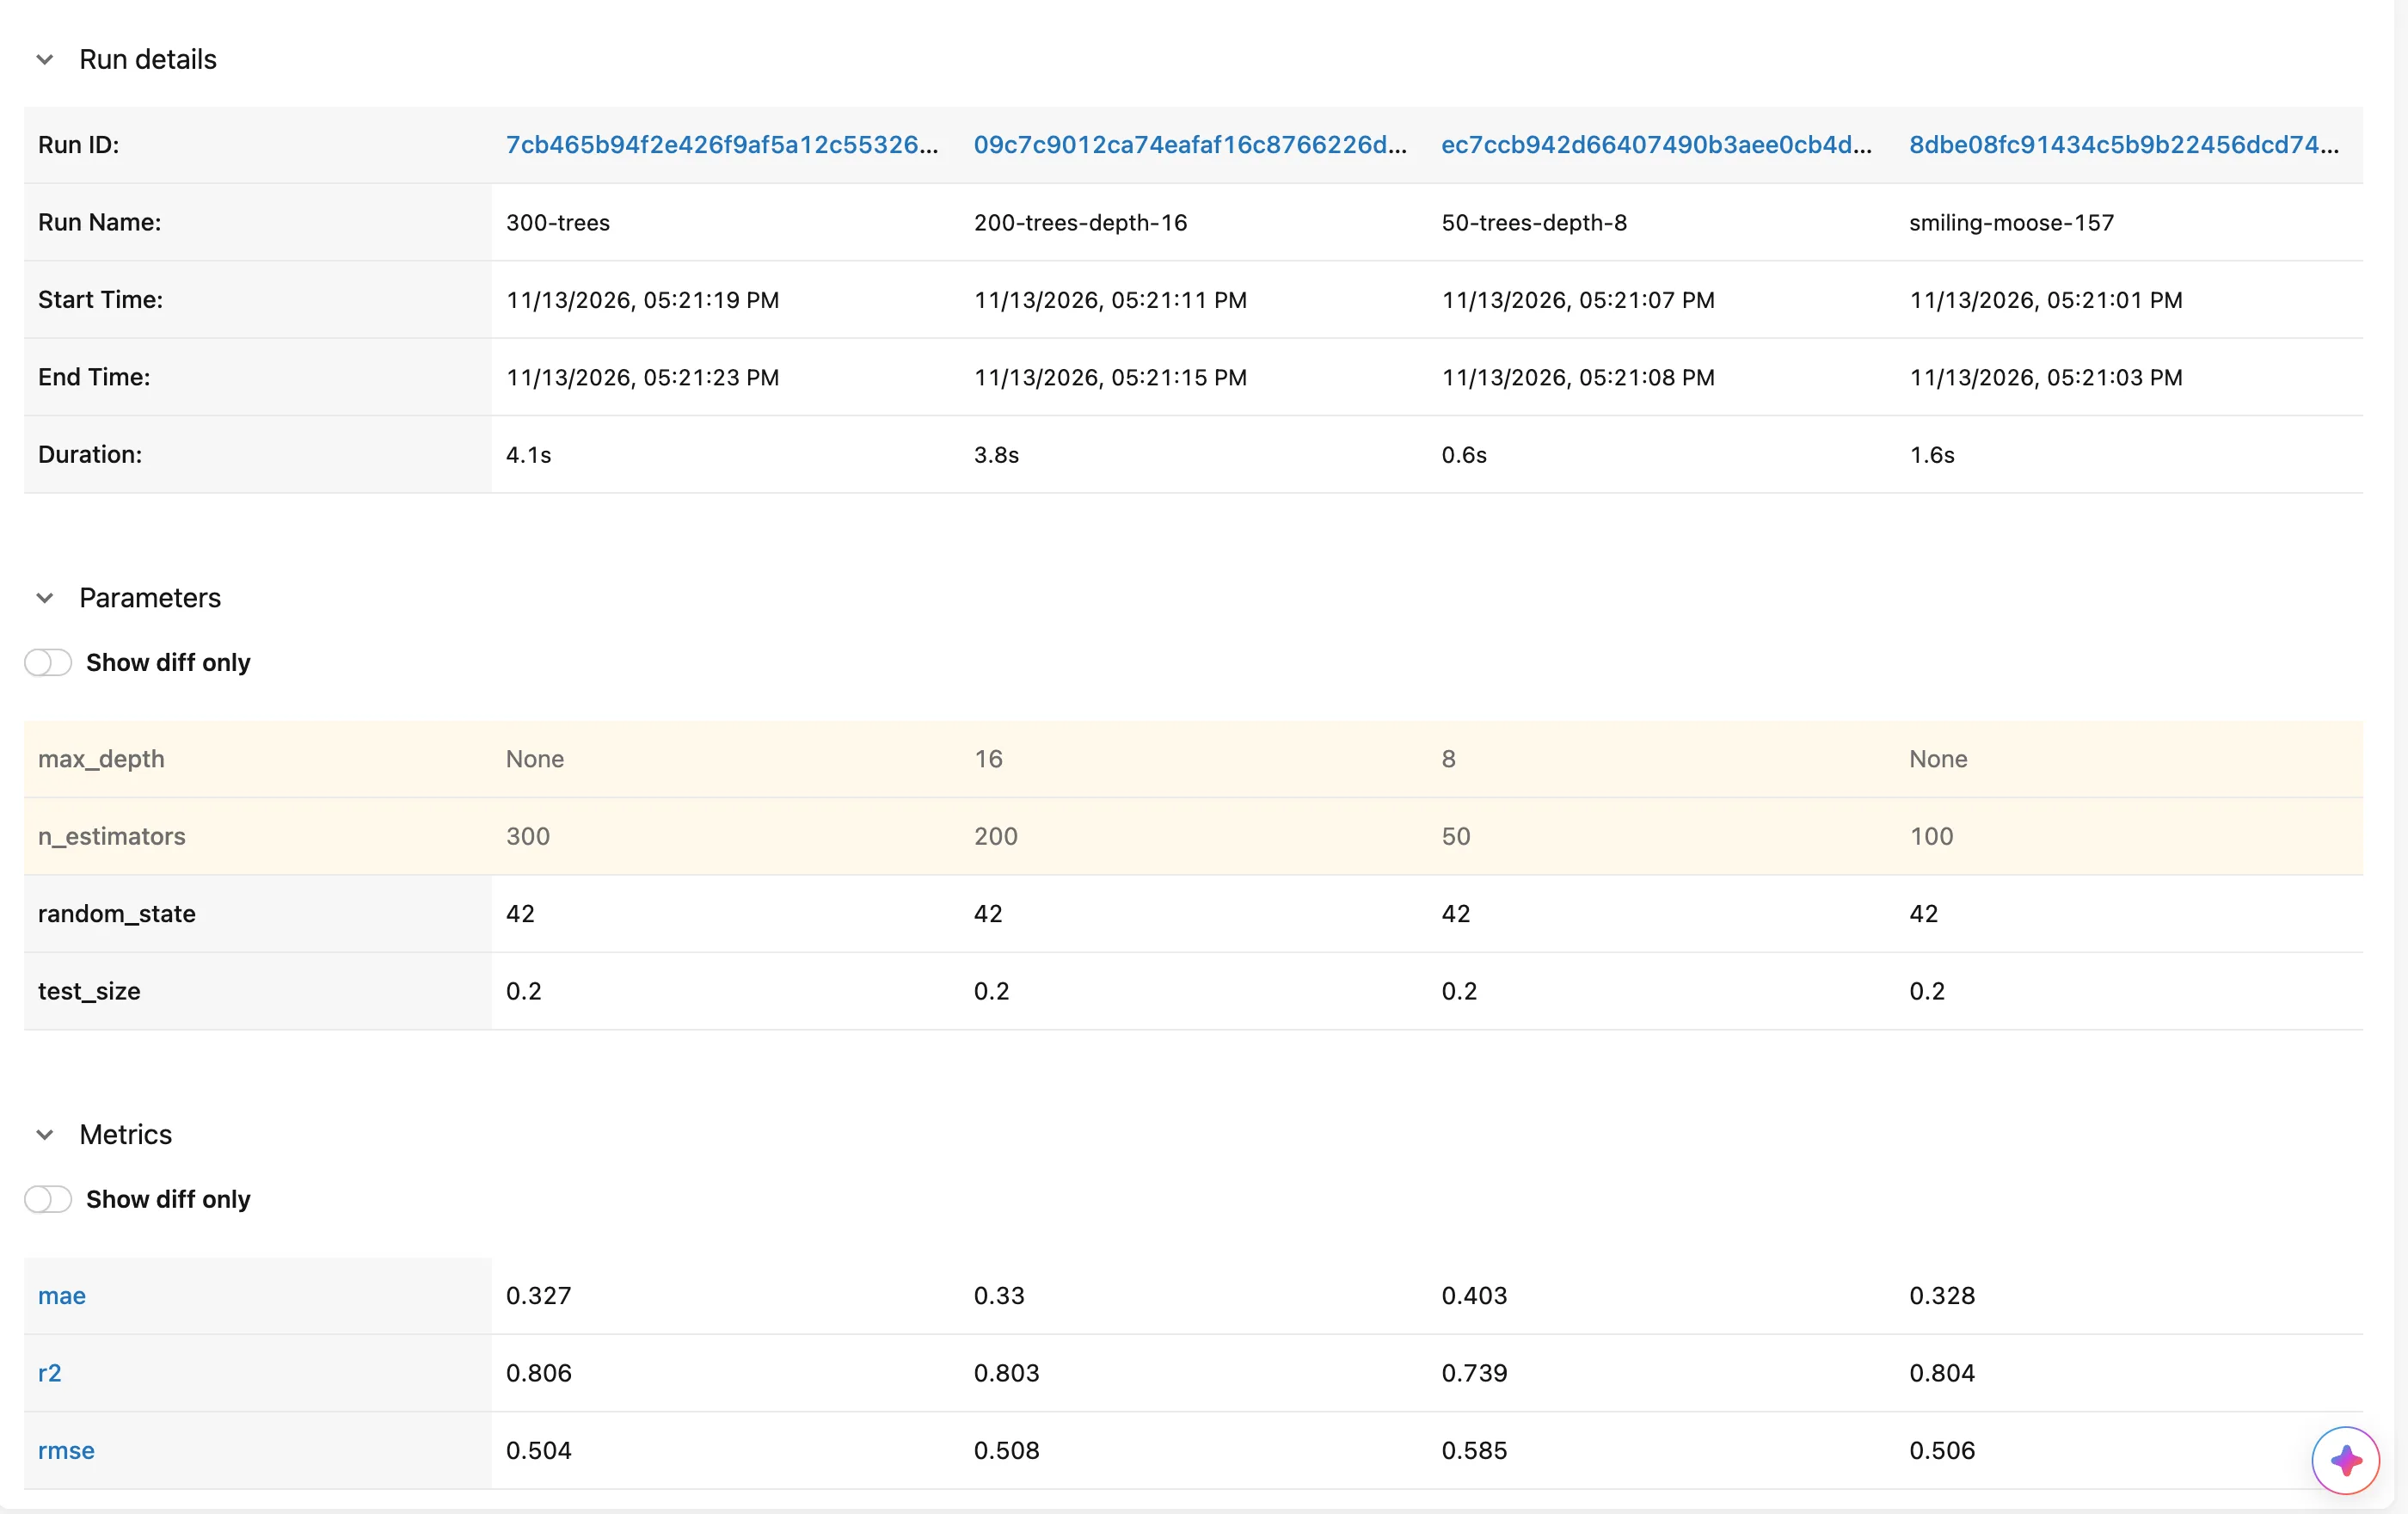
Rows whose values differ are highlighted: max_depth and n_estimators. Turn on Show diff only above the Parameters table to hide the rows that are the same in every run:

random_state and test_size are hidden. That they're the same everywhere matters too: every run was scored on the same test rows, so the scores are comparable. Metrics and Tags have their own Show diff only switch.
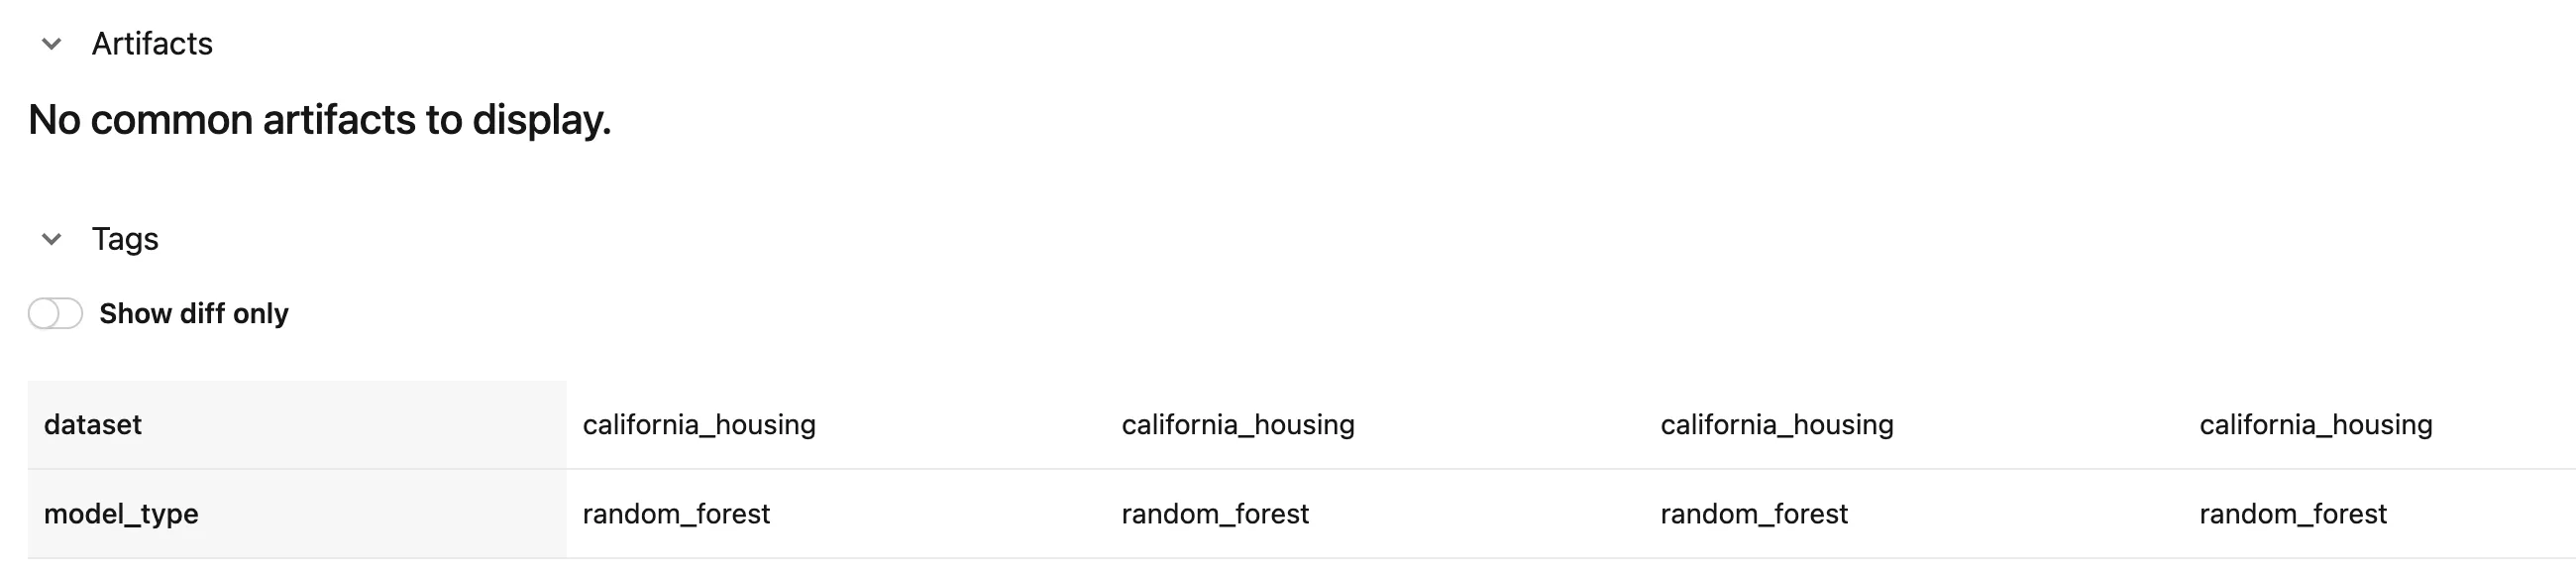
Artifacts says No common artifacts to display., although every run logged the same chart. In MLflow 3.18.0 this section only lists files at the top level of every run's artifacts, and Part 1 saved its chart inside a plots folder. To look at the charts, open each run's Artifacts tab.
Compare Runs in Python
mlflow.search_runs() runs the same kind of query from code and returns a pandas table. Create compare_runs.py in a project that has MLflow installed:
import mlflow

mlflow.set_tracking_uri("http://127.0.0.1:8080")

runs = mlflow.search_runs(
    experiment_names=["house-price-prediction"],
    filter_string="metrics.r2 > 0.8",
    order_by=["metrics.rmse ASC"],
)
columns = ["tags.mlflow.runName", "params.n_estimators", "params.max_depth", "metrics.rmse", "metrics.r2"]
print(runs[columns].to_string(index=False))
filter_stringtakes the same queries as the search box.order_bysorts;ASCputs the lowestrmsefirst.- The result has one row per run, with columns named
params.…,metrics.…andtags.…. The run's name is intags.mlflow.runName.
uv run python compare_runs.py
tags.mlflow.runName params.n_estimators params.max_depth  metrics.rmse  metrics.r2
          300-trees                 300             None      0.503821    0.806293
  smiling-moose-157                 100             None      0.506261    0.804412
 200-trees-depth-16                 200               16      0.507588    0.803385
The same three runs, in the same order as the sorted table in Step 3.
What the Comparison Shows
50-trees-depth-8is clearly worse: the highest errors in every view.- More than 100 trees barely helps: 100, 200 and 300 trees all land near 0.505 RMSE.
- But it costs time: the Run details table shows 4.1 seconds for 300 trees against 1.6 seconds for 100.
So the 100-tree forest, smiling-moose-157, gives nearly the best score in well under half the time.
Common Mistakes
| Mistake | What happens | Do this instead |
|---|---|---|
| Comparing runs with the default columns | You see names and times, not results | Add metric and parameter columns (Step 1) |
Using > or < on a parameter | Request error with Invalid comparator '>' not one of … | Use = or != on parameters, or filter in Python |
| Comparing runs scored on different test data | The scores can't be compared fairly | Check that test_size and random_state match in the Parameters table |
Troubleshooting
| Symptom | Likely cause | Fix |
|---|---|---|
| Compare is greyed out | Fewer than two runs are ticked | Tick at least two runs |
| A run is missing from the table | A search filter is still applied | Clear the search box with ✕ |
The Y axis doesn't have enough unique data points to render the contour plot. | The chosen parameter has the same value in every run | Pick numeric parameters that change between runs |
No common artifacts to display. | The files sit inside folders, or the runs don't share a file | Open each run's Artifacts tab |
FAQ
Can I bookmark a comparison?
Yes. The Compare page's address lists the run IDs, so opening it again brings back the same comparison.
Why are the numbers rounded on the Compare page?
The Compare page's tables show three decimals. The runs table shows more digits but cuts them to fit the column.
Does comparing runs change them?
No. Filtering, sorting and the Compare page only read the runs.
Conclusion
The runs table compared the four forests once their metrics and parameters were columns: metrics.r2 > 0.8 left three, and sorting by rmse put 300-trees first. The Compare page's parallel coordinates and scatter plots showed that more than 100 trees barely helped, and Show diff only confirmed that only max_depth and n_estimators changed. mlflow.search_runs() gave the same answer from Python.
Additional Resources
- Search Runs — MLflow's full search syntax, with examples.
- mlflow.search_runs — the API reference.
