How to Compare a Logged Table Across Runs in the MLflow UI

When several runs log the same table, such as each model's predictions for the same houses, the useful question is how the runs differ row by row. The MLflow UI answers it on the experiment's runs page, in a view called Artifact evaluation: one column per run, one row per item, with the value you choose in each cell. This guide compares two models' predictions, with real screens from MLflow 3.18.0.
The Runs Used Here
The experiment tables-demo has two runs, model-v1 and model-v2. Each logged a table called predictions.json with mlflow.log_table(): three houses, A, B and C, with their actual price and the price that model predicted. How to Log a Table in MLflow with log_table creates them.
The view works only with tables logged by log_table, under the same name in every run.
Step 1: Open the Artifact Evaluation View
Open the experiment. Above the runs table are three view buttons: Table view, Chart view and, third, Artifact evaluation. Click the third.
The runs stay listed on the left. The right side picks a logged table and shows it for the runs that have it; MLflow's hint next to the table picker reads "Using the list of logged table artifacts, select at least one to start comparing results."
Step 2: Choose What to Compare
Three controls set up the grid:
- Table: the logged table, here
predictions.json. - Group by: the column that identifies a row in every run, here
house. MLflow suggests the table's first column. You can tick several, and a row then matches on all of them. - Compare: the column whose values fill the grid. MLflow suggests the second column,
actual, which is the same in both runs. Open it and choosepredicted:
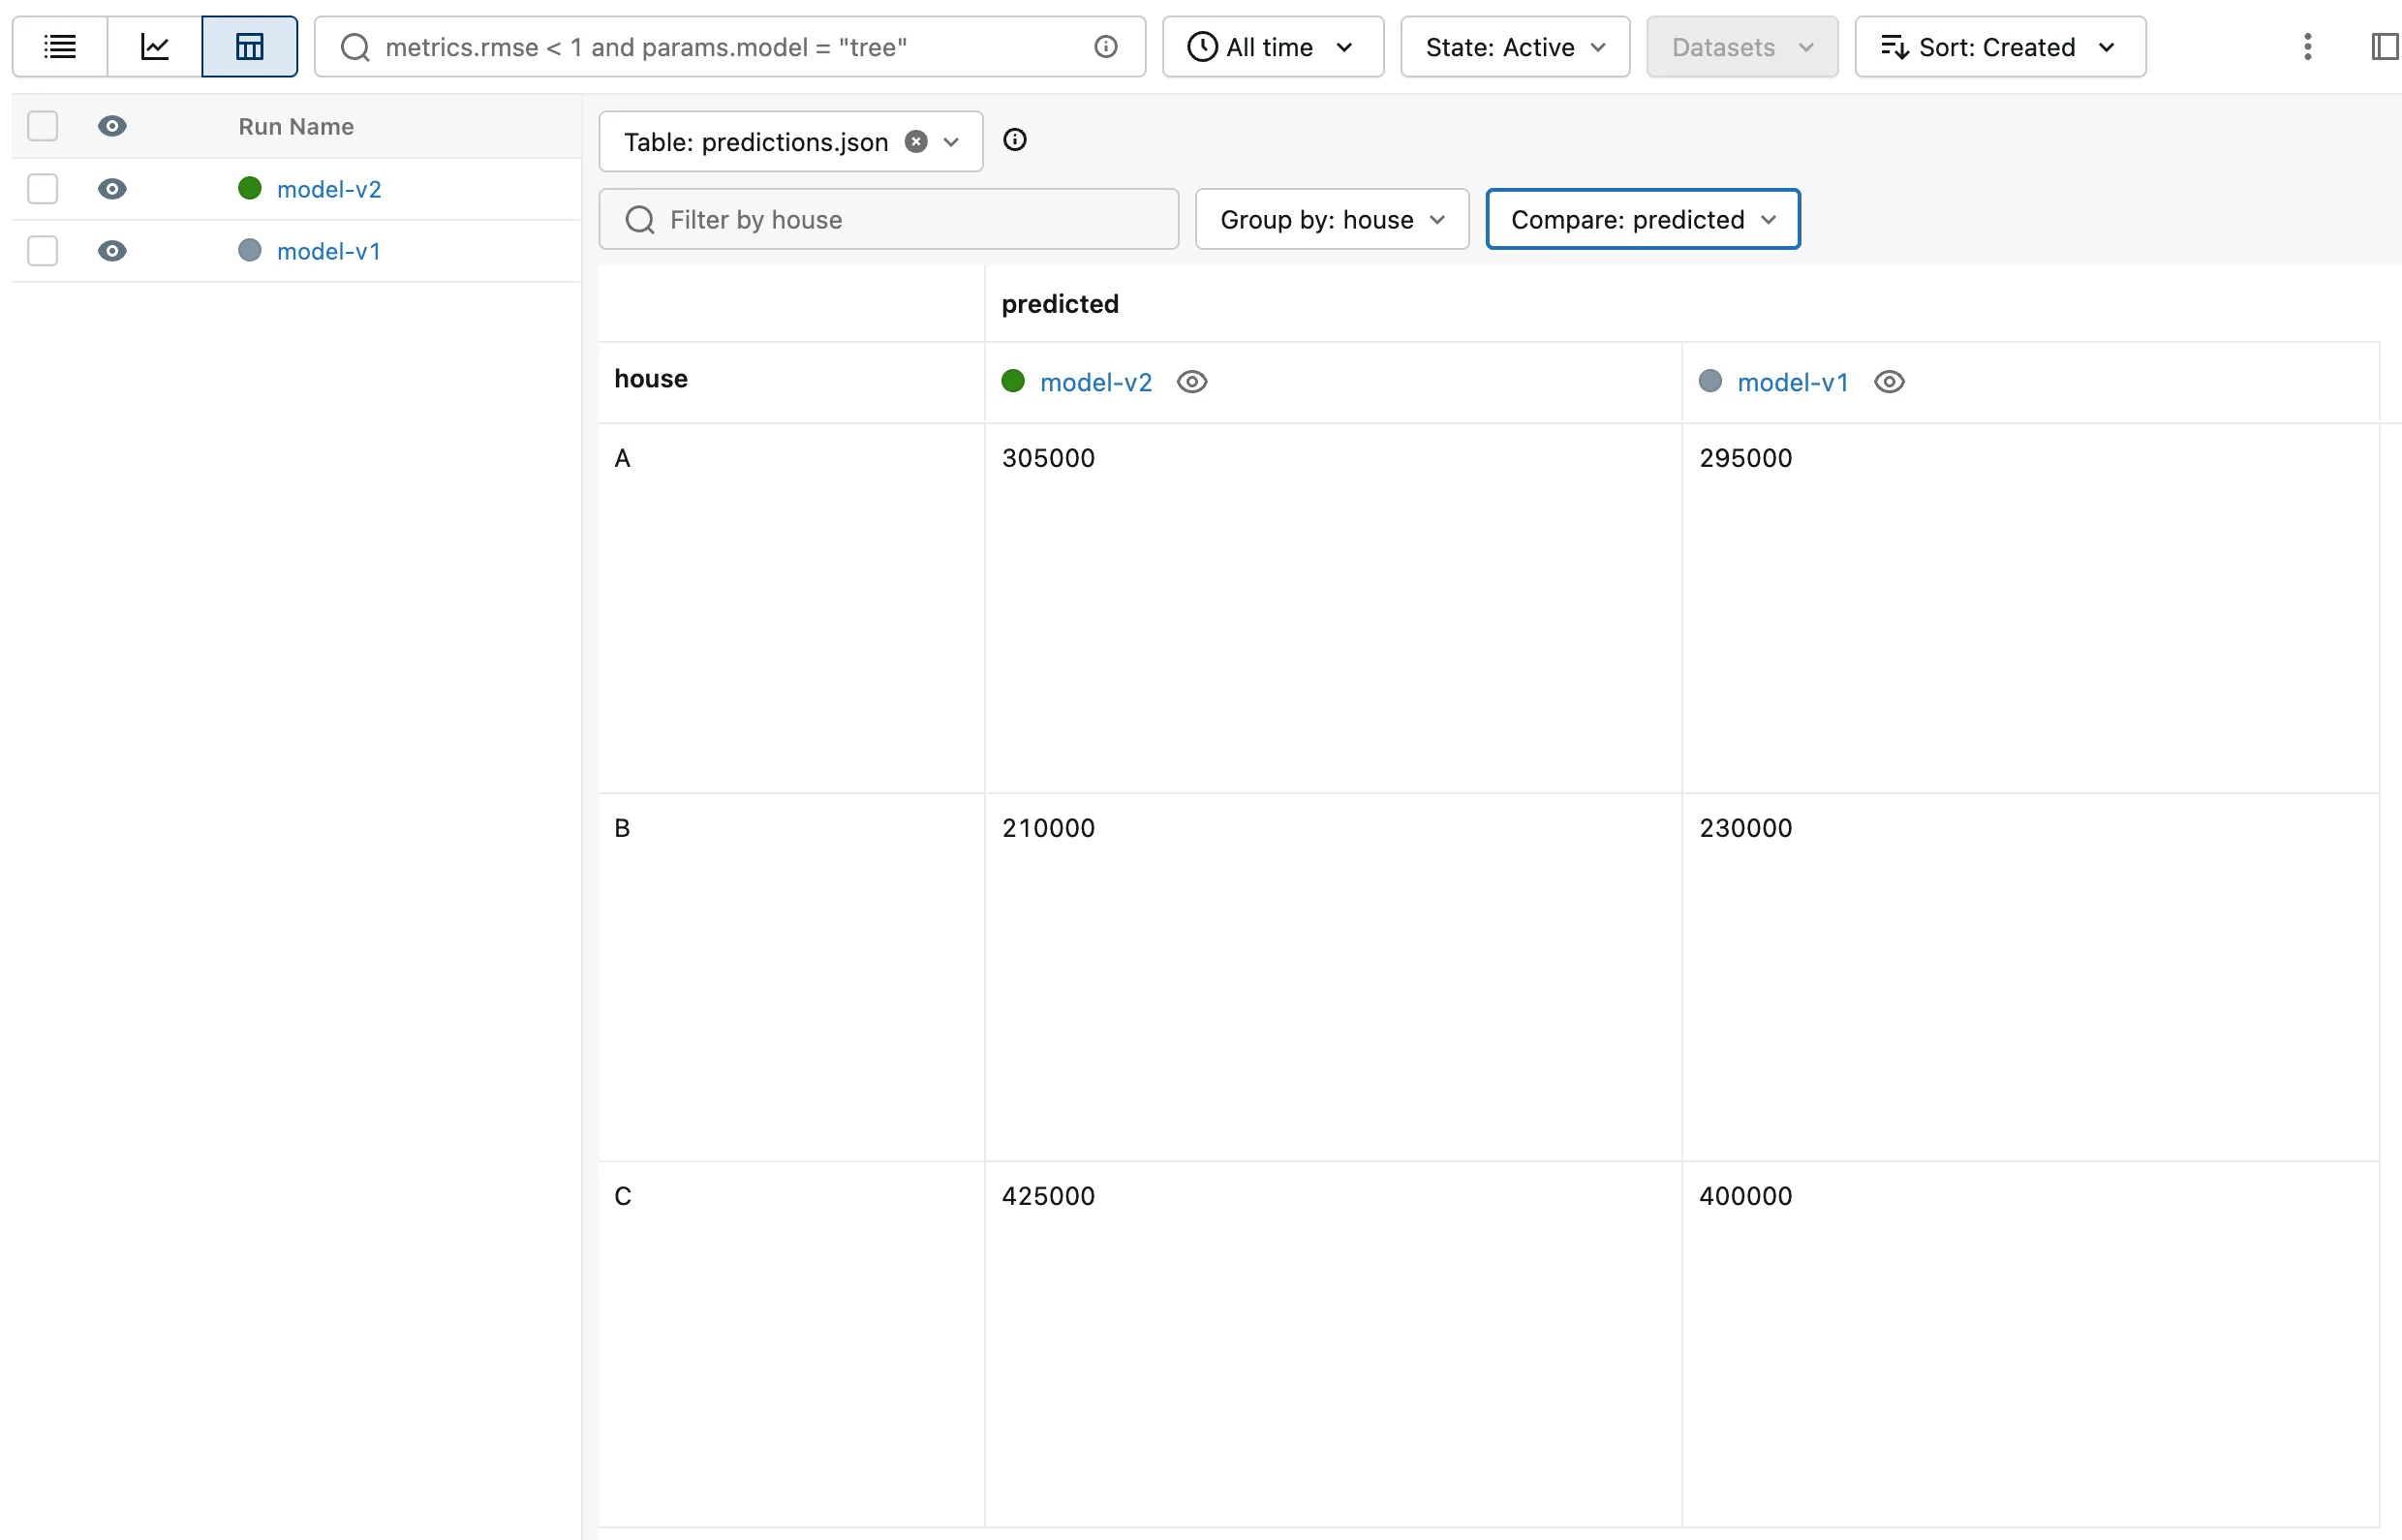
Each row is a house, each column a run, and each cell that run's prediction for that house. With the real prices of 310,000, 205,000 and 420,000, model-v2 is closer on every house.
Step 3: Narrow It Down
- Filter by house, the search box, keeps only the rows whose
housecontains what you type. Its name follows the Group by column. - Hiding a run with its eye icon in the list on the left removes its column; showing it again brings the column back.
- The run name at the top of each column opens that run, and the dataset label under it shows which training data it used, when the run logged one.
Common Mistakes
| Mistake | What happens | Do this instead |
|---|---|---|
Logging the table with log_artifact | It isn't offered under Table: | Log it with log_table |
| Different file names in different runs | Each run's table is a different choice under Table:, so they never share the grid | Use one name, such as predictions.json, in every run |
Grouping by a column whose values differ between runs, such as predicted | Rows don't line up: each run fills only its own rows, and the other runs' cells read (empty) | Group by a column that identifies the item, such as an ID or a name |
| Leaving Compare on a column that's the same everywhere | Every run shows the same values | Pick the column that differs, such as the predictions |
Troubleshooting
| Symptom | Likely cause | Fix |
|---|---|---|
| A run has no column | It didn't log this table, or it's hidden | Check its Artifacts tab, or show it with its eye icon |
| "No evaluation tables logged. Please log at least one table artifact containing evaluation data." | No run in the experiment logged a table with log_table | Log one, then reload the page |
FAQ
Is this the same as the compare page?
No. The compare page, opened from Compare after selecting runs, shows the runs' top-level files next to each other as files. This view lines up a table's rows across runs and is meant for tables.
Can I compare more than two runs?
Yes. Every visible run that logged the table gets a column.
Can I get the same comparison in Python?
Yes: mlflow.load_table() reads the table from every run into one DataFrame, with a column for the run: How to Load a Logged Table from MLflow with load_table.
Conclusion
The Artifact evaluation view put predictions.json from two runs side by side: Table picked the logged table, Group by matched the rows by house, and Compare filled the grid with each run's predicted price. It works with tables logged by log_table under the same name in each run.
Additional Resources
- mlflow.log_table — logging the tables this view compares.
- mlflow.load_table — the same tables in Python.
