How to Choose Columns in Power Query

A query often brings in more columns than you need. A SharePoint list, for example, comes with system columns such as Color Tag, Content Type and Modified. Choose columns keeps only the ones you tick. Here's how.
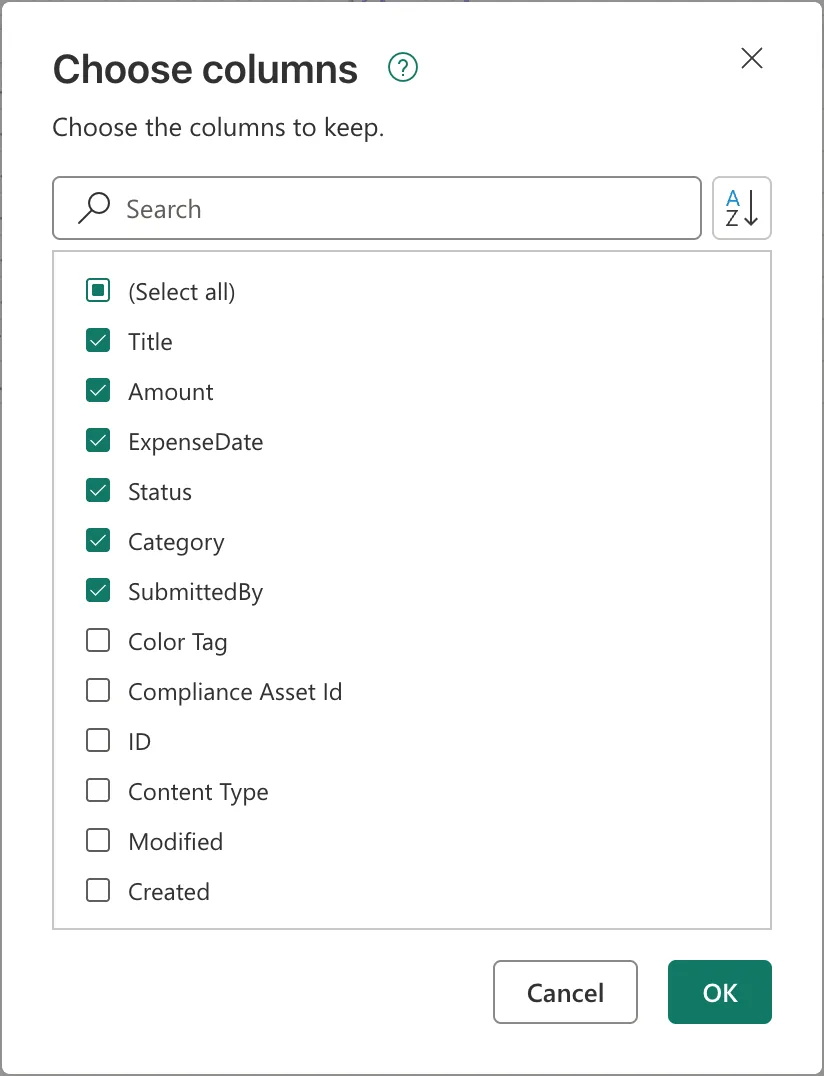
Microsoft's Choose or remove columns describes it as the way to keep only the columns you want in your table. The example is a query of an Expenses list, opened in Power Query in the Power BI service (How to Get Data from a SharePoint List in Power BI in the Browser). It keeps six of its columns: Title, Amount, ExpenseDate, Status, Category and SubmittedBy.
Step 1: Select Choose Columns
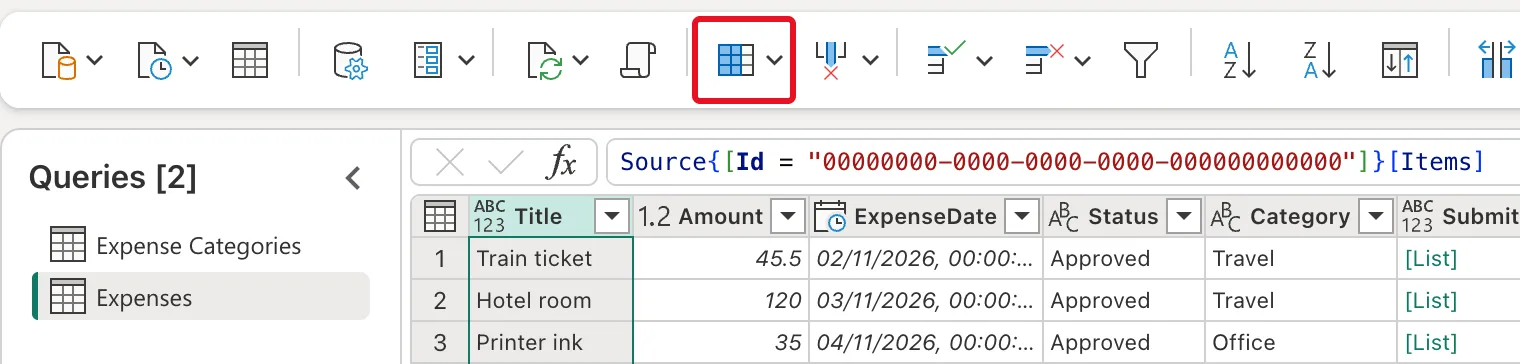
Select the query under Queries, then Choose columns on the Home tab. In a narrow window the ribbon shows only icons; hovering over one shows its name:
Step 2: Tick the Columns to Keep
The Choose columns dialog lists every column, all ticked. Untick the ones you don't need, or untick (Select all) and tick the ones you want:
Select OK.
Step 3: Check the Result
The query now has the six columns, and Applied steps gains Choose columns. The formula bar shows the step:
Table.SelectColumns(#"Navigation 1", {"Title", "Amount", "ExpenseDate", "Status", "Category", "SubmittedBy"})
#"Navigation 1"is the step before, the list as it came from SharePoint.- The list in braces is the columns to keep, in their order.

To change the choice later, select the step's gear icon in Applied steps to open the dialog again.
Common Mistakes
| Mistake | What happens | Do this instead |
|---|---|---|
| Keeping every column "just in case" | The model carries columns no report uses | Keep only what the reports need |
| Dropping a column a later step uses | The later step fails | Choose columns early, before the steps that use them |
Troubleshooting
| Symptom | Likely cause | Fix |
|---|---|---|
| A later step shows an error after choosing columns | It refers to a column you dropped | Tick that column again, from the gear icon |
| The dialog lists fewer columns than the list has | The connector's view mode is Default | Use view mode All |
| You can't find Choose columns | The ribbon shows icons only | Hover over the icons, or widen the window |
FAQ
What's the difference between Choose columns and Remove columns?
Choose columns keeps the columns you tick; Remove columns drops the ones you select (How to Remove Columns in Power Query). When you keep few columns of many, Choose columns is shorter.
Does choosing columns make the query faster?
Microsoft's query folding article explains that some steps can run at the source. Either way, fewer columns mean less data to load into the model.
Is the step the same in Power BI Desktop and Excel?
Yes. Choose columns writes the same Table.SelectColumns step in every Power Query.
Conclusion
Choose columns on the Home tab, tick the columns to keep, and select OK. Power Query adds a Table.SelectColumns step; the example kept six of the Expenses list's columns.
