How to Check CPU and Memory Usage in Python with psutil

psutil reads your computer's CPU and memory use from Python, the same figures a task manager shows. Two details trip people up: the first CPU reading is a meaningless 0.0, and the memory figure called used isn't the one to watch. This guide shows both, with real output from psutil 7.2.2 on a Mac.
Syntax
import psutil

psutil.cpu_percent(interval=<seconds>, percpu=<True or False>)
psutil.cpu_count()
psutil.virtual_memory()
| Part | What it means |
|---|---|
psutil.cpu_percent() | In psutil's words, "the current system-wide CPU utilization as a percentage": the whole computer, not just your program |
interval=<seconds> | Measure over that many seconds, then return. Without it, psutil measures since the last call and returns at once |
percpu=True | Return a list, one percentage per logical CPU, instead of one number |
psutil.cpu_count() | The number of logical CPUs: physical cores times the threads each one runs |
psutil.virtual_memory() | Memory figures in bytes, including total, available, percent and used |
Prerequisites
- A uv project with psutil:
uv add psutil. See How to Add a Package to a Python Project with uv. - A terminal in the project folder. The commands work the same in Terminal (macOS), PowerShell (Windows) and Linux shells.
Step 1: Write the Script
The example prints the CPU and memory figures a monitoring tool would record. Create usage.py:
import psutil

print("CPU, first call:     ", psutil.cpu_percent())
print("CPU, over 1 second:  ", psutil.cpu_percent(interval=1))
print("Each core, 1 second: ", psutil.cpu_percent(interval=1, percpu=True))
print("Logical CPUs:        ", psutil.cpu_count())

memory = psutil.virtual_memory()
print(f"Memory total:     {memory.total / 1e9:.1f} GB")
print(f"Memory available: {memory.available / 1e9:.1f} GB")
print(f"Memory in use:    {memory.percent}%")
print(f"The 'used' field: {memory.used / 1e9:.1f} GB")
Each memory figure is in bytes, so the script divides by 1e9 to show gigabytes.
Step 2: Run It
uv run python usage.py
CPU, first call:      0.0
CPU, over 1 second:   20.0
Each core, 1 second:  [45.0, 43.6, 46.5, 29.0, 18.0, 12.0, 7.0, 5.9, 1.0, 0.0]
Logical CPUs:         10
Memory total:     17.2 GB
Memory available: 3.4 GB
Memory in use:    80.2%
The 'used' field: 6.2 GB
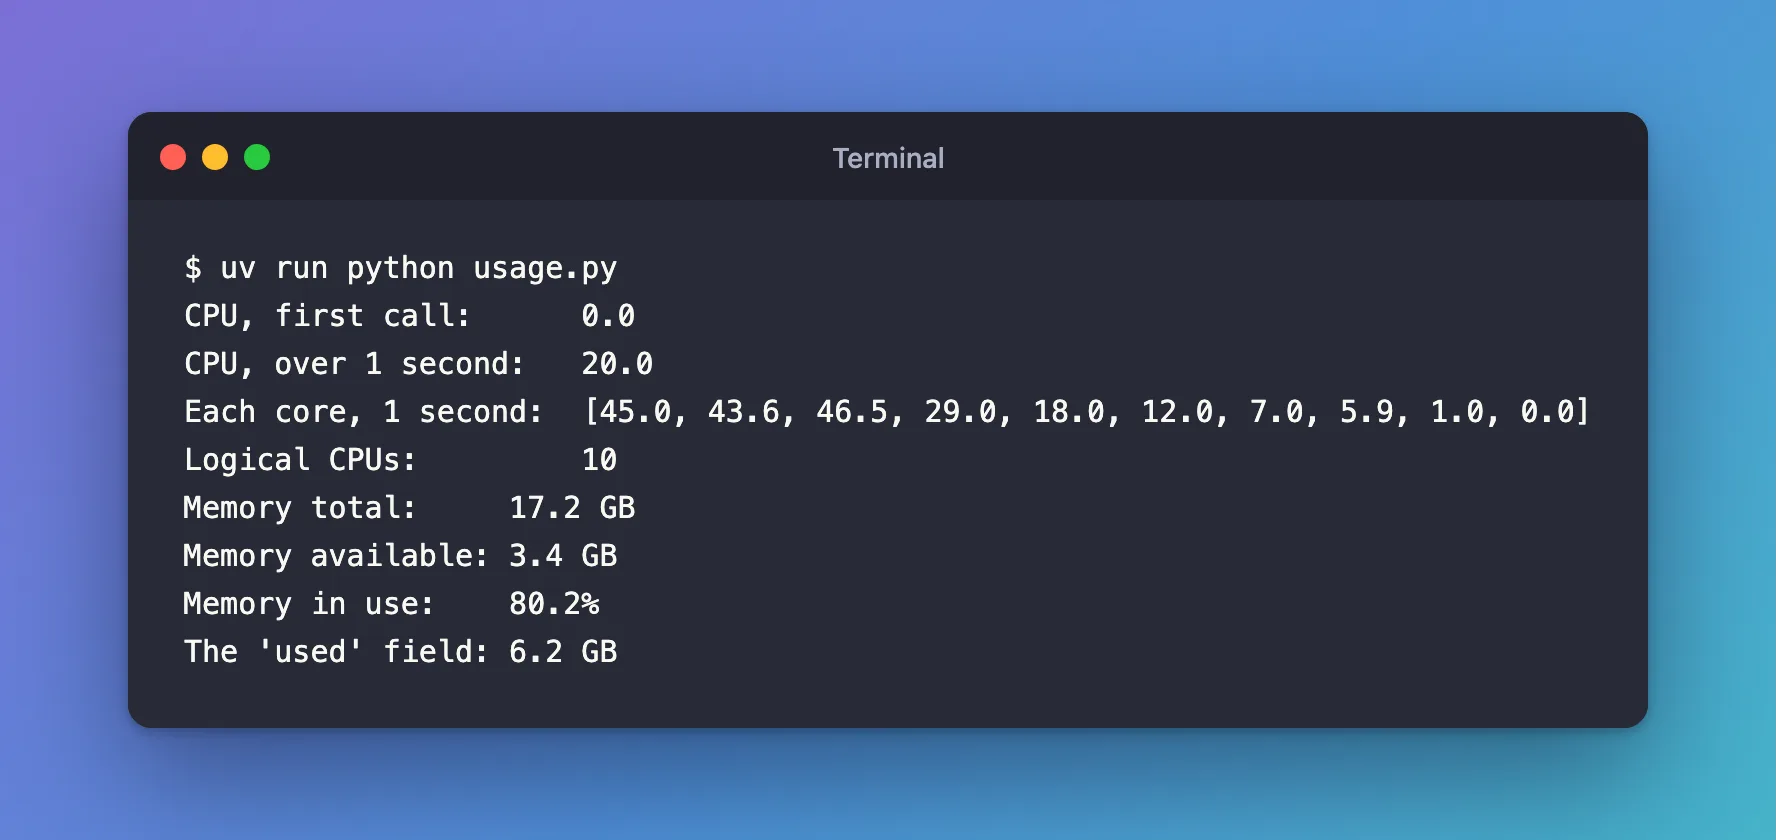
Your numbers will differ: they're a snapshot of whatever your computer is doing.
Step 3: Read the CPU Figures
The first call is always 0.0. psutil's documentation explains that without an interval it "compares system CPU times elapsed since last call or module import", and so "the first time this is called it will return a meaningless 0.0 value which you are supposed to ignore." It also keeps a separate "last call" for every thread, so the first call in each new thread is 0.0 too.
With interval=1, psutil measured for one second and returned the real figure, 20%. The call waits for that second.
With percpu=True, it returned ten figures, one for each of the ten logical CPUs that cpu_count() reports.
Step 4: Read the Memory Figures
The output says 6.2 GB "used", but 80.2% in use. Both are right; they measure different things. psutil's documentation defines them:
| Field | psutil's definition |
|---|---|
available | "the memory that can be given instantly to processes without the system going into swap", and "It is supposed to be used to monitor actual memory usage in a cross platform fashion" |
percent | "the percentage usage calculated as (total - available) / total * 100" |
used | "memory used, calculated differently depending on the platform and designed for informational purposes only" |
So to judge whether your computer is running out of memory, watch available or percent. Here, 17.2 GB total with 3.4 GB available gives the 80.2%.
Common Mistakes
| Mistake | What happens | Do this instead |
|---|---|---|
Trusting the first cpu_percent() | It returns 0.0 whatever the computer is doing | Ignore the first reading, or pass interval=1 |
Reading cpu_percent() as your program's CPU use | It's the whole computer's | Use psutil.Process().cpu_percent() for one process |
Judging memory by used | It's "designed for informational purposes only" and differs by platform | Watch available or percent |
Calling cpu_percent(interval=1) in a fast loop | Each call waits one second | Call it without an interval between your own pauses |
Troubleshooting
| Symptom | Likely cause | Fix |
|---|---|---|
ModuleNotFoundError: No module named 'psutil'. Did you mean: 'shutil'? | psutil isn't installed in the Python you ran | uv add psutil, then run with uv run python usage.py |
CPU always 0.0 | Every call is a first call: a new process or thread each time | Pass an interval, or keep calling from the same thread |
FAQ
How do I measure just my own program?
psutil.Process() returns the current process, and its cpu_percent() and memory_info() measure that process alone.
What's the difference between logical and physical CPUs?
cpu_count() counts logical CPUs, "the number of physical cores multiplied by the number of threads that can run on each core". cpu_count(logical=False) counts the physical cores.
Does psutil work on Windows and Linux?
Yes. The figures it can return vary slightly by platform; its documentation marks each one.
Conclusion
psutil.cpu_percent() returned a meaningless 0.0 on its first call, then 20% when measured over one second, and percpu=True gave one figure per core. psutil.virtual_memory() showed why "used" can look low while memory is nearly full: percent comes from available, which is the figure psutil recommends for monitoring.
Additional Resources
- psutil documentation — every function, with its exact definition.
- psutil on PyPI — the package and its supported platforms.
