How to Change the X-Axis of a Metric Chart in the MLflow UI

When a run logs a metric at several steps, the MLflow UI draws it as a line against Step. That's one of four choices: the same chart can run along the clock, along the seconds since the run's first value, or along another metric. This guide tries all four on one chart, then changes every chart at once, with screenshots from MLflow 3.18.0.
Prerequisites
- Runs that logged a metric at several steps. Any metric logged with
step=works: How to Log Metrics in MLflow. - The experiment's chart view open in the MLflow UI: How to Compare Runs in the MLflow UI shows how to get there.
The screenshots use four runs from Part 2 of the MLflow series. Each one grows, in stages, a random forest that predicts house prices, and after every stage logs three scores on held-back data, val_mae, val_rmse and val_r2, with the number of trees as the step:
| Run | Color | Trees | Tree depth |
|---|---|---|---|
curve-100-trees | Blue | 10 to 100, 10 at a time | No limit |
curve-300-trees | Orange | 20 to 300, 20 at a time | No limit |
curve-depth-8 | Green | 10 to 100, 10 at a time | 8 |
curve-depth-8-sampled | Red | The same as curve-depth-8 | 8 |
The last run repeats curve-depth-8 with the same settings, so its scores are identical, and on a Step chart its red line hides under the green one.
Step 1: Open the Chart's Settings
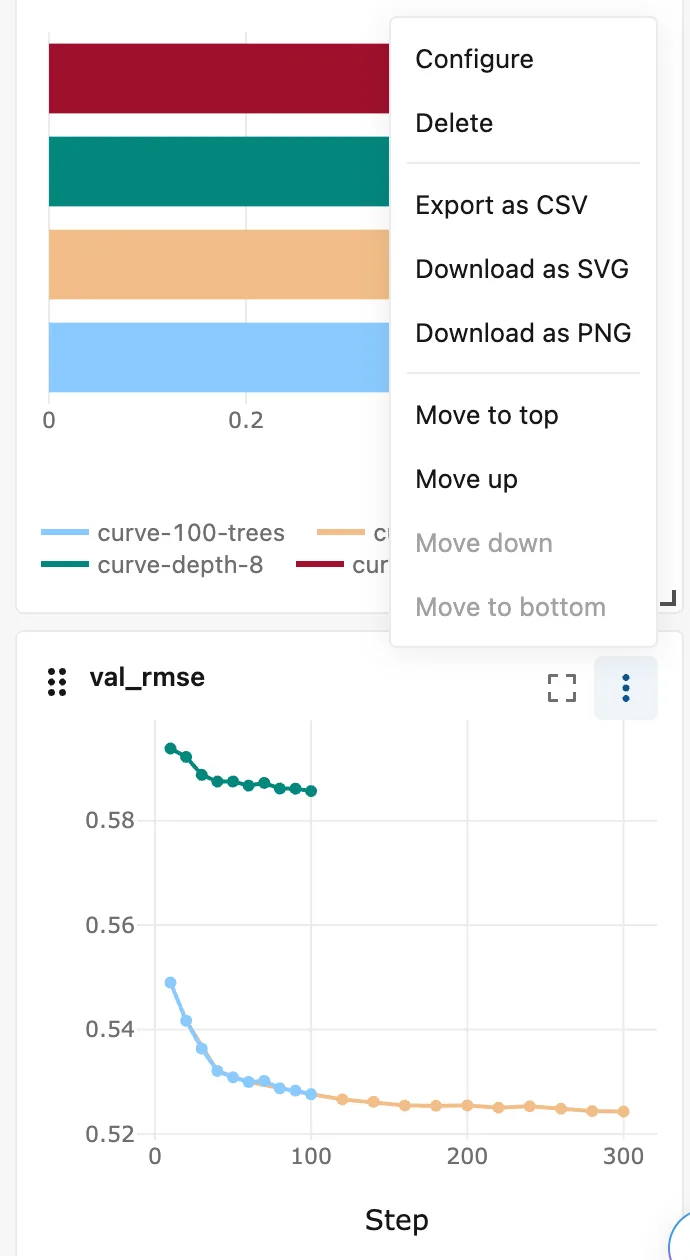
Each chart has a ⋮ menu at its top right. Open the one on val_rmse and click Configure:
Step 2: Read the X-Axis Choices
The Edit chart dialog opens, with the settings on the left and a preview on the right. Under X-axis, Type has five choices:
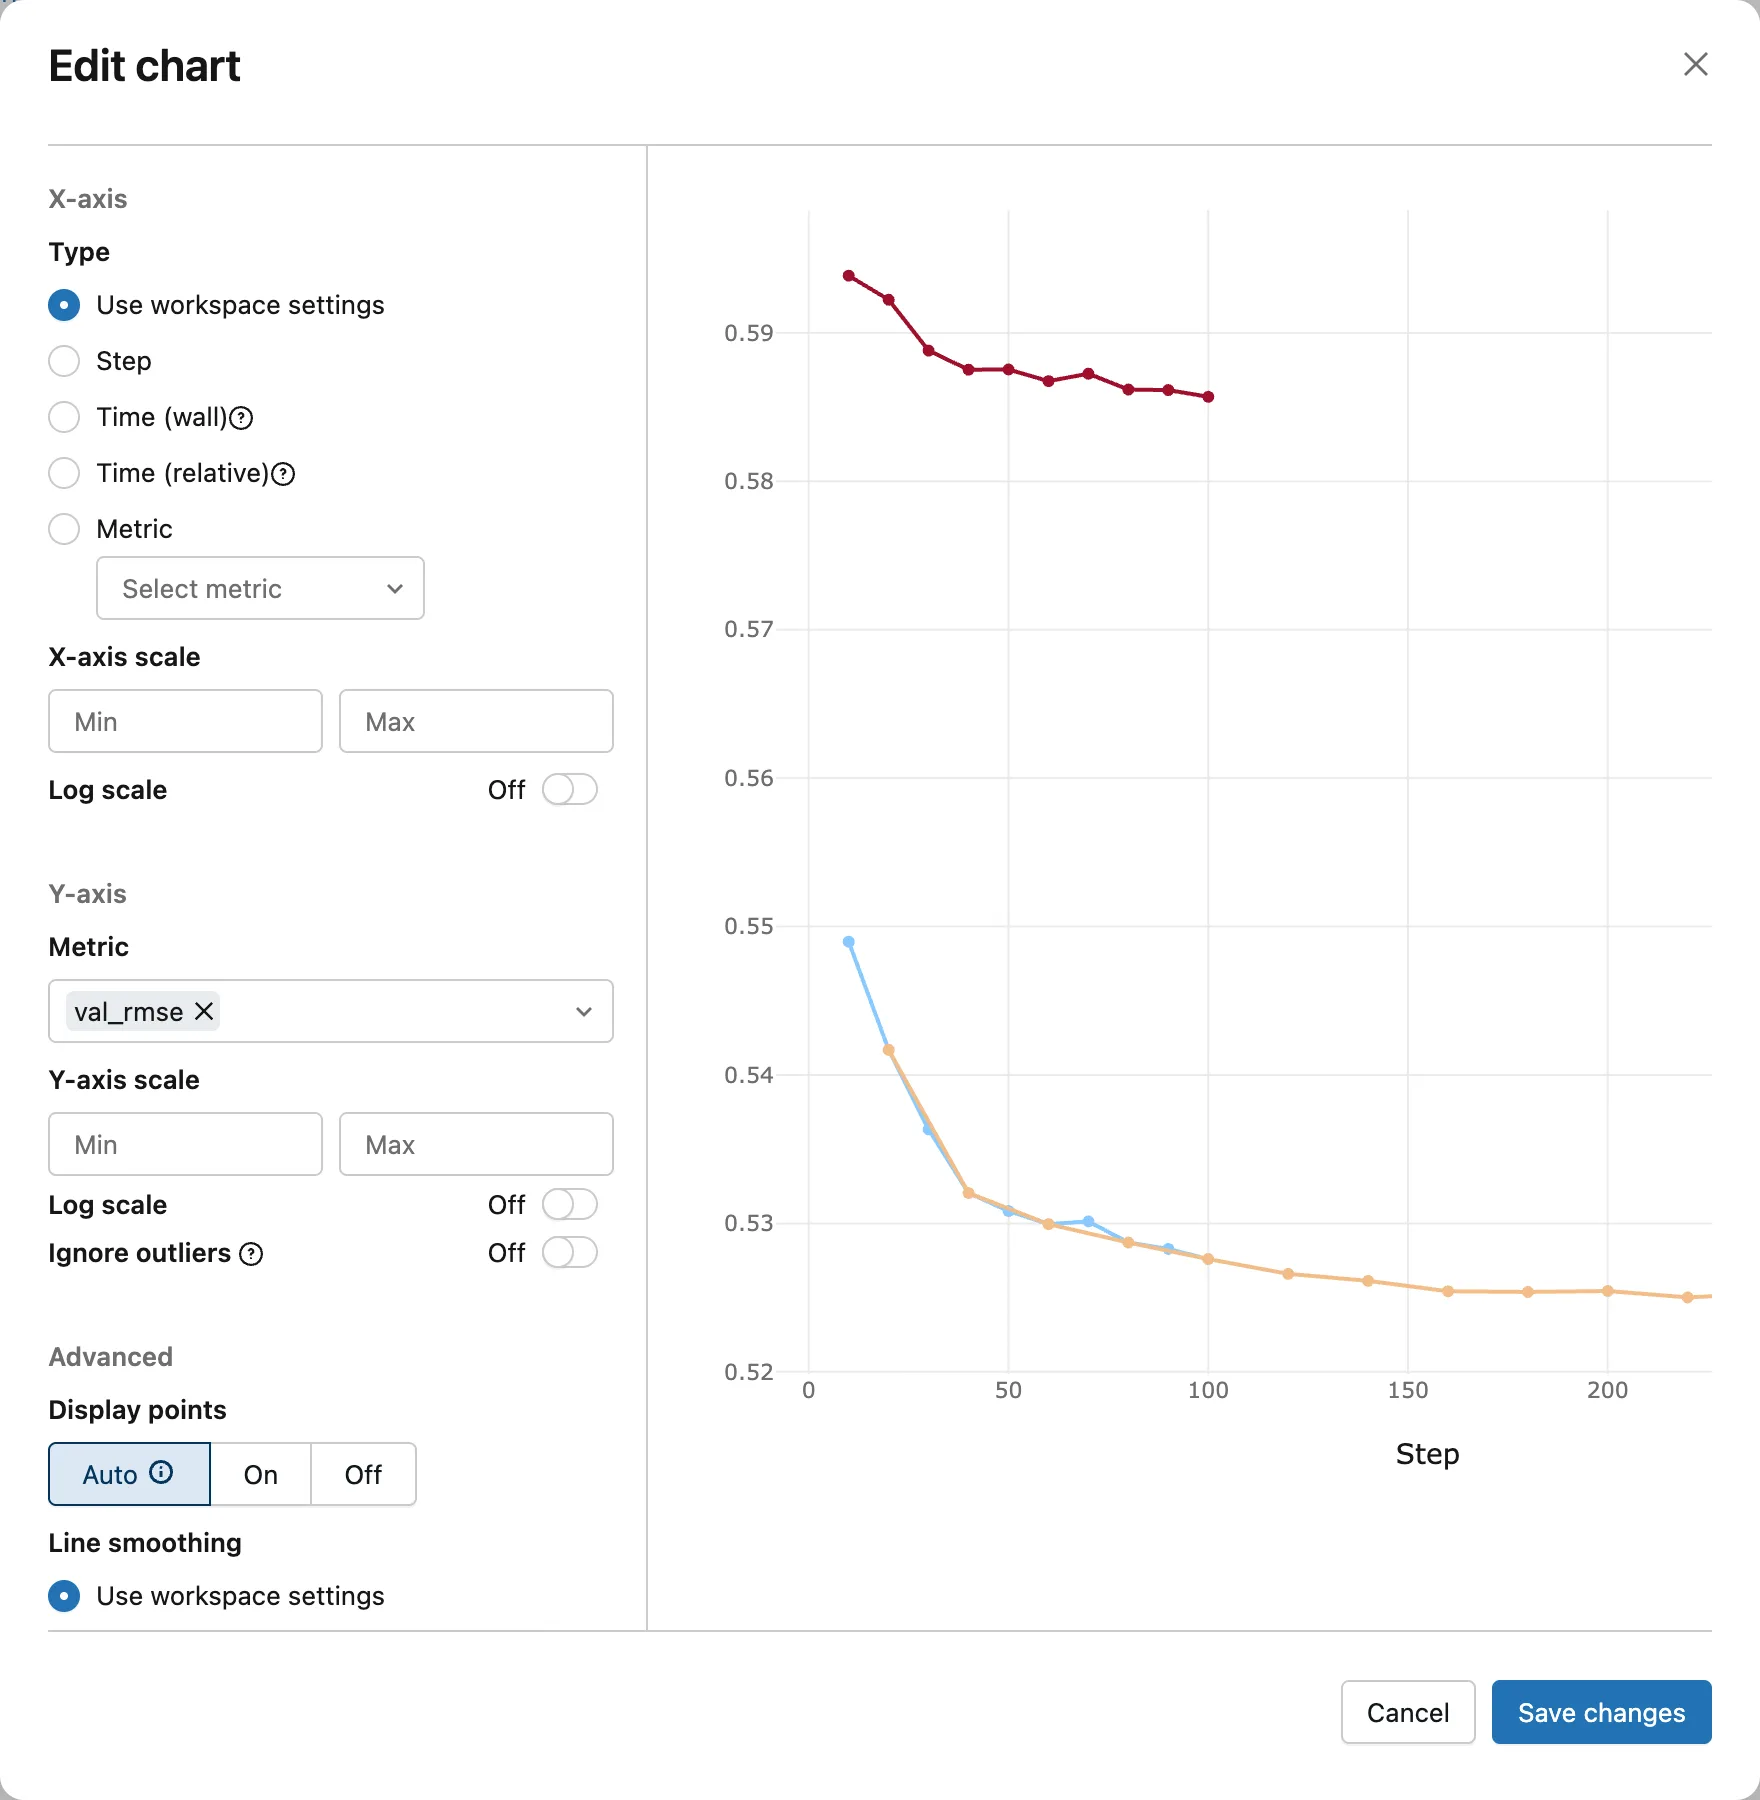
| Choice | What the chart runs along |
|---|---|
| Use workspace settings | The chart view's own setting, which is Step until you change it in Step 6 |
| Step | The step each value was logged with: here, the number of trees |
| Time (wall) | "Absolute date and time": the moment each value was logged |
| Time (relative) | "Amount of time that has passed since the first metric value was logged", in seconds |
| Metric | Another metric, which you pick from a list |
The quotes are the tooltips of the ? icons. The red line is on top in this preview, so the green one is underneath.
The preview is wider than its box: in MLflow 3.18.0 the chart is drawn 700 pixels wide in a box 516 pixels wide, so the curves that go on to 300 trees stop at about 225. Scroll the preview sideways to see the rest. The saved chart shows all of it.
Step 3: See What Time (Wall) Does
Select Time (wall). The preview puts every value at the clock time it was logged:
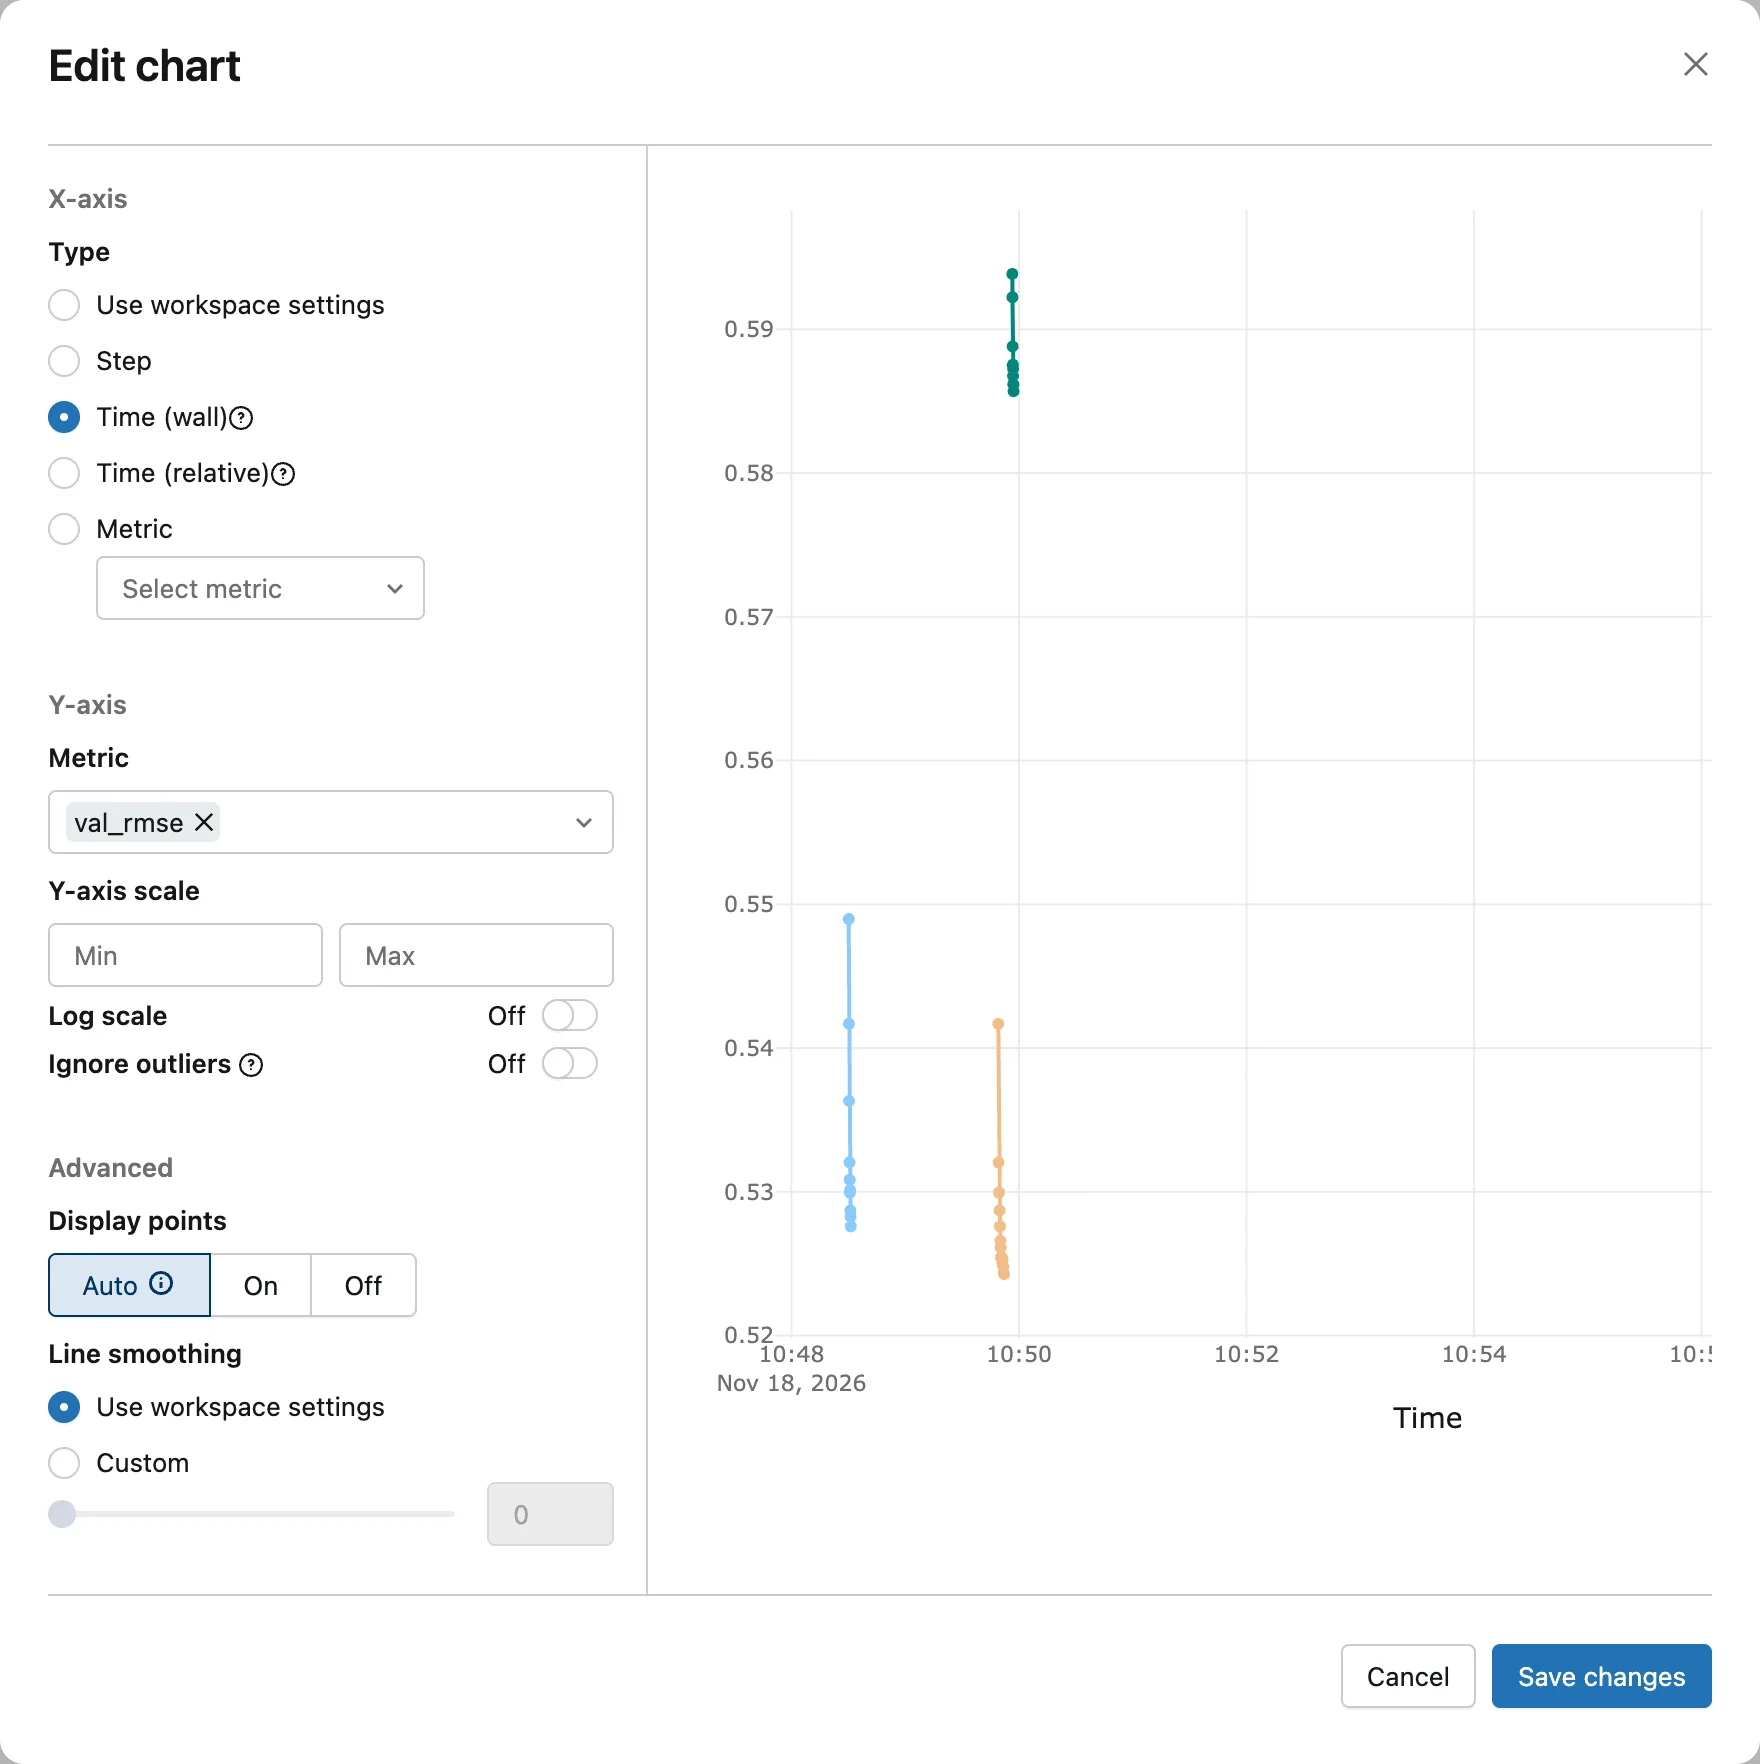
Each run logged all its values within about three seconds, so each one shrinks to an almost vertical line at the minute it ran. The red run started at 10:58, off the right edge of the preview. Wall time answers "when did this happen?", such as which runs ran before a change you made; to compare curves, the next choice works better.
Step 4: Plot Against the Time Since the First Value
Select Time (relative). Every run now starts at 0, and its curve lasts as long as the run took:
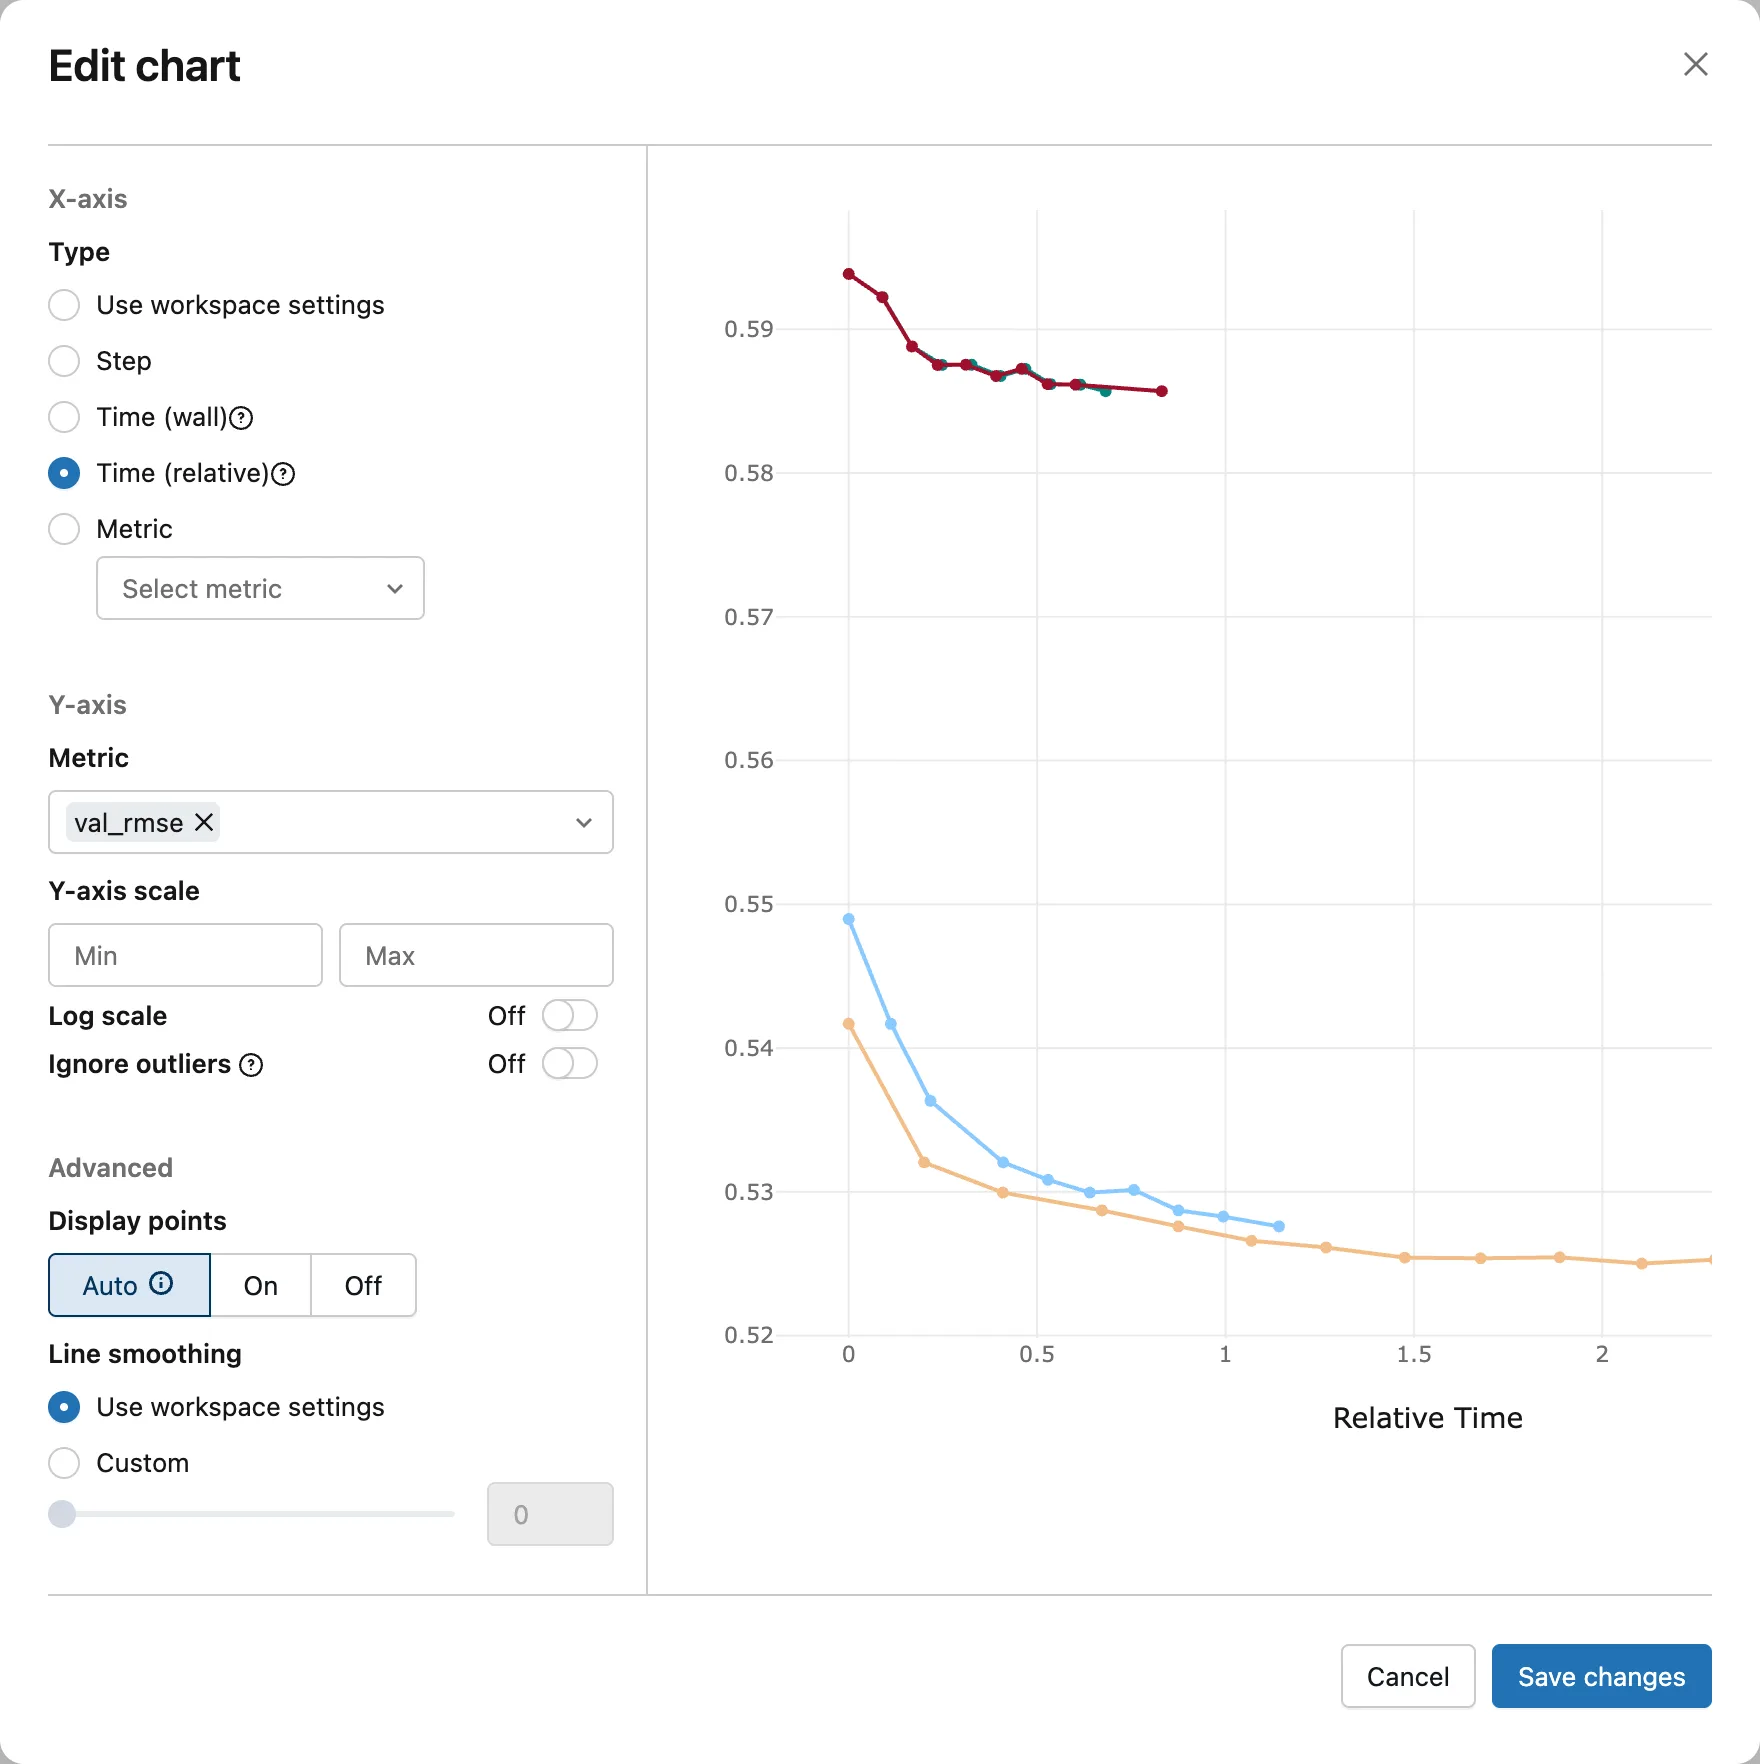
Click Save changes. The chart on the page switches, while its neighbors stay on Step:
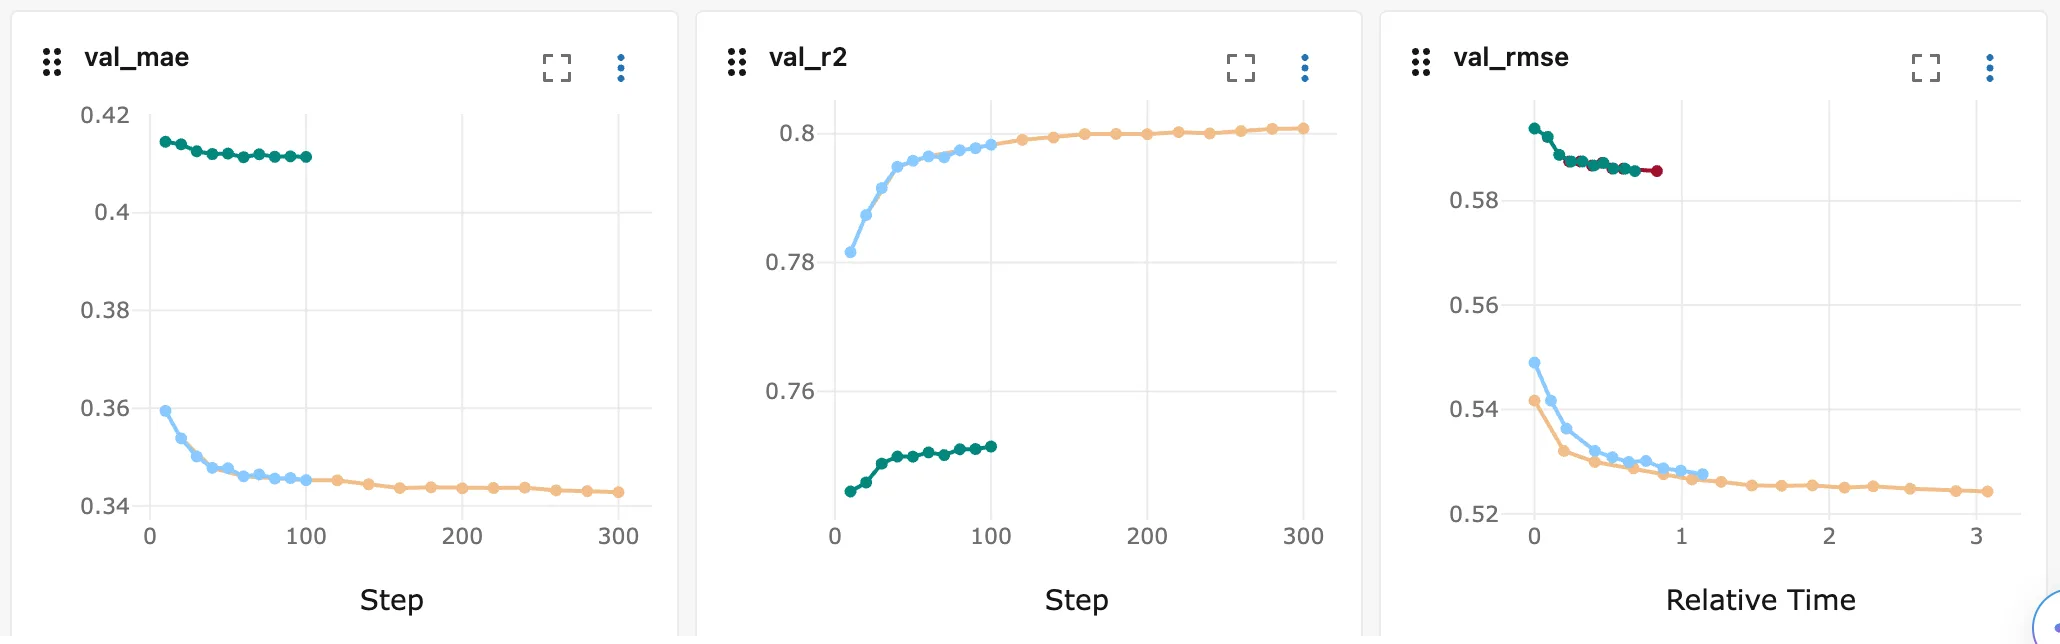
The 300-tree run took about 3 seconds from its first score to its last, the 100-tree run about 1.1. And the red run shows at last: the same scores at the same steps as the green run, but 0.83 seconds from first to last instead of 0.68. A Step chart can't show that difference; a time chart can.
Step 5: Plot One Metric Against Another
Open Configure again and select Metric. Its list holds every metric of the runs, the system/ metrics too. Choose val_mae:
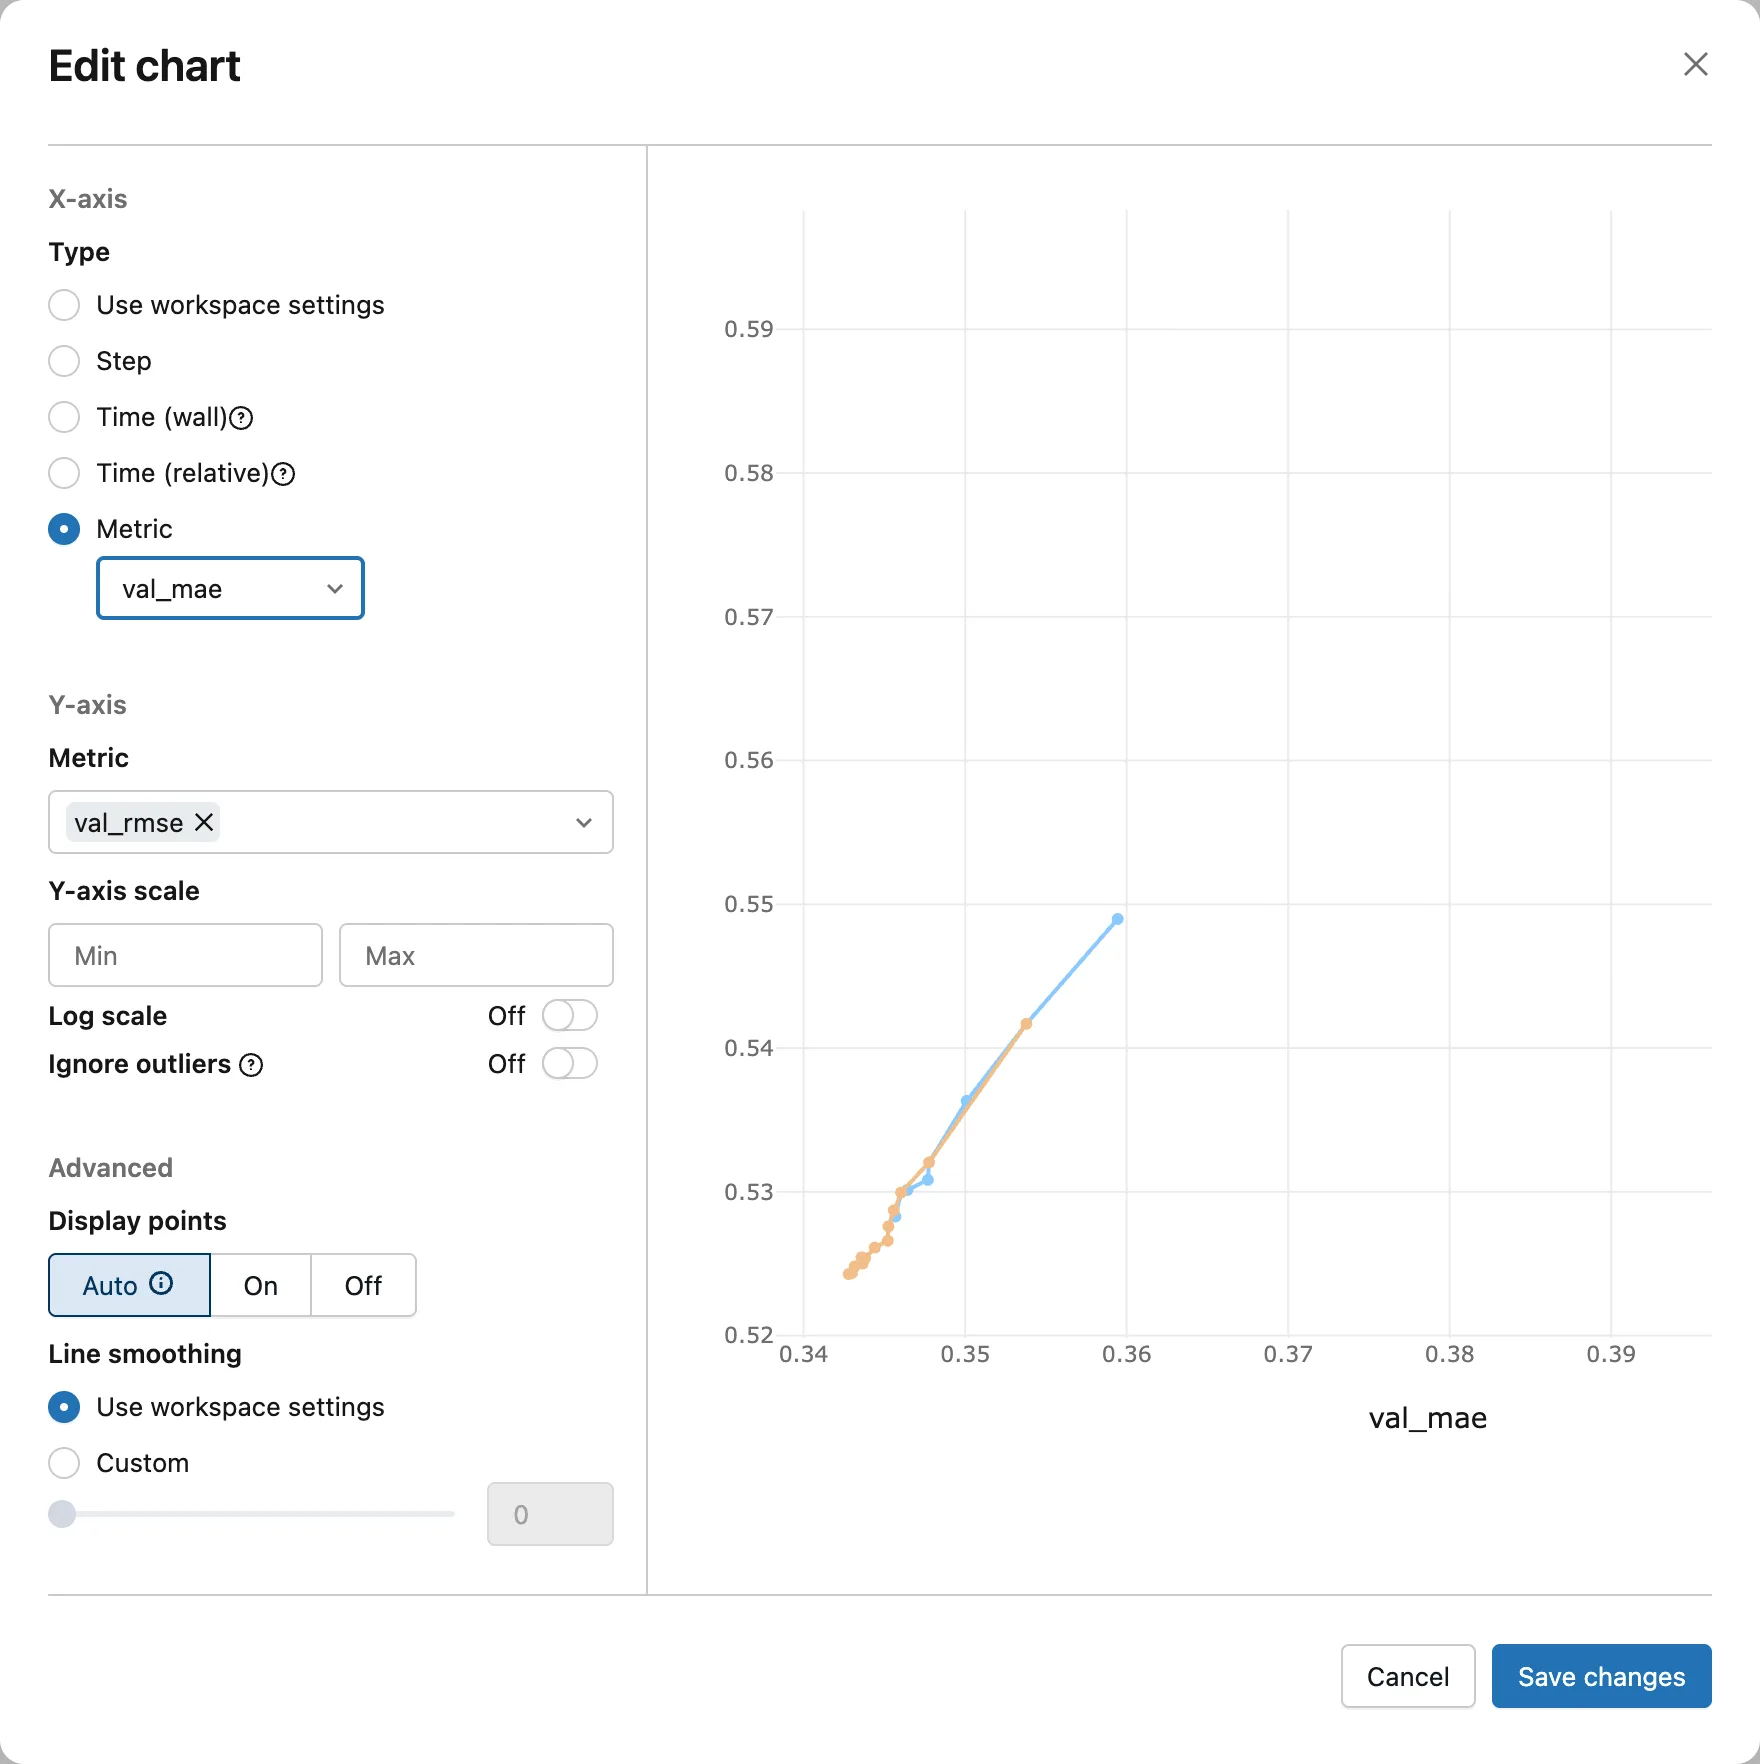
Each point now pairs two values logged at the same step: val_mae across and val_rmse up. The blue run's first point, for example, is its 10-tree score, 0.359 across and 0.549 up. Click Save changes:
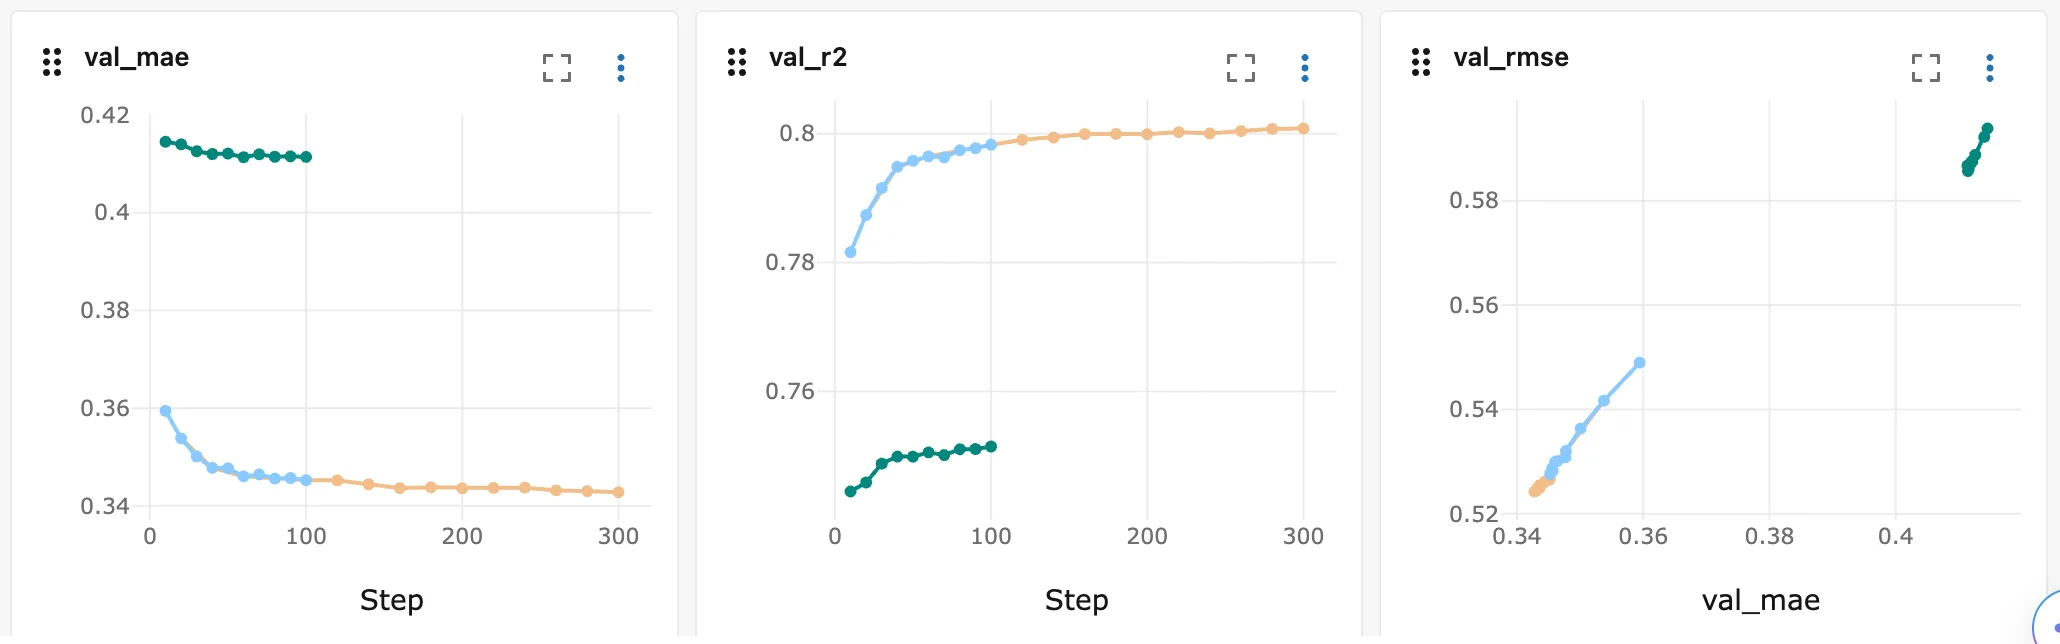
The two errors fall together as trees are added, so each run draws a short diagonal line, and the depth-8 runs sit apart at the top right, worse on both. In the preview they were past its right edge, near 0.41.
To put the chart back, open Configure, select Use workspace settings and click Save changes.
Step 6: Change Every Chart at Once
The gear icon to the right of Search metric charts opens the settings of the whole chart view, the "workspace": an X-axis for every chart set to Use workspace settings, and Line smoothing:
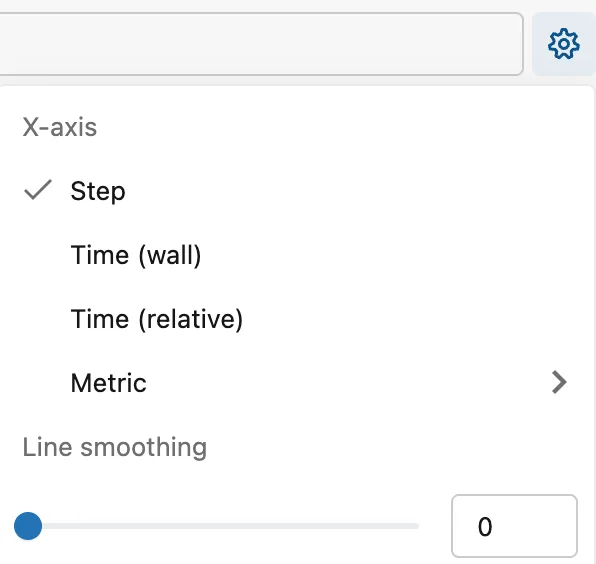
Choose Time (relative). All three line charts switch together:
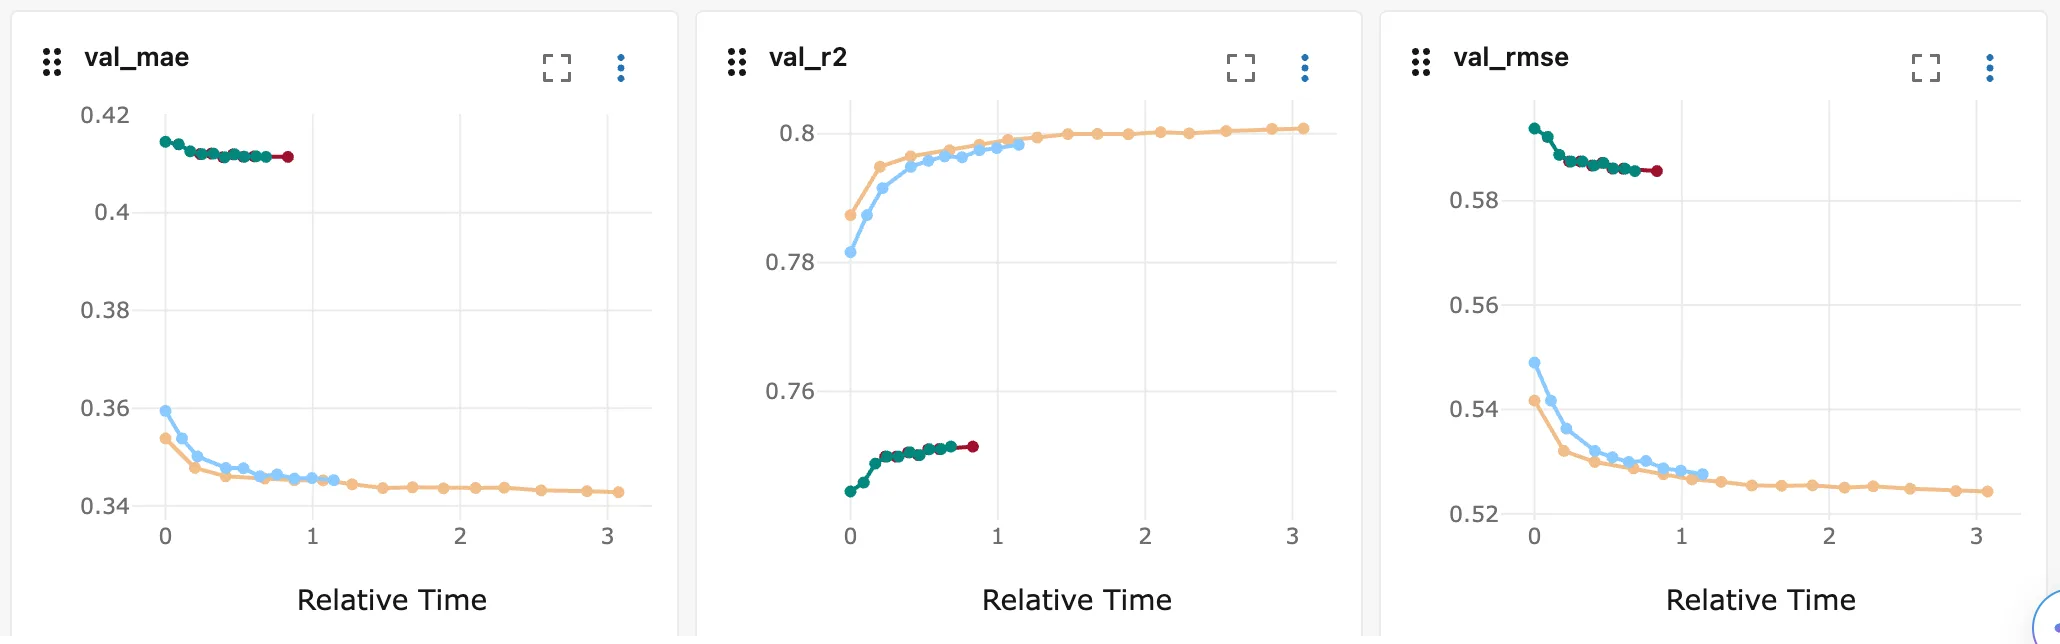
The bar charts of mae, r2 and rmse don't change: those metrics were logged once per run, so their charts have no X-axis to set. Choose Step in the same menu to go back.
A chart set to anything other than Use workspace settings keeps its own X-axis. With val_rmse set to Step in its Edit chart dialog, choosing Time (relative) here switched val_mae and val_r2 and left val_rmse on Step. That keeps one chart as it is while you change the rest.
Where the UI Keeps These Settings
MLflow 3.18.0 saves them in your browser's local storage, in one entry per experiment, so they're still there after a reload. The tracking server keeps none of them: its database has no record of them. Changing the X-axis changes only how the charts are drawn, never the logged values.
Common Mistakes
| Mistake | What happens | Do this instead |
|---|---|---|
| Judging how long training took from a Step chart | Step shows how far training got, not how long it took | Switch to Time (relative) |
| Comparing runs made at different times on Time (wall) | Each run shrinks to a sliver at its own time of day | Use Time (relative): every run starts at 0 |
| Reading the preview as the whole chart | Its right end is cut off | Scroll the preview sideways, or save and read the chart |
| Changing the gear's X-axis for a chart with its own setting | That chart keeps its own X-axis | Set it to Use workspace settings first |
Troubleshooting
| Symptom | Likely cause | Fix |
|---|---|---|
| The preview's curves stop partway | The preview is drawn wider than its box | Scroll it sideways; the saved chart shows all of it |
| One chart ignores the gear's X-axis | It's set to its own X-axis | Configure → Use workspace settings |
| Your chart settings are missing in another browser | They're saved in the browser where you made them | Set them again there |
| Two runs share one line on a Step chart | They logged the same values at the same steps | Switch to a time X-axis, where their timing differs |
FAQ
Can I set the X-axis from Python?
No, it's a setting of the UI. In code, MlflowClient().get_metric_history() returns each value's step and timestamp, so you can plot either one: How to Get the History of a Metric in MLflow.
Can I smooth a noisy curve?
Yes: Line smoothing sits in the Edit chart dialog for one chart and in the gear menu for every chart.
Why do the System metrics charts run along time?
System metrics are samples MLflow takes every few seconds while a run works, so the UI charts them against time rather than step: How to Turn On System Metrics Logging in MLflow.
Conclusion
Configure in a chart's ⋮ menu changed that chart's X-axis: Step for progress, Time (wall) for the moment each value was logged, Time (relative) for the seconds since the first value, and Metric to plot one metric against another at the same steps. The gear changed every chart that uses the workspace settings at once. MLflow 3.18.0 keeps those choices in the browser, and the preview in Edit chart scrolls sideways when the chart is wider than its box.
Additional Resources
- MLflow Tracking UI — MLflow's documentation of the UI.
- MlflowClient.get_metric_history — the same values, read from Python.
