How to Change the System Metrics Sampling Interval in MLflow

By default, MLflow samples the computer's CPU, memory, disk and network every 10 seconds. That suits a training job that runs for an hour, but a run that lasts a minute gets about five points, and a run shorter than 10 seconds gets none. Two functions change how often MLflow samples and how many samples it averages into each point. This guide tries three settings on the same run, with real output from MLflow 3.18.0.
Syntax
import mlflow

mlflow.set_system_metrics_sampling_interval(<seconds>)
mlflow.set_system_metrics_samples_before_logging(<samples>)
| Part | What it means |
|---|---|
set_system_metrics_sampling_interval(<seconds>) | "Every interval seconds, the system metrics will be collected. By default interval=10." |
set_system_metrics_samples_before_logging(<samples>) | "Every time samples samples have been collected, the system metrics will be logged to mlflow. By default samples=1." Each logged point is the average of those samples |
None | Passing None to either function goes back to the default |
Both functions apply to every run the program starts after the call. MLflow's documentation sums up how they combine: "The actual logging time window is the product of" the two.
Prerequisites
- System metrics turned on, with psutil installed: How to Turn On System Metrics Logging in MLflow.
- A running tracking server at
http://127.0.0.1:8080: How to Start an MLflow Tracking Server on Your Computer.
Step 1: Try Three Settings on the Same Run
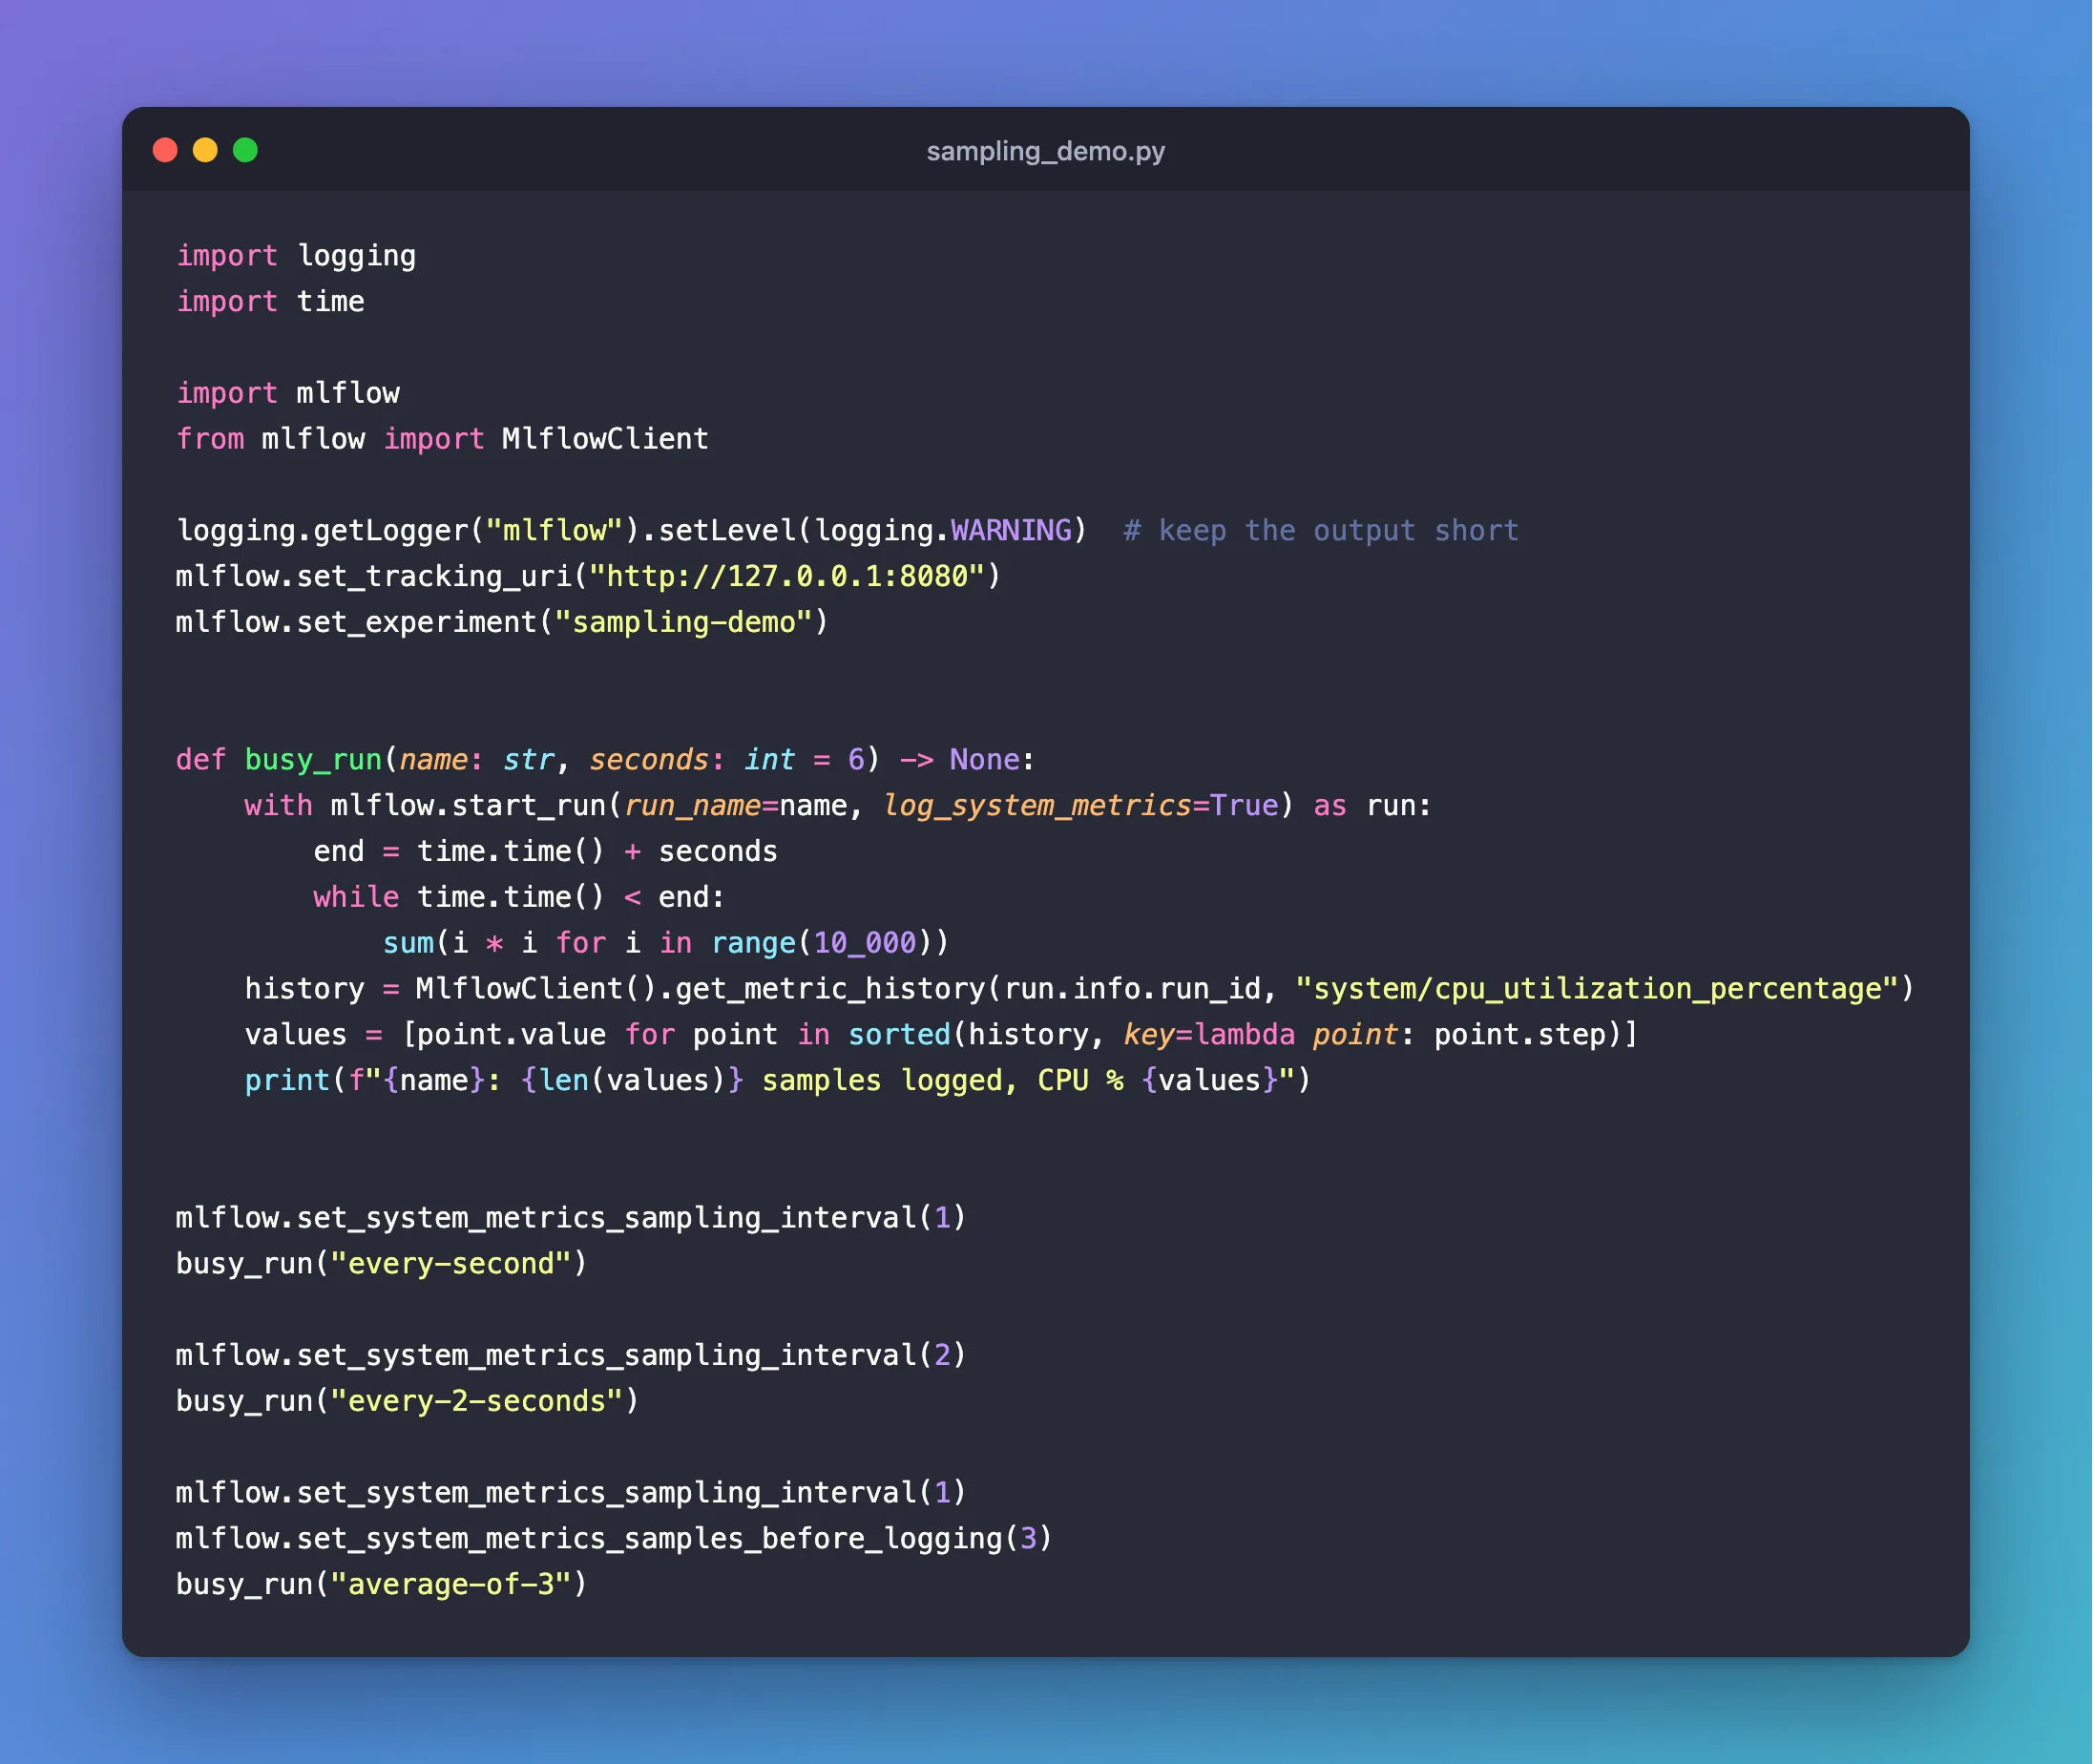
The example runs the same six-second busy loop three times, sampling every second, every two seconds, and every second with three samples averaged into each point. Create sampling_demo.py:
import logging
import time

import mlflow
from mlflow import MlflowClient

logging.getLogger("mlflow").setLevel(logging.WARNING)  # keep the output short
mlflow.set_tracking_uri("http://127.0.0.1:8080")
mlflow.set_experiment("sampling-demo")


def busy_run(name: str, seconds: int = 6) -> None:
    with mlflow.start_run(run_name=name, log_system_metrics=True) as run:
        end = time.time() + seconds
        while time.time() < end:
            sum(i * i for i in range(10_000))
    history = MlflowClient().get_metric_history(run.info.run_id, "system/cpu_utilization_percentage")
    values = [point.value for point in sorted(history, key=lambda point: point.step)]
    print(f"{name}: {len(values)} samples logged, CPU % {values}")


mlflow.set_system_metrics_sampling_interval(1)
busy_run("every-second")

mlflow.set_system_metrics_sampling_interval(2)
busy_run("every-2-seconds")

mlflow.set_system_metrics_sampling_interval(1)
mlflow.set_system_metrics_samples_before_logging(3)
busy_run("average-of-3")
| Line | What it does |
|---|---|
logging.getLogger("mlflow").setLevel(logging.WARNING) | Hides MLflow's start and stop messages, so the output shows only the results |
busy_run | Starts a run with system metrics on, keeps one CPU core busy for six seconds, then reads back every CPU sample the run logged |
get_metric_history(...) | Returns every logged point of system/cpu_utilization_percentage: How to Get the History of a Metric in MLflow |
| The last five lines | Change the settings between runs: every second, every two seconds, then every second averaged over three samples |
Step 2: Run It
uv run python sampling_demo.py
🏃 View run every-second at: http://127.0.0.1:8080/#/experiments/4/runs/bb621b879fb344f1af8a2680b0e58dbd
🧪 View experiment at: http://127.0.0.1:8080/#/experiments/4
every-second: 4 samples logged, CPU % [0.0, 40.7, 50.4, 44.8]
🏃 View run every-2-seconds at: http://127.0.0.1:8080/#/experiments/4/runs/1b22fd515e004276b06e8c23ed5f6bde
🧪 View experiment at: http://127.0.0.1:8080/#/experiments/4
every-2-seconds: 2 samples logged, CPU % [0.0, 45.5]
🏃 View run average-of-3 at: http://127.0.0.1:8080/#/experiments/4/runs/06e0c9dced7a477da3eef91d452580d2
🧪 View experiment at: http://127.0.0.1:8080/#/experiments/4
average-of-3: 1 samples logged, CPU % [46.9]
Step 3: Read the Results
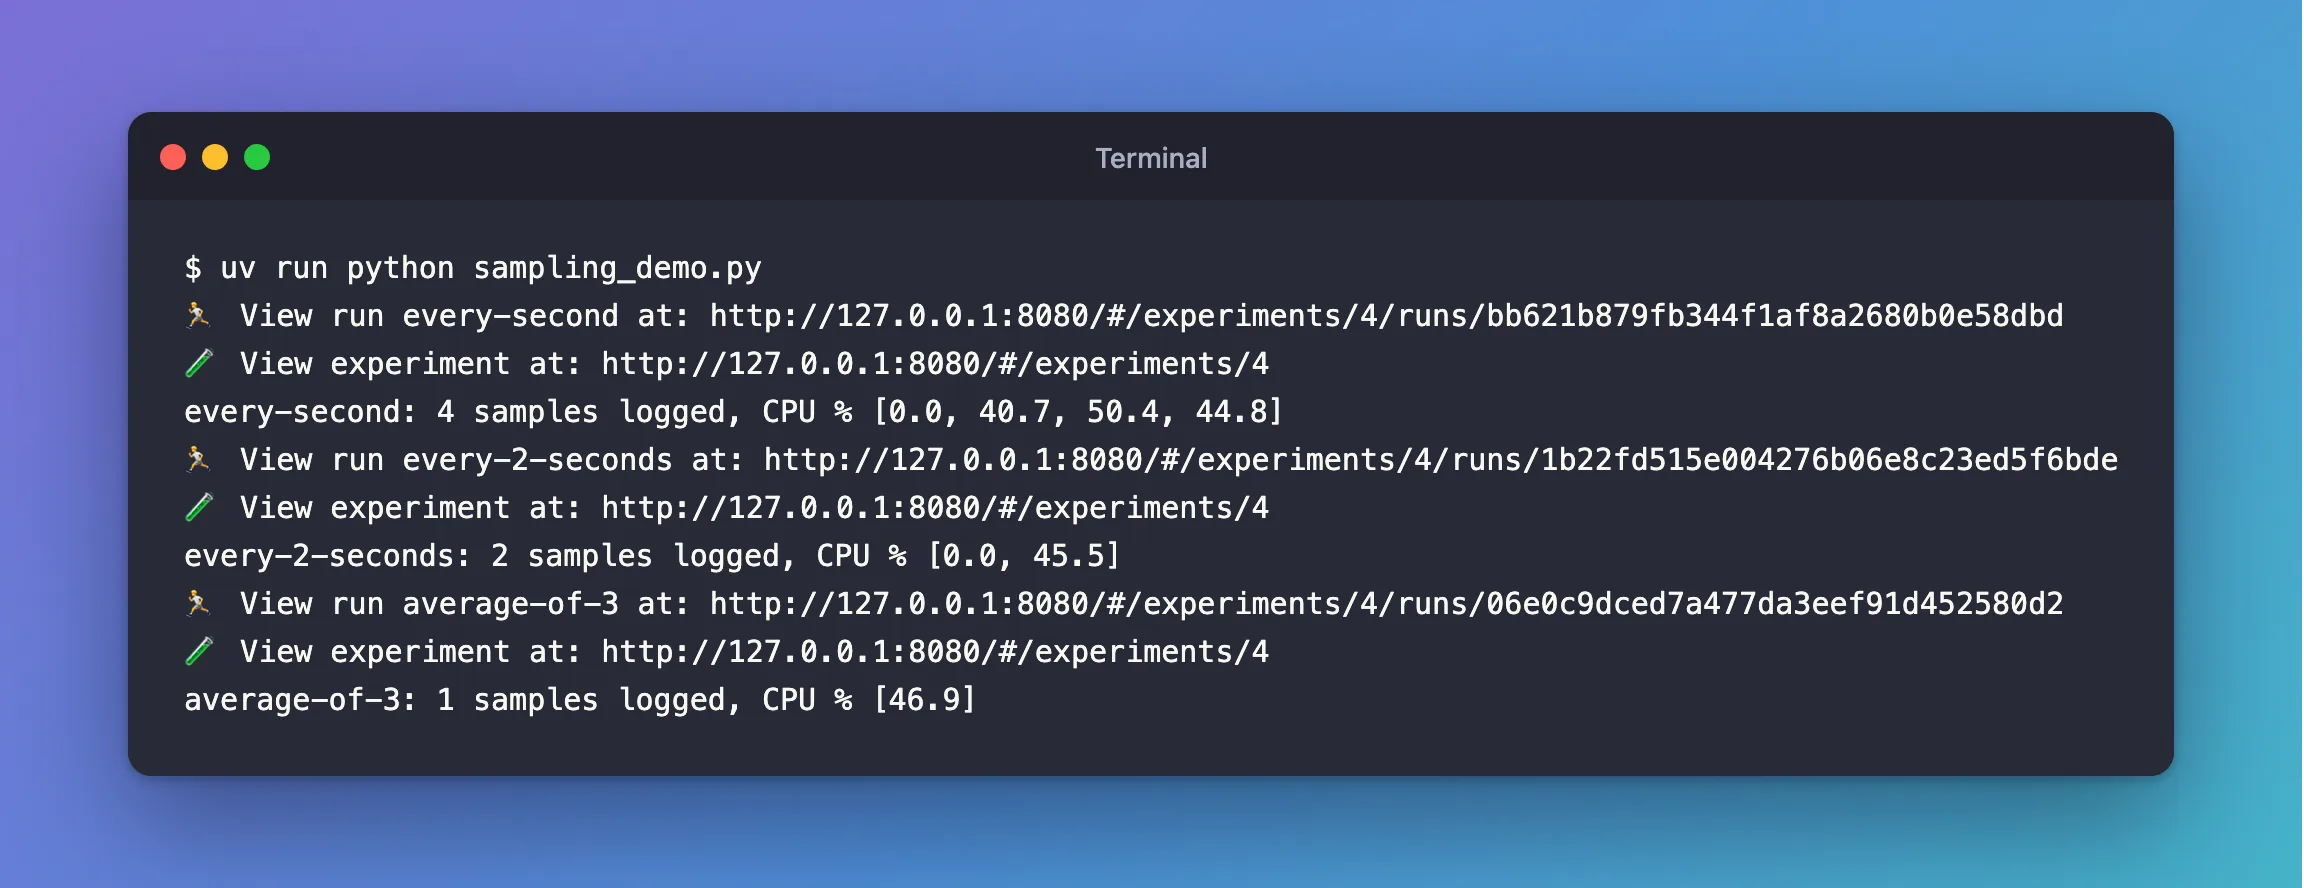
Every second: 4 points in a six-second run, not 6. MLflow's monitor takes a sample, waits one interval, checks with the tracking server that the run is still going, and only then logs the sample. When the run ends, the sample it's waiting on is dropped. So a run gets fewer points than its length divided by the interval.
Every two seconds: 2 points. Half the samples, for the same run.
Three samples averaged: 1 point. One point every three seconds, each the average of three samples. The first average includes the first sample, which is always 0.0: psutil, which MLflow uses to read CPU use, returns "a meaningless 0.0 value" the first time it's called in a thread, and every run starts a new one.
The rule that follows: a run records a point only if it's still running one full window after the window began, where the window is the interval times the samples. A run shorter than one window records nothing at all, and its System metrics tab shows "No charts in this section": Fixed: "No charts in this section" on the MLflow System Metrics Tab.
Step 4: Set It Without Changing the Code
set_system_metrics_sampling_interval() stores its value in an environment variable MLflow reads, MLFLOW_SYSTEM_METRICS_SAMPLING_INTERVAL. Set it yourself to change the interval for one program without editing it:
- macOS / Linux
- Windows (PowerShell)
MLFLOW_SYSTEM_METRICS_SAMPLING_INTERVAL=1 uv run python train.py
$env:MLFLOW_SYSTEM_METRICS_SAMPLING_INTERVAL = "1"
uv run python train.py
Remove-Item Env:MLFLOW_SYSTEM_METRICS_SAMPLING_INTERVAL
Here train.py stands for your own script. A call to the function in the code overrides the variable, because the function sets the same variable.
Common Mistakes
| Mistake | What happens | Do this instead |
|---|---|---|
| Keeping the 10-second default for runs that last seconds | The run ends before anything is logged | Sample more often than your shortest run lasts |
Setting the interval after start_run | The run already started its monitor with the old setting | Call the functions before start_run |
| Averaging many samples on a short run | Fewer points, and the first one includes the meaningless 0.0 | Keep samples_before_logging at 1 for short runs |
| Expecting run length ÷ interval points | The last sample is dropped when the run ends | Expect one or two fewer |
Troubleshooting
| Symptom | Likely cause | Fix |
|---|---|---|
| System metrics (0), "No charts in this section" | The run was shorter than one interval times the samples | A shorter interval, or fewer samples per point |
| Every run's CPU chart starts at 0 | psutil's first reading in each run's monitor thread | Expected: read from the second point on |
| No system metrics whatever the interval | System metrics aren't turned on, or psutil is missing | How to Turn On System Metrics Logging in MLflow |
FAQ
What interval should I use?
One that gives your typical run a useful number of points: for a run of a few seconds, a second or less; for an hour-long run, the default 10 seconds gives about 360 points. Each sample also asks the tracking server about the run, so very short intervals mean more requests.
Can the interval be less than a second?
Yes: MLflow reads the interval as a decimal number of seconds. psutil's documentation recommends at least 0.1 seconds between CPU readings for accuracy.
Why average samples at all?
To smooth out spikes on long runs, and to log fewer points. On a run that lasts seconds, it mostly removes the detail you wanted.
Conclusion
mlflow.set_system_metrics_sampling_interval() set how often MLflow samples the computer, and mlflow.set_system_metrics_samples_before_logging() how many samples it averages into each point. On the same six-second run, sampling every second logged 4 points, every two seconds 2, and three-sample averages 1. A point is logged only if the run is still going a full window later, so pick an interval shorter than your runs.
Additional Resources
- System Metrics — MLflow's guide, including the sampling settings and their environment variables.
- mlflow.set_system_metrics_sampling_interval — the reference for the function.
