How to Add Up a Column in Power BI with SUM

SUM adds up the numbers in a column. As a measure, it gives the total of whatever a visual or filter has selected: every row, one category, one month. Here's its general form and a total of expense claims.
Syntax
SUM(<column>)
From Microsoft's SUM function reference:
<column>: the column that contains the numbers to sum, written asTable[Column].- The result is a decimal number.
- To sum an expression rather than a column, such as price times quantity, the reference points to SUMX.
The example is a measure on the Expenses table of a semantic model with five approved expense claims, whose Amount column holds 45.50, 120.00, 35.00, 18.20 and 75.00.
Step 1: Create the Measure
Select the Expenses table and New measure (How to Create a Measure in Power BI in the Browser), and enter:
Total amount = SUM(Expenses[Amount])
Total amountis the measure's name.Expenses[Amount]is the column to add up: the Amount column of the Expenses table.

Press Enter.
Step 2: Show It in a Report
On a card (How to Add a Card to a Power BI Report), Total amount shows 293.70, the five amounts added up. The table next to it ends with the same total:
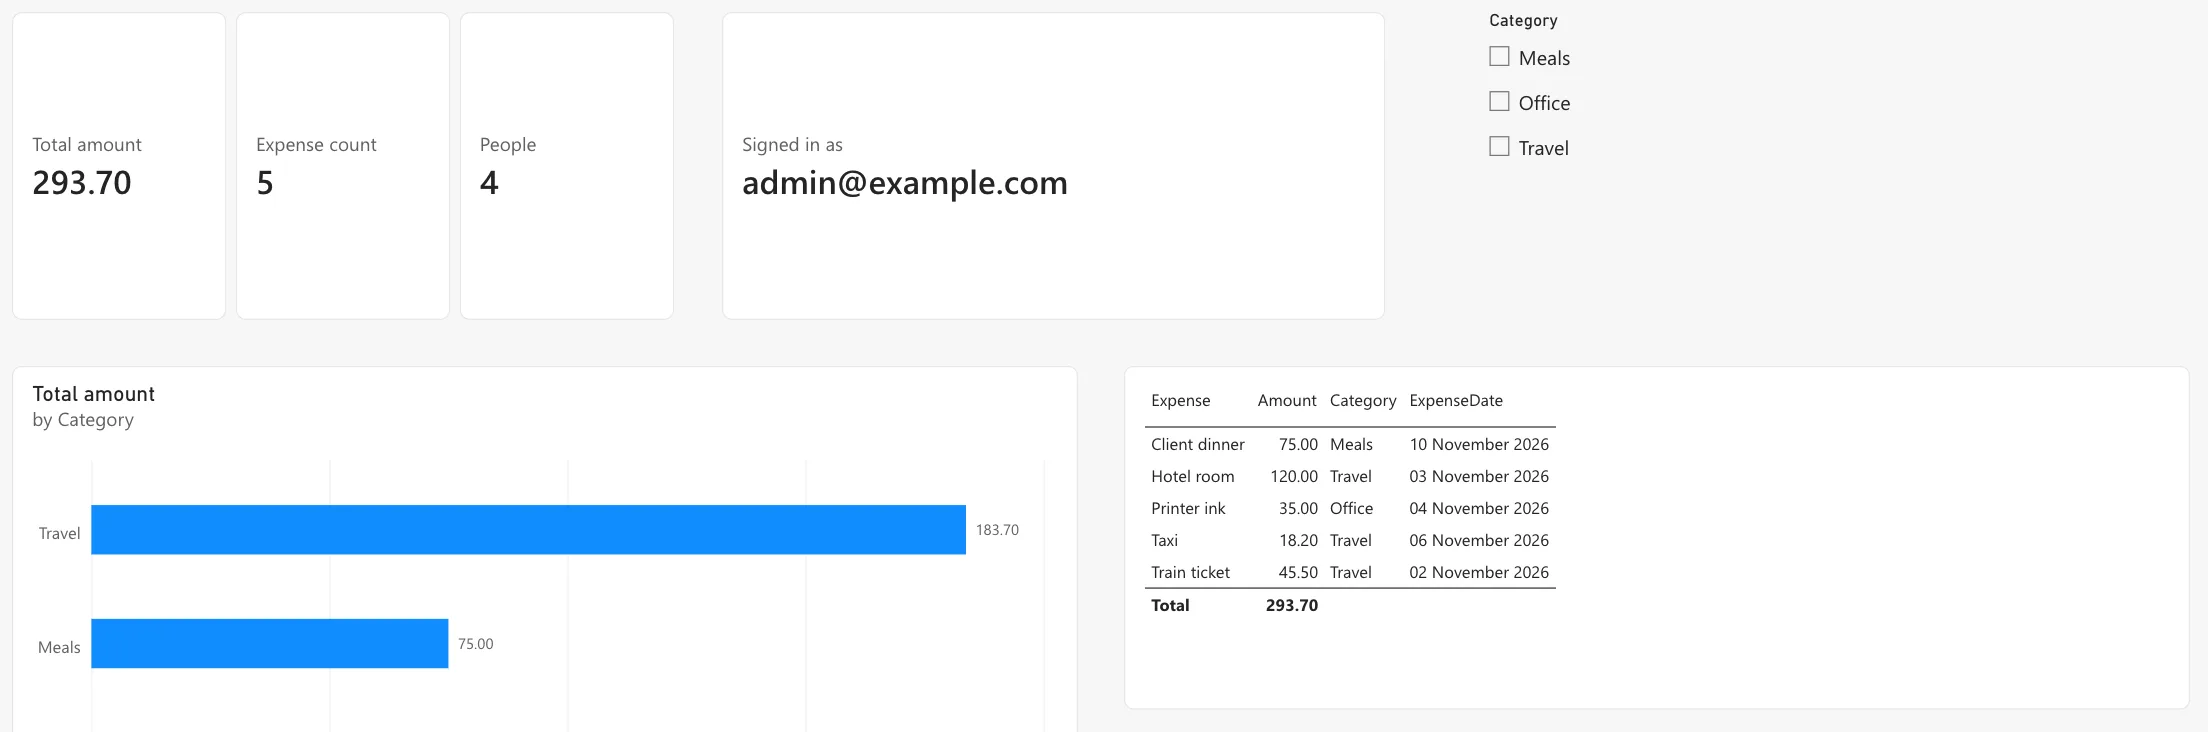
The bar chart uses the same measure per category: 183.70 for Travel and 75.00 for Meals. The measure follows whatever the visual groups or filters by.
Common Mistakes
| Mistake | What happens | Do this instead |
|---|---|---|
SUM(Expenses) | An error: SUM takes a column, not a table | SUM(Expenses[Amount]) |
| Summing a column stored as text | An error, or nothing to sum | Make the column a number in Power Query |
SUM(Expenses[Amount] * 2) | An error: SUM takes only a column | SUMX(Expenses, Expenses[Amount] * 2) |
Troubleshooting
| Symptom | Likely cause | Fix |
|---|---|---|
| The total is blank | No rows are selected by the filters | Check the slicers and filters |
| The total is too high | Rows are repeated, for example after expanding a list column | Check the table's rows in Power Query |
| Too many decimals | The measure's format is the default | Set two decimal places (How to Show a Measure with Two Decimal Places in Power BI) |
FAQ
Why a measure rather than the column's own sum?
A report can sum a numeric column by itself, but a measure has a name, a format and one definition that every report shares.
What's the difference between SUM and SUMX?
SUM adds a column; SUMX works out an expression for each row of a table and adds the results.
Conclusion
SUM(Table[Column]) adds up a column. The example's Total amount = SUM(Expenses[Amount]) showed 293.70 for all five claims, and each category's share on a chart.
