How to Add Up a Column in Power Apps with Sum

Sum adds up the values of a column: Sum(Table, Column). Wrap the table in Filter to add up only some rows. With a SharePoint list, add up the rows after loading them into a variable, because SharePoint can't do the adding for Power Apps.
The example is the Overtime Timesheet app, whose My Overtime screen shows each person's total for the month.
Syntax
Sum(Table, NumericalFormula)
Sum(NumericalFormula1, NumericalFormula2, ...)
- With a table, the formula is worked out for each row and the results are added. It's usually just a column name.
- With separate values, they're added:
Sum(1, 2, 3)is 6 (Average, Max, Min, StdevP, Sum, and VarP functions).
Step 1: Add Up a Column
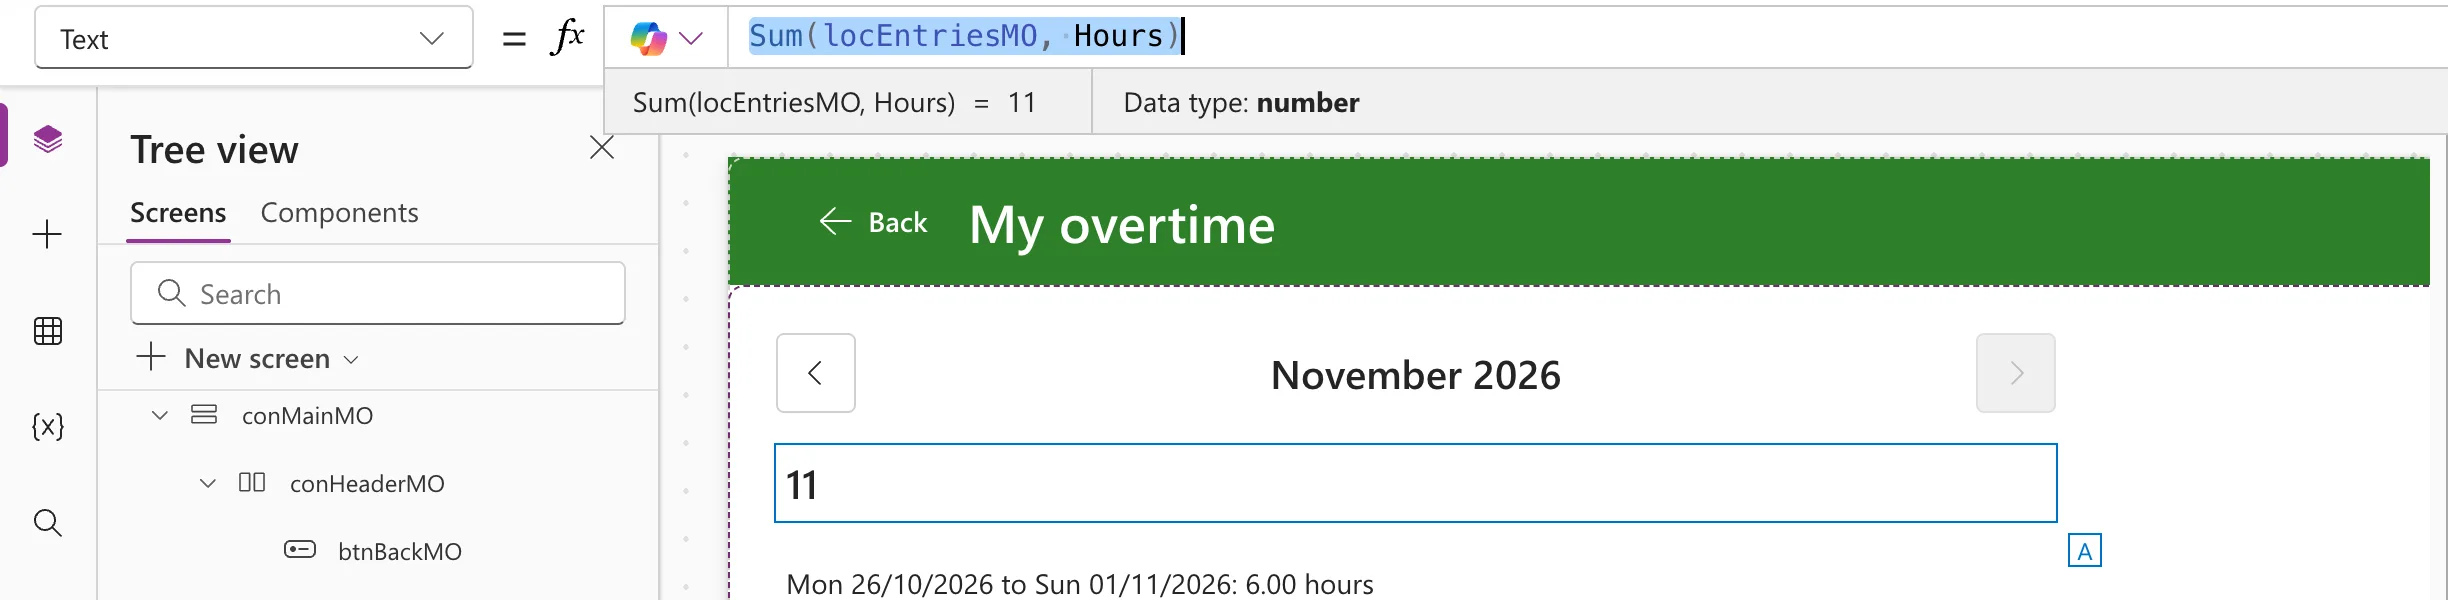
The example screen keeps the month's entries in a context variable, locEntriesMO. For November 2026 it held three entries of 4, 3 and 4 hours. I put the formula into a text control's Text for a moment, so Studio's preview strip shows the result (How to See What a Formula Returns in Power Apps Studio):
Sum(locEntriesMO, Hours)
Step 2: Add Up Some Rows
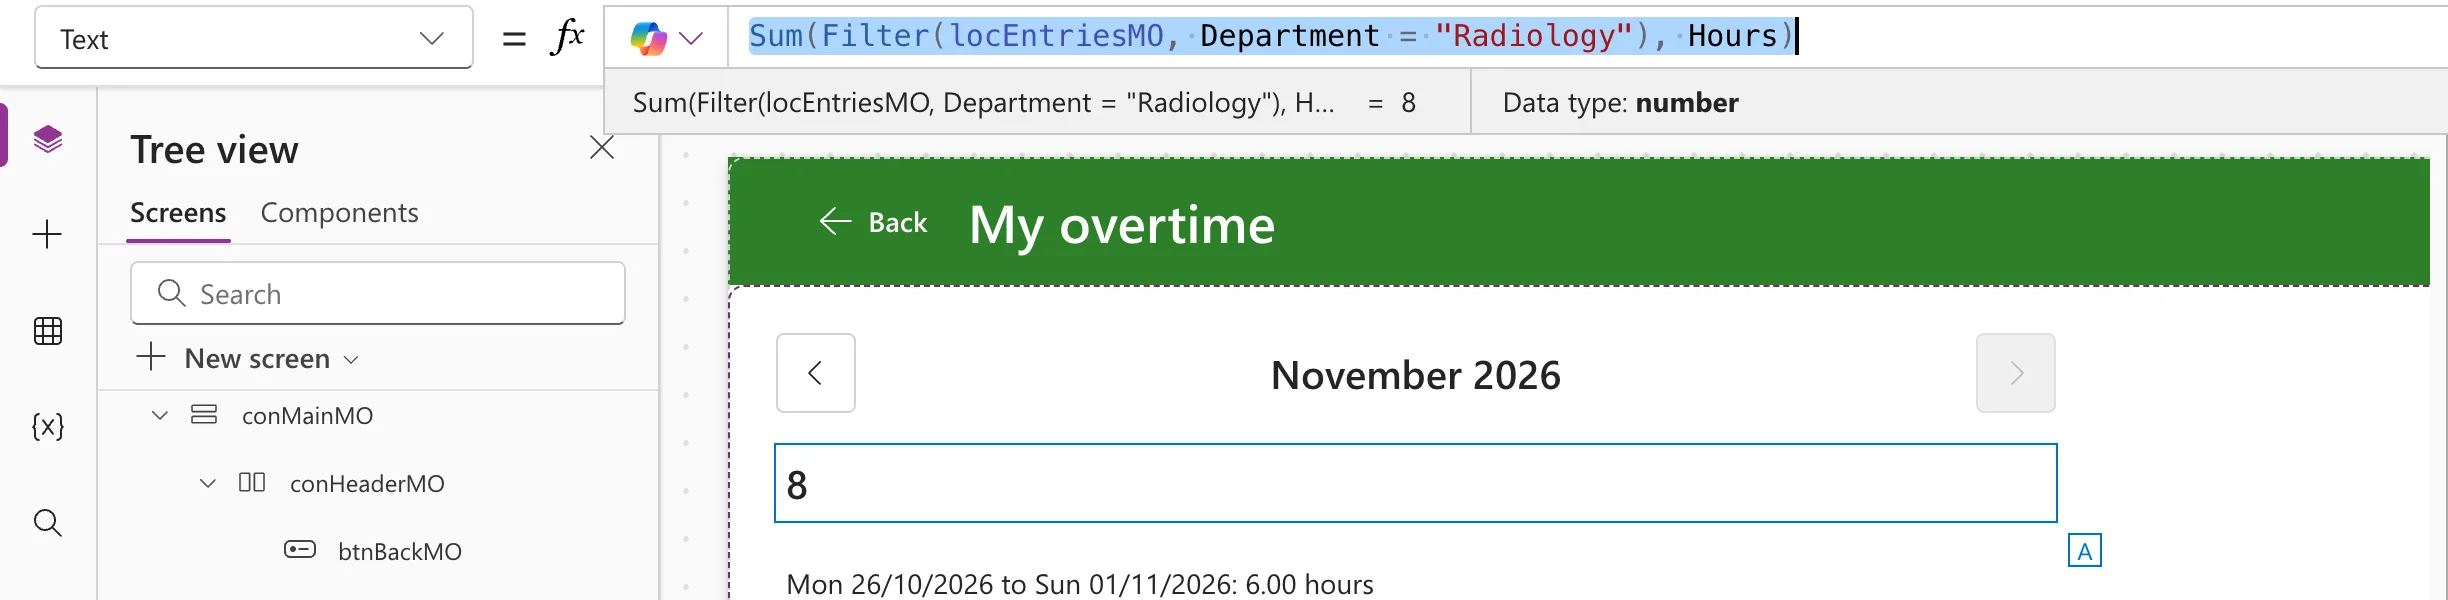
Filter first, then Sum what's left (How to Filter a Table in Power Apps with Filter). Two of the three entries were for Radiology:
Sum(Filter(locEntriesMO, Department = "Radiology"), Hours)
When There's Nothing to Add
In a month with no entries, locEntriesMO held no rows, and Studio's preview strip read = Blank for the screen's Sum, not 0. Wrap the Sum in Coalesce to get 0 instead (How to Replace Blank Values in Power Apps with Coalesce):
Coalesce(Sum(Table, Column), 0)
Without it, the example screen showed Total for September 2026: hours, with no number: Fixed: Sum Returns Blank Instead of 0 for an Empty Table in Power Apps.
Sum and SharePoint
Microsoft's reference says Sum can be delegated when used with a data source that supports delegation for these functions. SharePoint's delegation table doesn't list Sum, so Sum(SharePointList, Column) would add up only the first 500 rows Power Apps fetches, with a delegation warning.
So the example loads the rows it needs with a filter SharePoint can run, keeps them in a context variable, and adds them up there. Tables held by UpdateContext, With or Set are a static in-memory list (delegation overview), so Sum works on all of them without a warning. The loading formula: How to Filter a SharePoint List Between Two Dates in Power Apps.
How the Example Uses It
Rejected overtime doesn't count, so the month's total leaves it out:
$"Total for {Text(locMonthMO, "mmmm yyyy")}: {Text(Coalesce(Sum(Filter(locEntriesMO, Status.Value <> "Rejected"), Hours), 0), "0.00")} hours"
Status.Valueis the text of the Status Choice column (How to Show a SharePoint Choice Column's Value in Power Apps).Coalesce(…, 0)gives 0 for a month with nothing to add, including one whose only entries are rejected.Text(..., "0.00")always shows two decimal places, the way payroll counts hours.
While one November entry of 3.50 hours was rejected, the screen read Total for November 2026: 7.00 hours, the two other entries. After that entry was corrected and sent again, it read 11.00.
Common Mistakes
| Mistake | What happens | Do this instead |
|---|---|---|
Sum(SharePointList, Column) on a big list | Only the first 500 rows are added, with a delegation warning | Load the rows with a delegable filter, then Sum them |
| Adding up a gallery's AllItems | Only the rows the gallery has loaded | Sum the table the gallery shows |
| A text column in Sum | Text values are ignored | Sum a number column, or convert with Value |
| Showing a Sum without Coalesce | A blank total when there are no rows to add | Coalesce(Sum(...), 0) |
Troubleshooting
| Symptom | Likely cause | Fix |
|---|---|---|
| A delegation warning on Sum | The table is a SharePoint list | Sum a filtered copy held in a variable |
| The total is lower than expected | The filter leaves out rows it shouldn't | Check the condition, such as the exact choice text |
| 7.5 instead of 7.50 | No number format | Text(total, "0.00") |
| No number where the total should be | No rows to add, so Sum is blank | Coalesce(Sum(...), 0) |
FAQ
Is there a SUMIF in Power Apps?
Sum with Filter does the same: Sum(Filter(Table, condition), Column).
How does Excel do this?
SUM adds a range, and SUMIFS adds the rows that match: How to Add Up a Row or Column with SUM in Excel and How to Total Hours by Person and Month in Excel with SUMIFS.
Conclusion
Sum(Table, Column) adds a column; Sum(Filter(Table, condition), Column) adds the rows that match. For SharePoint, sum the rows after loading them with a filter SharePoint can run, and wrap the Sum in Coalesce(…, 0) when there may be nothing to add.
Additional Resources
- Average, Max, Min, StdevP, Sum, and VarP functions: syntax and delegation.
- Delegation overview: aggregate functions and in-memory tables.
