How to Add a Total Row to an Excel Table

An Excel table can total itself. Tick Total Row on the Table Design tab and a Total row appears under the data, with a drop-down in each of its cells that picks Sum, Average, Count and more, no formula typing needed.
The example is a small table of fruit and quantities: Apple 12, Banana 8 and Cherry 30, in A1:B4 of a sheet in Excel for the web. To make a range a table, see How to Format Data as a Table in Excel.
Step 1: Tick Total Row
Select any cell in the table. The Table Design tab appears on the ribbon. On it, tick Total Row:

Step 2: Check the Total
A Total row appears under the last row of data. Here it's row 5, and B5 already holds the sum of the Quantity column, 50:
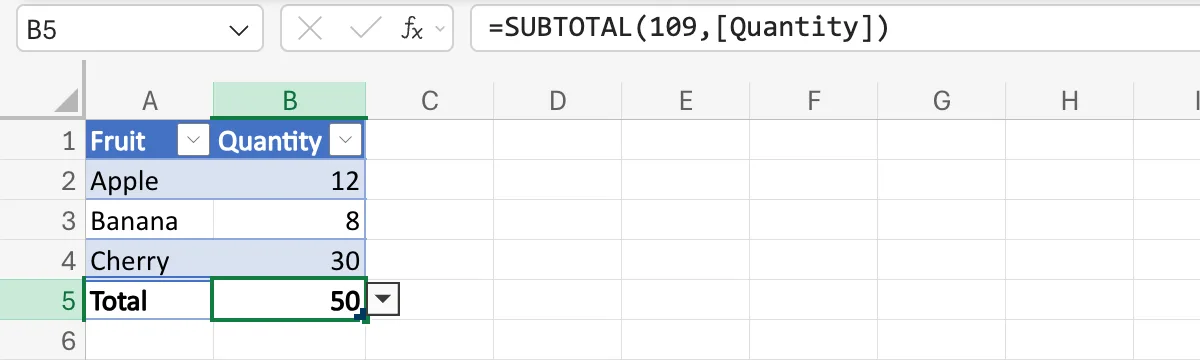
The formula bar shows what Excel wrote: =SUBTOTAL(109,[Quantity]). SUBTOTAL with 109 means sum, leaving out hidden rows, and [Quantity] is the table's Quantity column (How to Use Structured References in an Excel Table). The codes are in How to Total Only Visible Rows in Excel with SUBTOTAL.
Microsoft's Total the data in an Excel table says When you apply a total row for the first time, the cells will be empty. In my table, Excel for the web filled in the sum of the number column straight away. Either way, the next step chooses what each cell shows.
Step 3: Choose a Different Function
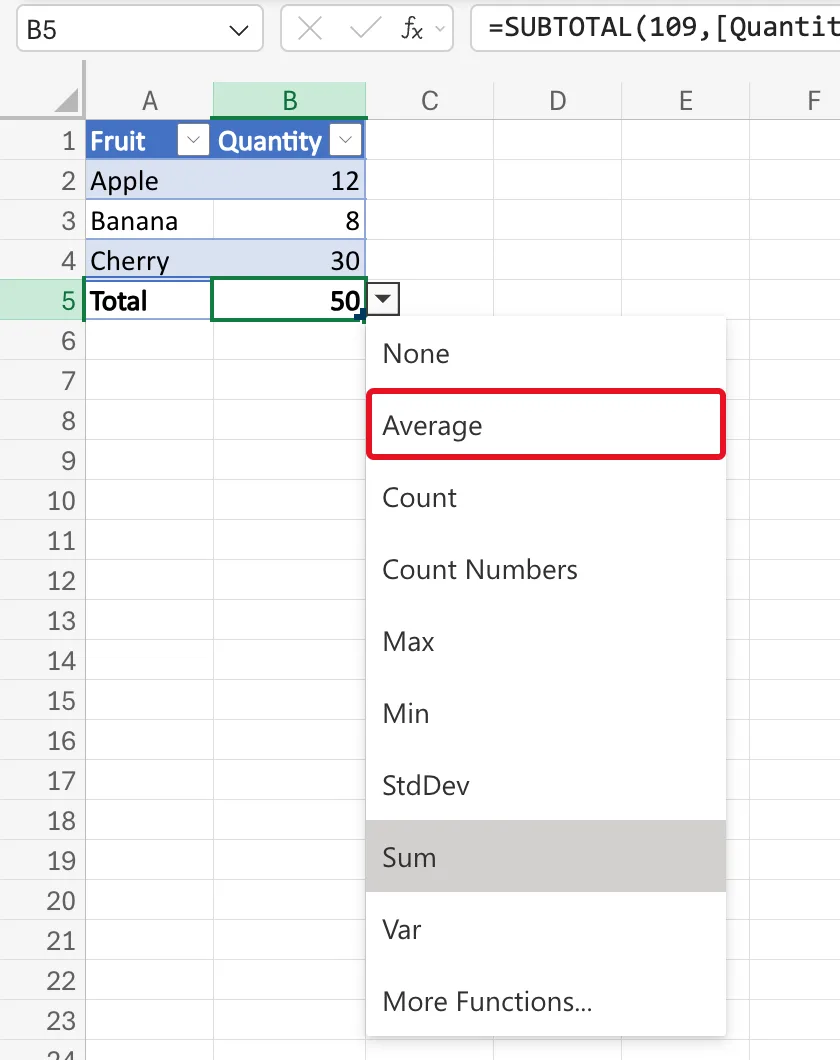
Select the total cell, here B5, and the drop-down arrow next to it. The list has None, Average, Count, Count Numbers, Max, Min, StdDev, Sum, Var and More Functions.... I picked Average:
B5 now shows the average, 16.6666667, and the formula bar shows =SUBTOTAL(101,B2:B4). 101 is average, leaving out hidden rows:
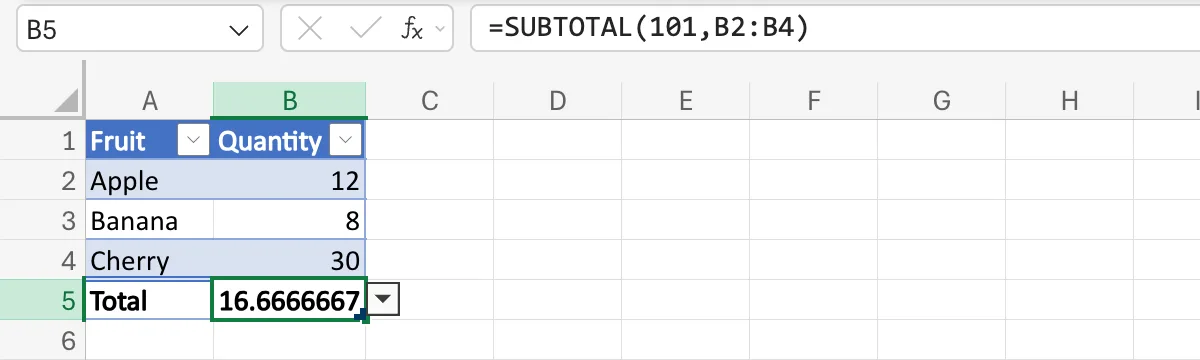
Two things I noticed here:
- Count isn't a sum. Count counts the cells that aren't empty; it doesn't add them up. When a total shows how many rows there are instead of their total, Count is the reason (Fixed: Excel Table Total Row Counts Instead of Adding).
- The drop-down wrote cells, not the column name. Microsoft's article shows the drop-down writing
=SUBTOTAL(109,[Midwest]), with the column's name. Excel for the web wroteB2:B4. The next step checks that the total still keeps up when the table grows.
Step 4: Add a Row Above the Total
The total row always stays at the bottom of the table. To add a row of data, select a cell in the Total row, then on the Home tab select the arrow under Insert and Insert Table Rows Above. I typed Date and 6 into the new row 5:
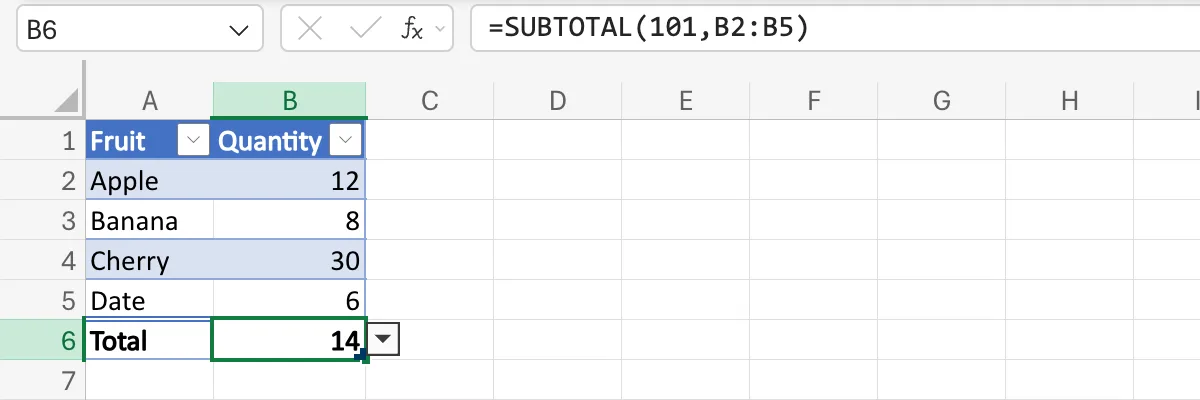
The total moved to row 6 and its range grew to B2:B5 by itself, so the average of 12, 8, 30 and 6 is 14.
Common Mistakes
| Mistake | What happens | Do this instead |
|---|---|---|
| Picking Count for a column of numbers | The cell shows how many values there are, not their total | Pick Sum |
| Copying a total formula and pasting it in the next total cell | Microsoft's article says the column references don't change, so the result is wrong | Drag it across with the fill handle, or pick the function from the cell's own drop-down |
| Expecting a hidden row to count in the total | The drop-down's codes, 101 to 111, leave out rows hidden with Hide Row | Unhide the row, or type a SUBTOTAL with a code from 1 to 11 |
Troubleshooting
| Symptom | Likely cause | Fix |
|---|---|---|
| Table Design isn't on the ribbon | The selected cell is outside the table | Select a cell inside the table |
| The total is a count of the rows | Count was picked | Pick Sum (Fixed: Excel Table Total Row Counts Instead of Adding) |
| The total doesn't drop after hiding a row in Excel for the web | The formula wasn't recalculated | Fixed: SUBTOTAL 109 Still Includes a Hidden Row in Excel for the Web |
| Filtered-out rows aren't in the total | SUBTOTAL always leaves out rows a filter hides | Clear the filter to total every row |
FAQ
Can I turn the total row off again?
Yes: clear Total Row on Table Design. Microsoft's article says that if you turn it back on later, Excel remembers the formulas you chose.
Can I use my own formula in a total cell?
Yes. Pick More Functions... in the drop-down, or type any formula into the cell.
Can other columns have totals too?
Yes. Every cell in the total row has its own drop-down, so the first column can stay as the word Total while each number column gets its own function.
Conclusion
Select a cell in the table, then Table Design → Total Row. Each total cell's drop-down picks the function, written as a SUBTOTAL that leaves out hidden and filtered rows, and the total stays at the bottom as rows are added above it.
