How to Add a Table to a Power BI Report

Cards and charts summarise; a table shows the rows behind them. The table visual lists the columns you tick, one row per combination of values, with a total at the bottom. Here's how to add one.
Microsoft's Create and format table visualizations covers the table visual and its formatting. The example lists the claims of an Expenses table: Expense, Amount, Category and ExpenseDate.
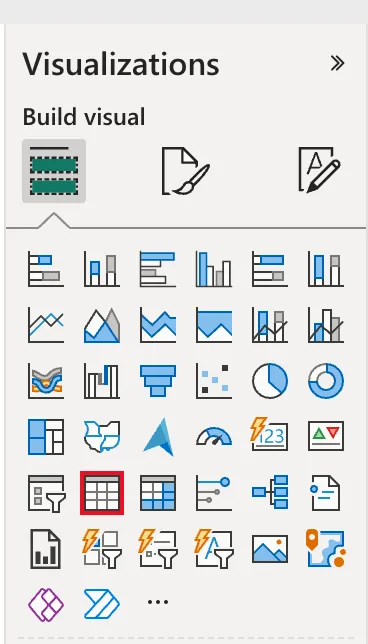
Step 1: Select the Table Icon
In the report, in Editing mode, click an empty part of the page so nothing is selected, then select the Table icon in the Visualizations pane:
Step 2: Tick the Columns
In the Data pane, tick the columns in the order you want them, here Expense, Amount, Category and ExpenseDate. They go into the Columns well:
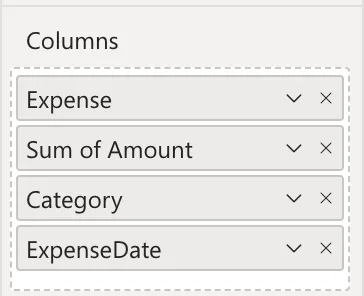
Amount became Sum of Amount: Power BI adds up number columns. In the example, ExpenseDate first came in as Year, Quarter, Month and Day, and had to be switched back to the date itself (Fixed: Power BI Table Shows Year, Quarter, Month and Day Instead of the Date).
Step 3: Check the Table
The table lists the five claims with a Total row at the bottom:
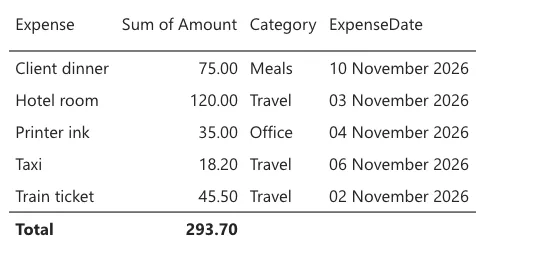
The header Sum of Amount can say just Amount (How to Rename a Field in One Power BI Visual).
A table shows one row per combination of values. Two claims with the same description, amount, category and date would show as one row with their amounts added up; add a column that tells them apart if each must show.
Common Mistakes
| Mistake | What happens | Do this instead |
|---|---|---|
| Ticking the columns with another visual selected | The columns go into that visual | Click an empty part of the page first |
| Expecting every row to show | Identical rows are grouped | Add a distinguishing column |
| Leaving the date as a hierarchy | Year, quarter, month and day columns | Choose the date itself in the well's menu |
Troubleshooting
| Symptom | Likely cause | Fix |
|---|---|---|
| Sum of in a header | A number column is summed | Rename it for the visual |
| Year, Quarter, Month and Day columns | The date came in as its hierarchy | Choose the date in the well's menu |
| A scrollbar | More rows than the visual's height | Make it taller, or let it scroll |
FAQ
Can I sort the table?
Yes: select a column header to sort by it.
Can a table show a measure?
Yes: tick the measure like a column. It's worked out for each row and for the total.
Conclusion
Select the Table icon and tick the columns in order. Power BI sums number columns and adds a total; the example listed five claims with a total of 293.70.
