How to Add a Custom Plot to an MLflow Evaluation

mlflow.models.evaluate draws a fixed set of plots, and none at all for a regressor without SHAP. A custom artifact adds your own: a function that receives the evaluation's predictions and true values, draws something, and hands MLflow the file, which it logs to the run with the rest. This guide adds a predicted-versus-actual plot to a regression model's evaluation, with real output from MLflow 3.18.0.
Syntax
def artifact_function(eval_df, builtin_metrics, artifacts_dir):
    # draw from eval_df["prediction"] and eval_df["target"], save into artifacts_dir
    return {"artifact_name": path}


result = mlflow.models.evaluate(..., custom_artifacts=[artifact_function])
| Part | What it means |
|---|---|
eval_df | A DataFrame with a prediction column and a target column, one row per evaluated row |
builtin_metrics | The metrics MLflow computed, by name |
artifacts_dir | A temporary folder to save files in; MLflow deletes it after logging them |
| the returned dictionary | Each artifact's name, and its file's path or the object itself |
custom_artifacts | A list of these functions |
The reference for mlflow.models.evaluate lists what the dictionary can hold, including "A string uri representing the file path to the artifact" and a "Matplotlib Figure. This will be saved as an image artifact."
Prerequisites
- An MLflow tracking server at
http://127.0.0.1:8080. MLflow's tracking server guide shows how to start one. mlflowandscikit-learnin your project, for example withuv add mlflow scikit-learn pandas. Matplotlib comes withmlflow.
Step 1: Write the Plot Function and Evaluate
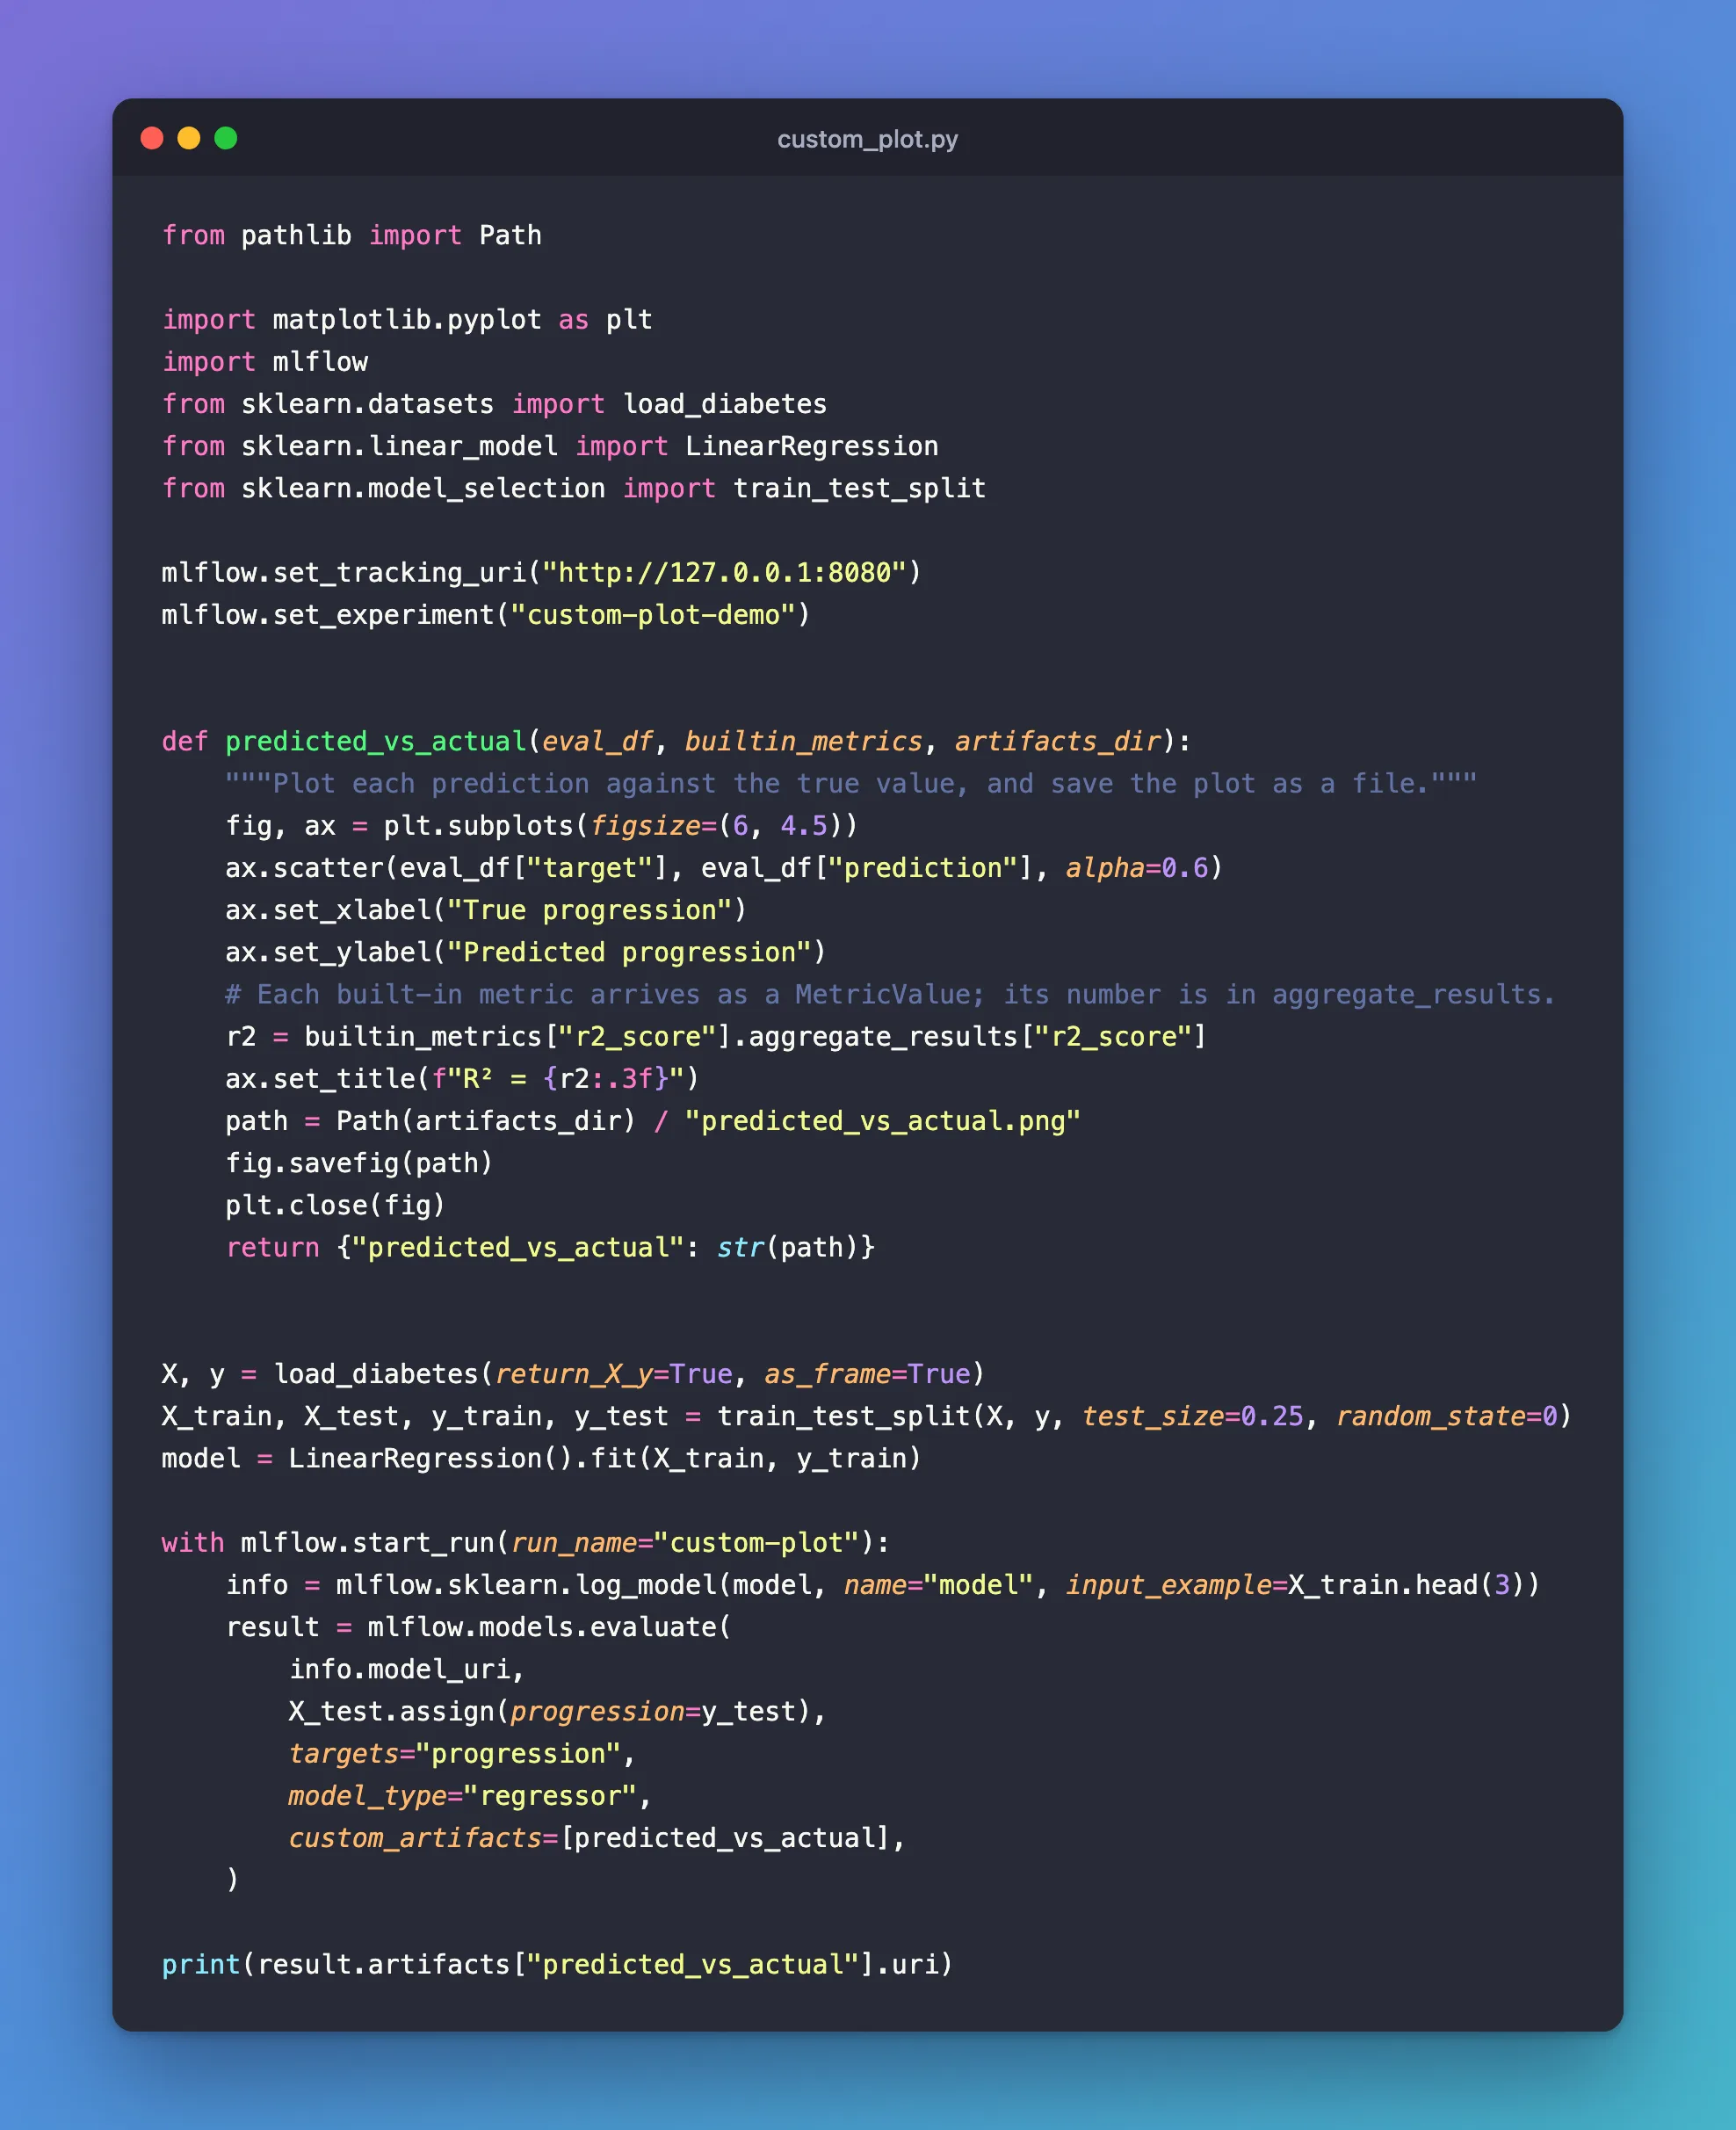
The model predicts how far each patient's diabetes progressed after a year, from scikit-learn's diabetes data. The function plots each prediction against the true value and puts the model's R² in the title:
from pathlib import Path

import matplotlib.pyplot as plt
import mlflow
from sklearn.datasets import load_diabetes
from sklearn.linear_model import LinearRegression
from sklearn.model_selection import train_test_split

mlflow.set_tracking_uri("http://127.0.0.1:8080")
mlflow.set_experiment("custom-plot-demo")


def predicted_vs_actual(eval_df, builtin_metrics, artifacts_dir):
    """Plot each prediction against the true value, and save the plot as a file."""
    fig, ax = plt.subplots(figsize=(6, 4.5))
    ax.scatter(eval_df["target"], eval_df["prediction"], alpha=0.6)
    ax.set_xlabel("True progression")
    ax.set_ylabel("Predicted progression")
    # Each built-in metric arrives as a MetricValue; its number is in aggregate_results.
    r2 = builtin_metrics["r2_score"].aggregate_results["r2_score"]
    ax.set_title(f"R² = {r2:.3f}")
    path = Path(artifacts_dir) / "predicted_vs_actual.png"
    fig.savefig(path)
    plt.close(fig)
    return {"predicted_vs_actual": str(path)}


X, y = load_diabetes(return_X_y=True, as_frame=True)
X_train, X_test, y_train, y_test = train_test_split(X, y, test_size=0.25, random_state=0)
model = LinearRegression().fit(X_train, y_train)

with mlflow.start_run(run_name="custom-plot"):
    info = mlflow.sklearn.log_model(model, name="model", input_example=X_train.head(3))
    result = mlflow.models.evaluate(
        info.model_uri,
        X_test.assign(progression=y_test),
        targets="progression",
        model_type="regressor",
        custom_artifacts=[predicted_vs_actual],
    )

print(result.artifacts["predicted_vs_actual"].uri)
builtin_metrics["r2_score"].aggregate_results["r2_score"]: each built-in metric is aMetricValueobject with its number inside, not the number itself. Formatting the object directly fails: Fixed: unsupported format string passed to MetricValue.format.plt.close(fig)frees the figure once it's saved.result.artifacts["predicted_vs_actual"]: the plot is in the results under the name the function returned.
uv run python custom_plot.py
2026/11/21 18:02:06 INFO mlflow.models.evaluation.default_evaluator: Testing metrics on first row...
2026/11/21 18:02:07 WARNING mlflow.models.evaluation.evaluators.shap: SHAP or matplotlib package is not installed, so model explainability insights will not be logged.
🏃 View run custom-plot at: http://127.0.0.1:8080/#/experiments/9/runs/3870113fcce84e8fa570151e9222802f
🧪 View experiment at: http://127.0.0.1:8080/#/experiments/9
mlflow-artifacts:/9/3870113fcce84e8fa570151e9222802f/artifacts/predicted_vs_actual.png
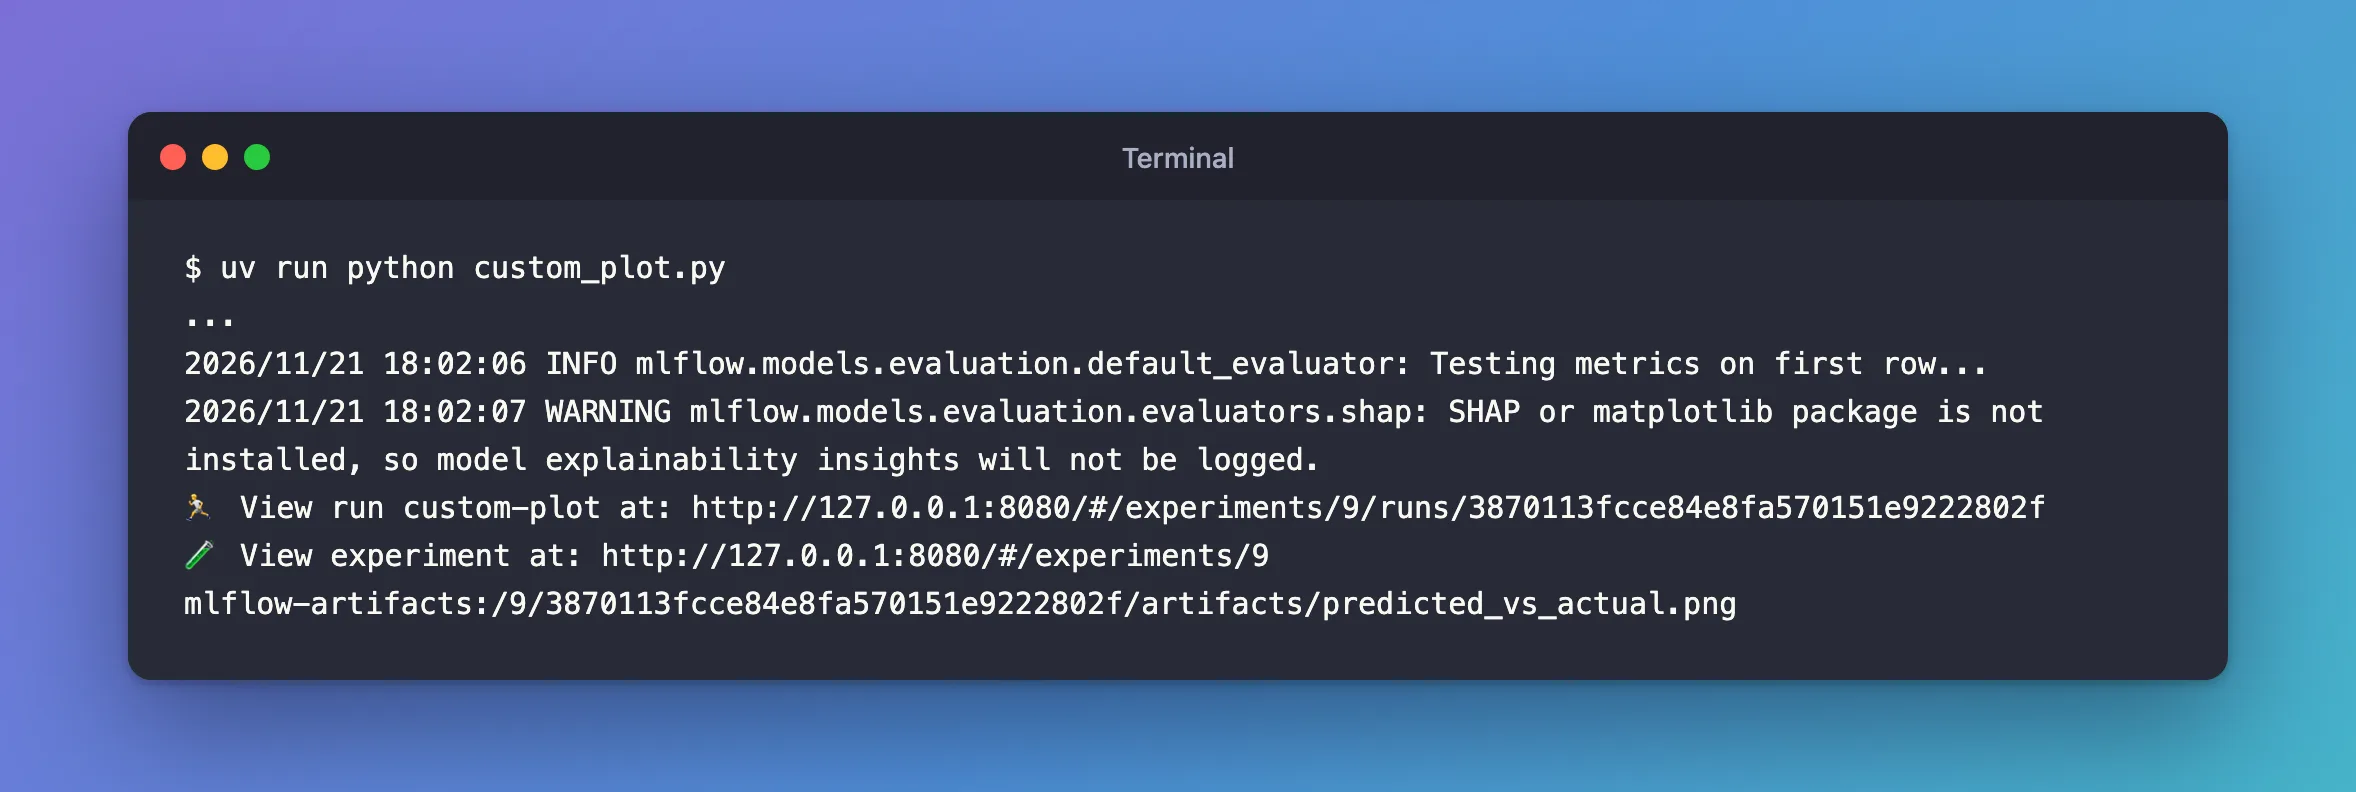
The plot is one of the run's artifacts. The SHAP warning is about optional explanations: Fixed: SHAP or matplotlib package is not installed.
Step 2: See the Plot on the Run
Open the run, custom-plot, go to Artifacts and click predicted_vs_actual.png:
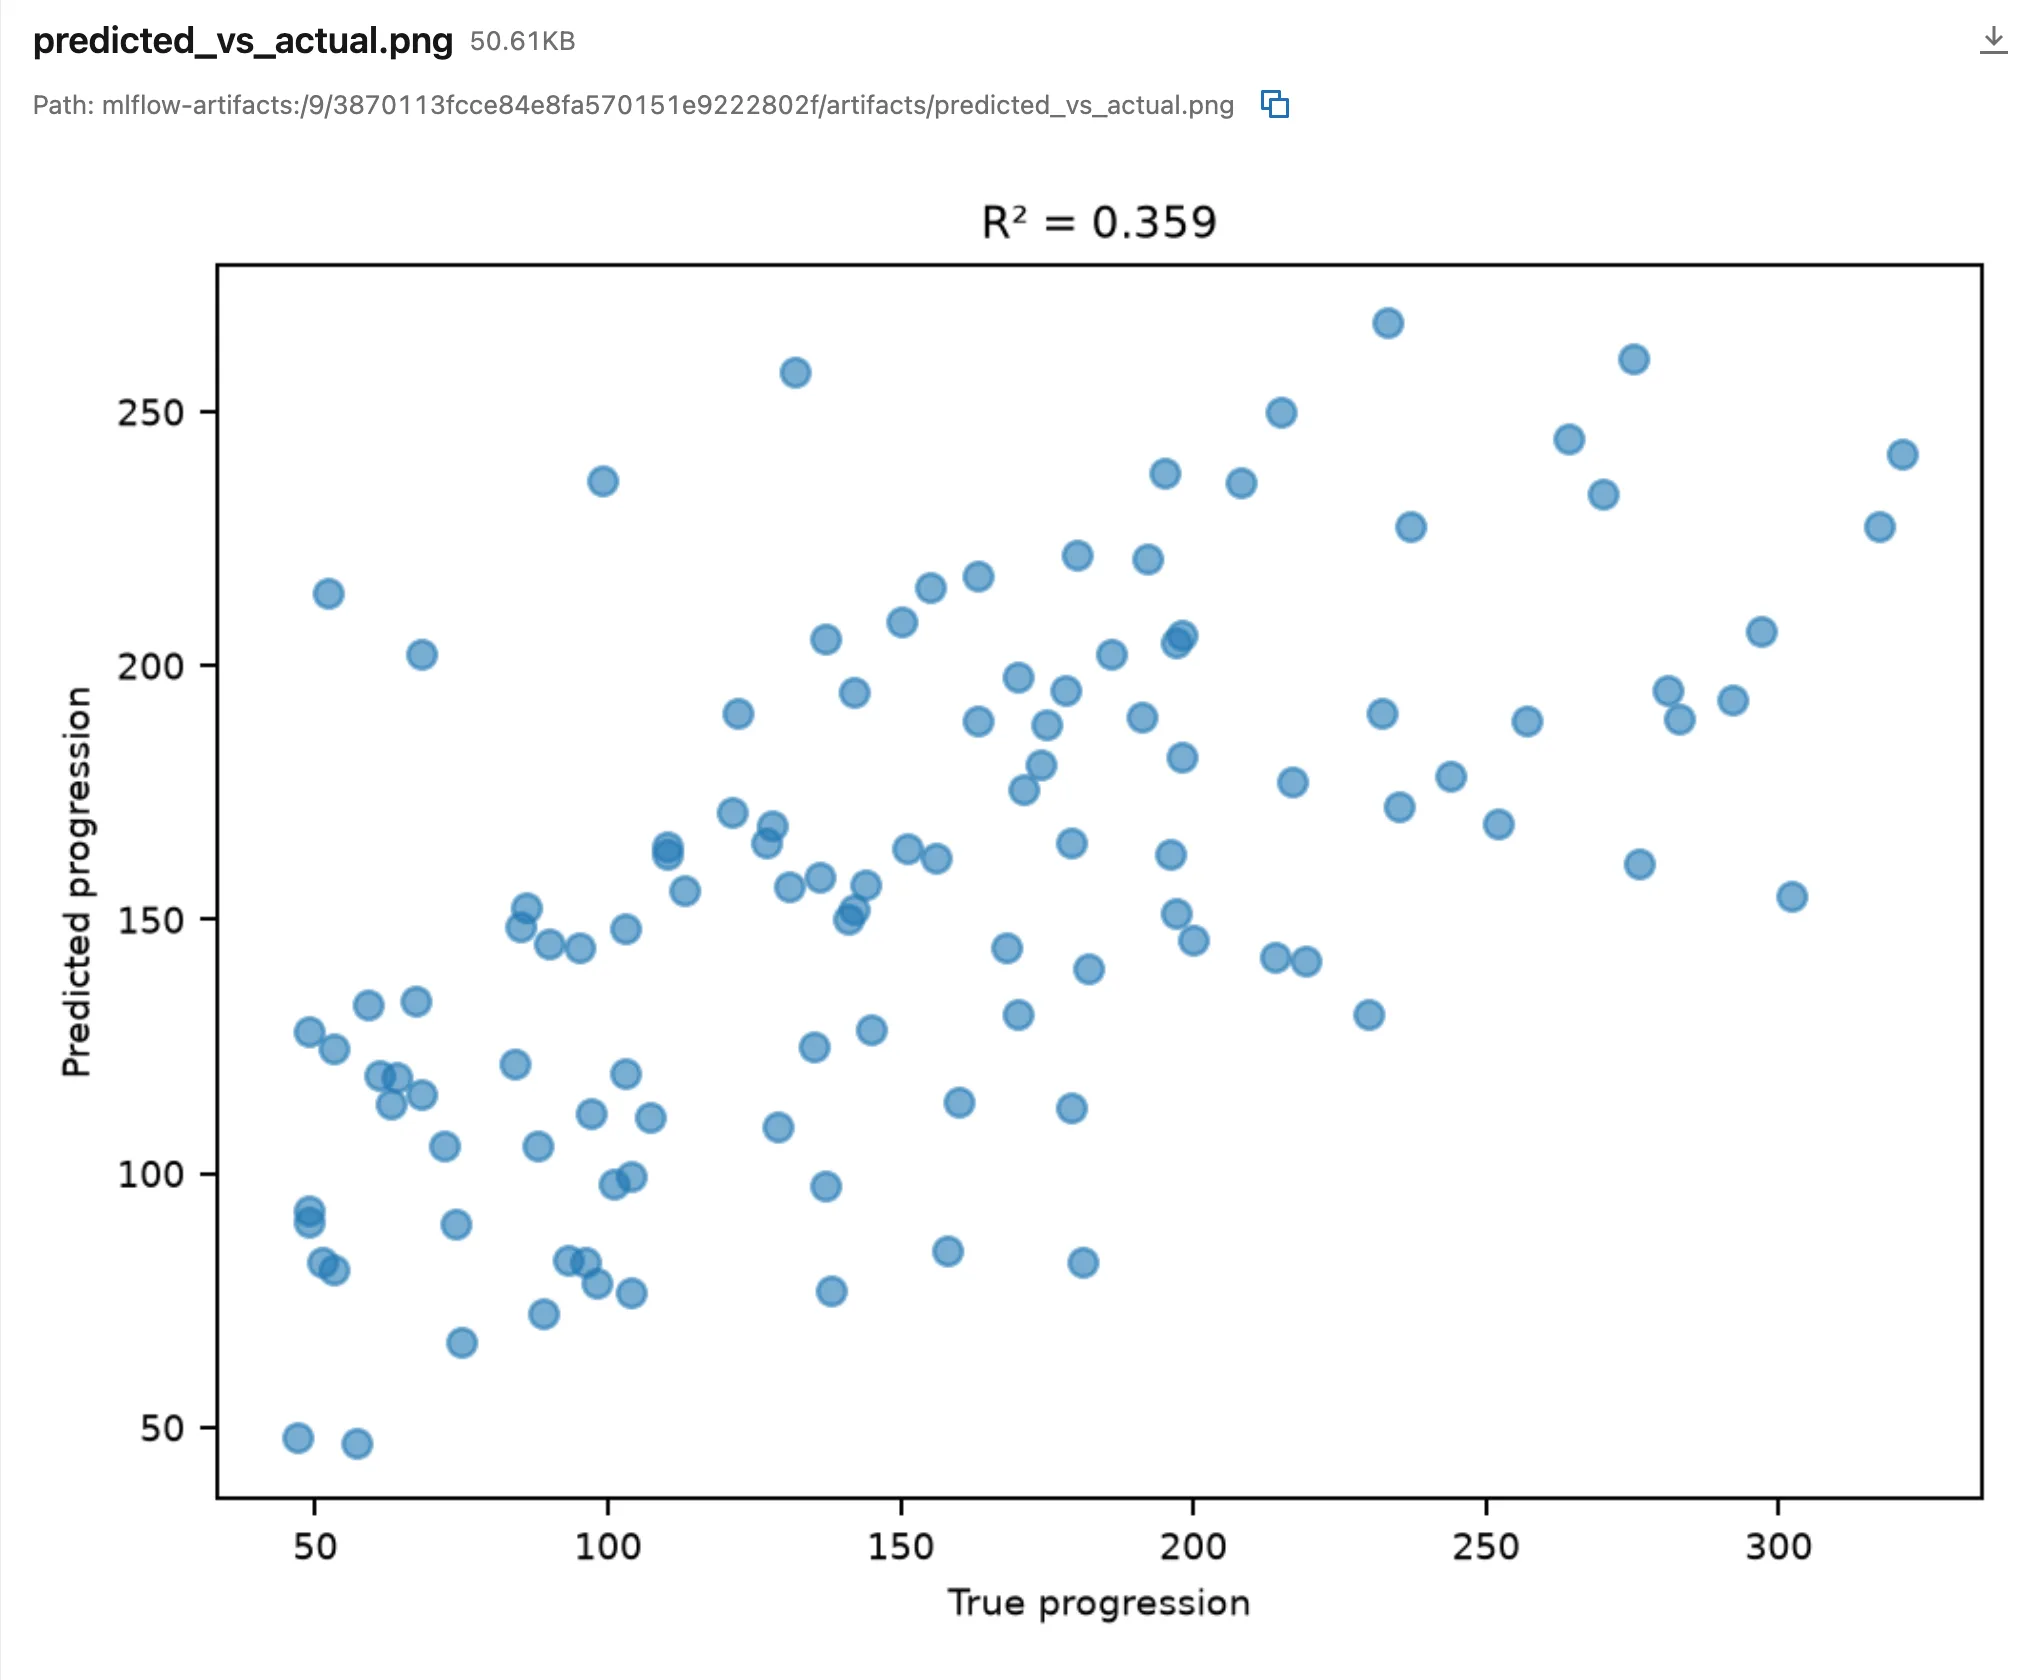
The points rise from left to right but spread widely, which is what an R² of 0.359 looks like: the model gets the trend and misses the details.
Common Mistakes
| Mistake | What happens | Do this instead |
|---|---|---|
f"{builtin_metrics['r2_score']:.3f}" | TypeError: unsupported format string passed to MetricValue.__format__ | Read .aggregate_results["r2_score"] |
Saving the plot outside artifacts_dir | Files pile up in your project | Save into artifacts_dir, which MLflow cleans up |
Troubleshooting
| Symptom | Likely cause | Fix |
|---|---|---|
The run ends FAILED, with no metrics and no files | The artifact function raised, before MLflow logged anything | Read the traceback; MLflow builds custom artifacts before it logs the metrics |
TypeError: unsupported format string passed to MetricValue.__format__ | A built-in metric formatted as a number | Fixed: unsupported format string passed to MetricValue.format |
FAQ
Can I return the figure instead of a path?
The reference says a Matplotlib figure "will be saved as an image artifact", with savefig's default settings. Saving it yourself lets you choose the size and format.
Can one function log several artifacts?
Yes: return several names in the dictionary.
Conclusion
A function that draws from eval_df, saves into artifacts_dir and returns the path added a predicted-versus-actual plot to the evaluation, titled with the R² from builtin_metrics, and MLflow logged it to the run with its own name.
Additional Resources
- mlflow.models.evaluate — the
custom_artifactsparameter. - MLflow model evaluation — custom visualizations in the guide.
