How to Add a Column Chart in Power Apps

A column chart shows totals side by side, so readers see at a glance which is bigger. Power Apps has a Column chart control: give it a table with a label column and a number column, and each row becomes a column. This guide adds one to a responsive screen, step by step.
The example is the Reports screen of the Overtime Timesheet app: one column per department, with its approved overtime hours for the month.
How the Chart Works
From Microsoft's Column chart and Line chart reference:
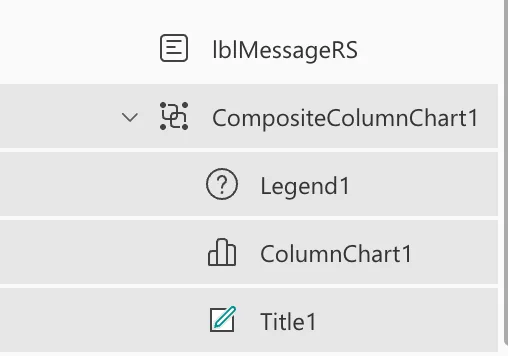
- It's three controls. Inserting a column chart adds a group of three: a Label for the title, the chart graphic, and a Legend.
- Items is the data: a table whose first column labels the columns, and whose next columns are the numbers.
- NumberOfSeries says how many number columns to draw. One, here.
Step 1: Make Room in a Plain Container
Microsoft's responsive apps guide lists a known issue: the Data table, Charts, and Add Picture controls are currently not supported in the layout containers. The plain Container control isn't a layout container, and the Container reference doesn't list charts among the controls it can't hold.
So, inside the screen's vertical container, insert a Container (from Insert, search for Container; How to Add a Container Control in Power Apps). I named it conChartRS and set:
| Property | Value | Why |
|---|---|---|
| Width | Min(640, Parent.Width - 48) | The screen's other controls' width |
| Align in container | Start | Keeps that width |
| Flexible height | Off (FillPortions 0) | Otherwise the container ignores its Height |
| Height | 360 | Room for the title, chart and legend |
| Drop shadow | None |
A new Container started with Flexible height on, which made it ignore its Height until I turned that off.
Step 2: Insert a Column Chart
Open Insert and search for Column chart:
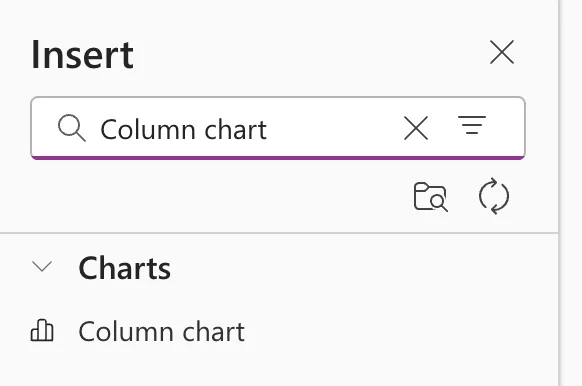
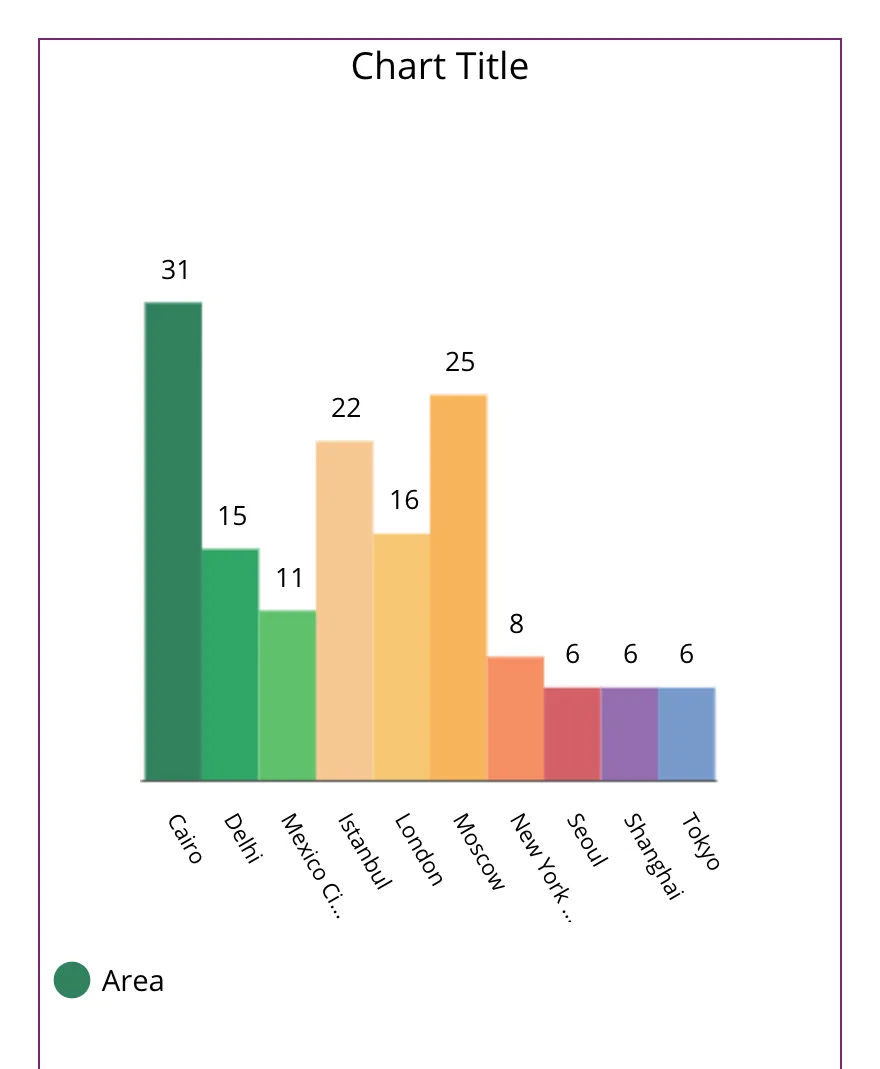
Select it. Studio adds a group with sample data: cities, values, a Chart Title and an Area legend:
The tree shows the group and its three controls, Legend1, ColumnChart1 and Title1:
I'd had the vertical container selected, so the group went into it. I cut the group in the tree view and pasted it onto conChartRS, which put it inside the plain container (How to Copy and Paste Controls Between Screens in Power Apps).
Step 3: Ungroup and Rename the Controls
Right-click the group in the tree and select Ungroup: the container already keeps the three together. Rename them (How to Rename a Screen or Control in Power Apps):
| Was | Now |
|---|---|
| Title1 | lblChartTitleRS |
| ColumnChart1 | chtDepartmentsRS |
| Legend1 | lgdDepartmentsRS |
Step 4: Give the Chart Its Data
Set the chart's Items to a table with the label column first and the number column second. Here, one row per department with its total hours, from the screen's table of entries, locRowsRS, which has a Department and an Hours column:
If(
    IsBlank(locRowsRS),
    Blank(),
    Sort(
        ShowColumns(
            AddColumns(GroupBy(locRowsRS, Department, Rows), Hours, Sum(Rows, Hours)),
            Department,
            Hours
        ),
        Department
    )
)
- GroupBy makes one row per department, with its entries in Rows, and AddColumns adds each department's Hours with Sum (How to Total Each Group in Power Apps with GroupBy and Sum).
- ShowColumns keeps only Department and Hours, so the chart gets a label and one number per row (How to Keep Only Some Columns of a Table in Power Apps with ShowColumns).
- Sort puts the departments in alphabetical order.
- The
IsBlankcheck keeps GroupBy from running before the table is loaded (Fixed: "The First Argument to the GroupBy Function Cannot Be Blank" in Power Apps).
NumberOfSeries stays at 1. The legend's Items is chtDepartmentsRS.SeriesLabels, so it names the number column: Hours.
Step 5: Place the Three Controls
Inside a plain container, controls are placed with X, Y, Width and Height, here from the container's size so they follow it:
| Control | X | Y | Width | Height |
|---|---|---|---|---|
lblChartTitleRS | 0 | 0 | Parent.Width | 32 |
chtDepartmentsRS | 0 | 40 | Parent.Width | Parent.Height - 80 |
lgdDepartmentsRS | 0 | Parent.Height - 40 | Parent.Width | 40 |
The title's Text is "Approved hours by department", with Size 16, FontWeight FontWeight.Semibold and Align Align.Left. The three classic controls started with a different font from the app's modern controls, so I set their Font to Font.'Segoe UI'.
Step 6: Make It Readable and Accessible
Microsoft's accessibility guidelines for charts:
- A title right before the chart. Screen readers read controls from top to bottom, and inside a container they read the container's controls together (Organize controls in accessible canvas apps), so the title at Y
0comes first. - Markers
true, so each column shows its value. It was already on. - GridStyle
GridStyle.All, so both axes show their scale. It wasGridStyle.XOnly. - TabIndex
0or more, so keyboard users can reach it. It was already0.
Two more settings came from testing:
- SeriesAxisMin
0: without it, the axis started just under the smallest value (Fixed: Column Chart Y-Axis Doesn't Start at Zero in Power Apps). - AccessibleLabel: the App checker listed the chart as Missing accessible label until it had one (Fixed: "Missing Accessible Label" in the Power Apps App Checker):
$"Approved overtime hours by department in {Text(locMonthRS, "mmmm yyyy")}"
Screen reader users get the chart's data as a table, which the reference describes and which held the full department names.
The Result
For a payroll user in November, the chart showed both departments, from zero:
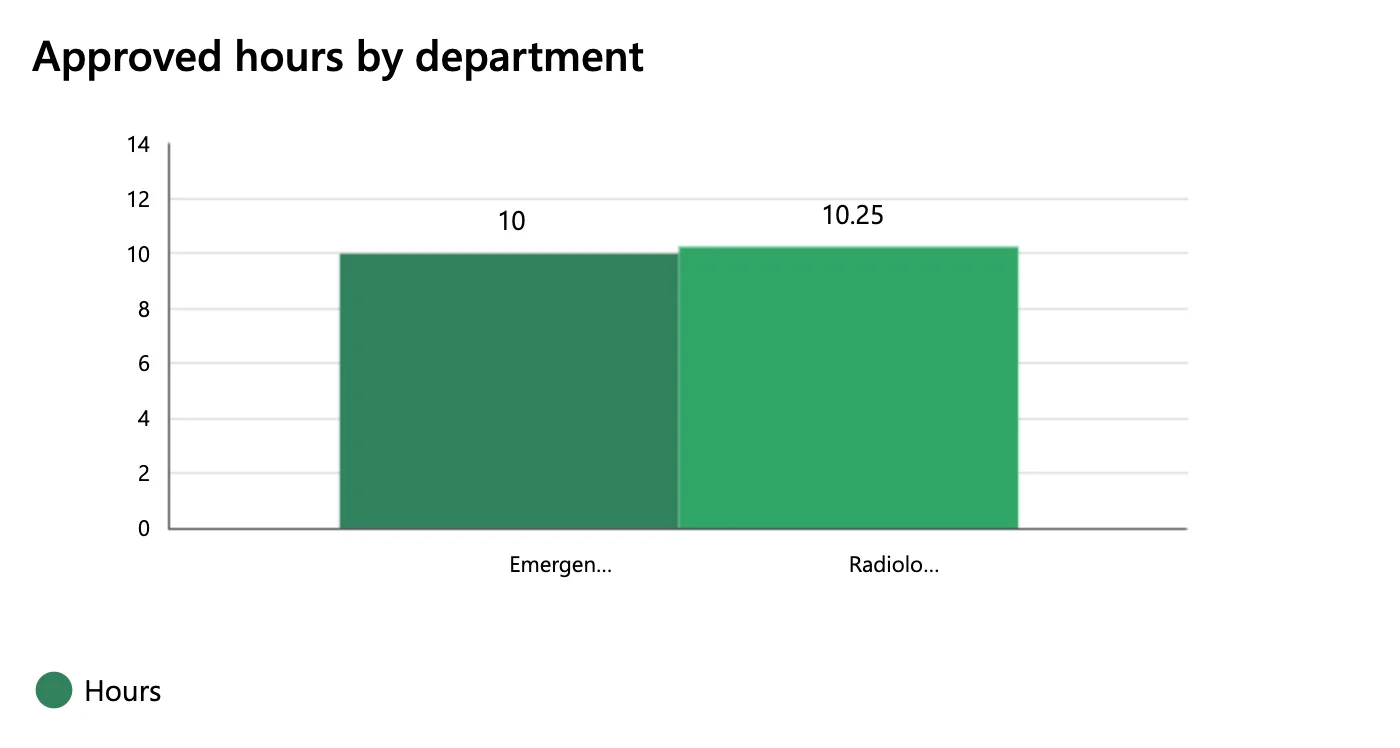
The chart shortened the department names under the columns, and nothing in its reference changes that. The app lists each full name and total under the chart (Fixed: Column Chart Cuts Off Labels with an Ellipsis in Power Apps).
Common Mistakes
| Mistake | What happens | Do this instead |
|---|---|---|
| Leaving the chart in a vertical or horizontal container | Microsoft lists charts as not supported in layout containers | A plain Container around the chart |
| Leaving Items as the sample | The sample cities stay on the screen | Your own table, label column first |
| Forgetting SeriesAxisMin | Small differences look large | 0 for amounts that can't be negative |
Troubleshooting
| Symptom | Likely cause | Fix |
|---|---|---|
| The container ignores its Height | Flexible height is on | Turn it off |
| The labels end in … | The chart shortens category labels | Show the full names elsewhere (fix) |
| Missing accessible label in the App checker | No AccessibleLabel | Describe what the chart shows |
| An error about GroupBy before the data loads | GroupBy on a blank table | Guard Items with IsBlank |
FAQ
How do I chart two numbers per row?
Add the second number column to Items after the first, set NumberOfSeries to 2, and keep the legend: the guidelines require one when more than one series is shown.
Is there a horizontal bar chart?
Not as a separate classic control: the classic charts are the column chart, the line chart and the pie chart. Microsoft's Show data in a line, pie, or bar chart builds its bar chart with the Column chart.
Do I need the legend for one series?
The guidelines require it only for more than one series. I kept it: it says the columns are Hours.
Conclusion
Insert a Column chart, give its Items a table with a label column first and a number column next, and set GridStyle, Markers, SeriesAxisMin and an accessible label. On a responsive screen, put it in a plain Container inside the layout containers.
Additional Resources
- Column chart and Line chart controls in Power Apps
- Building responsive canvas apps: known issues
- Container control
- Show data in a line, pie, or bar chart in canvas apps
