How to Add a Card to a Power BI Report

A card shows one number in large type: a total, a count, a person's name. It's the first thing people read on a report. The card visual can also show several numbers side by side. Here's how to add one.
Microsoft's Create a card visual in Power BI says that selecting the Card icon creates the new card visual, which replaces both legacy visuals and is recommended for new reports. The example shows three measures of a model of expense claims: Total amount, Expense count and People (How to Add Up a Column in Power BI with SUM).
Step 1: Select the Card Icon
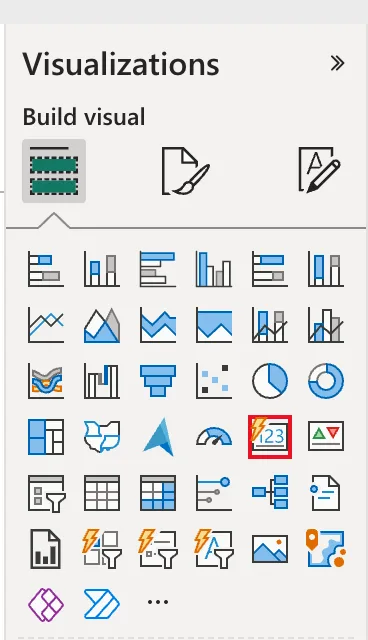
In the report, in Editing mode, select the Card icon in the Visualizations pane, the one with 123:
An empty card appears on the page.
Step 2: Tick a Measure
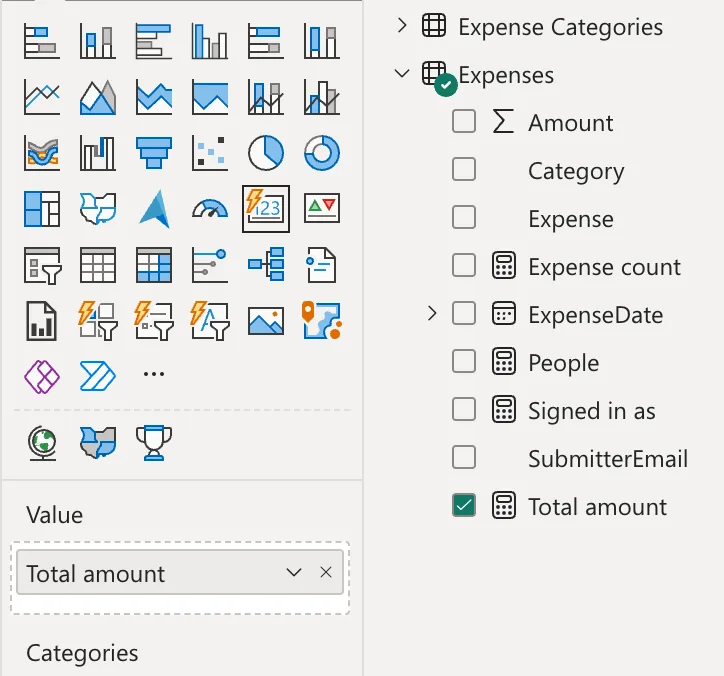
In the Data pane, expand the table and tick the measure, here Total amount. It goes into the card's Value well:
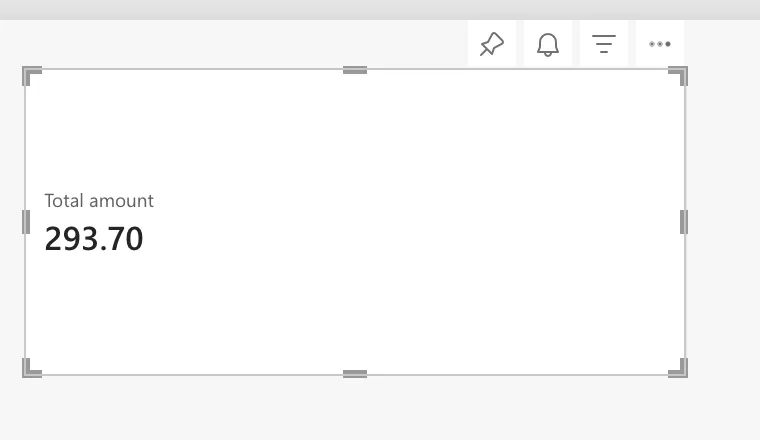
The card shows the measure's name and value, 293.70:
Step 3: Add More Values
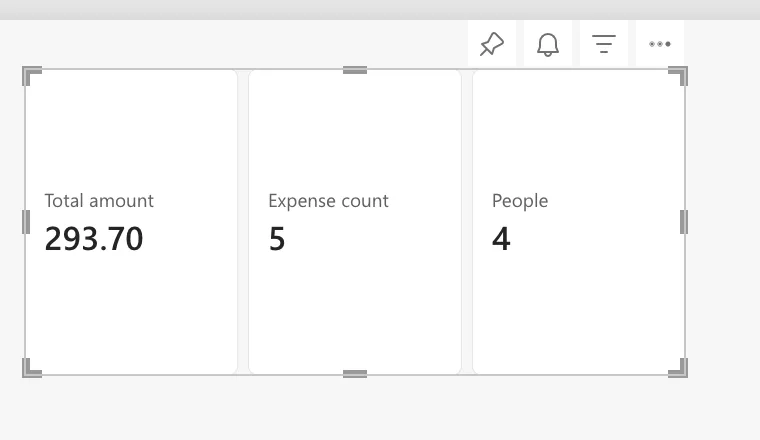
With the card still selected, tick Expense count and People too. They join Value, and the card splits into three tiles, one per measure:
Resize the card from its corners, or set its exact size (How to Set the Exact Size and Position of a Visual in Power BI).
Common Mistakes
| Mistake | What happens | Do this instead |
|---|---|---|
| Ticking a measure with no visual selected | Power BI makes a new visual for it | Select the card first |
| Putting a text column on a card | The card shows the first or a counted value | Use a measure |
| Leaving the default format | Amounts show a different number of decimals | Format the measure (How to Show a Measure with Two Decimal Places in Power BI) |
Troubleshooting
| Symptom | Likely cause | Fix |
|---|---|---|
| The card shows (Blank) | The filters leave no rows | Check the slicers and filters |
| The value is too small to read | The card is small | Make the card bigger |
| A second card appeared | No card was selected when ticking | Delete it, select the first card, tick again |
FAQ
Can one card show several numbers?
Yes: the new card visual takes several measures in Value, as in Step 3.
Can a card show text?
Yes: a measure that returns text, such as the signed-in user, shows as text (How to Get the Signed-In User in Power BI with USERPRINCIPALNAME).
Conclusion
Select the Card icon and tick a measure; tick more measures to show them side by side. The example's card shows 293.70, 5 and 4.
