How to Add a Bar Chart to a Power BI Report

A bar chart compares a number across categories: one bar per category, longest first. Horizontal bars leave room for long category names. Here's how to add a clustered bar chart to a Power BI report.
The example charts Total amount, a measure of expense claims, by Category (How to Add Up a Column in Power BI with SUM). Microsoft's Overview of visualizations in Power BI lists the bar and column charts among the visual types.
Step 1: Select the Clustered Bar Chart Icon
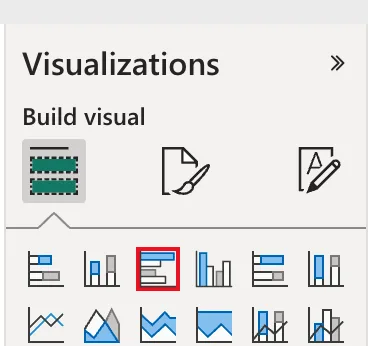
In the report, in Editing mode, click an empty part of the page so nothing is selected, then select Clustered bar chart, the third icon in the first row of the Visualizations pane:
Step 2: Tick the Category and the Measure
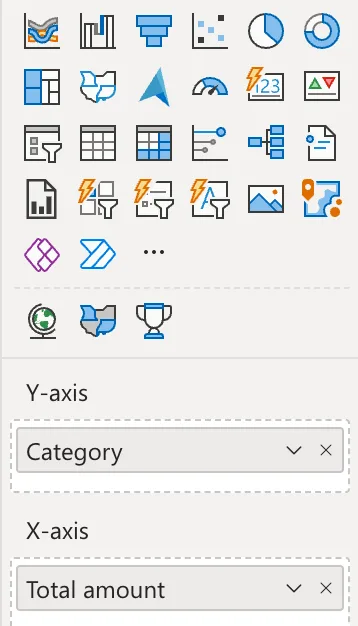
In the Data pane, tick Category, then Total amount. Power BI puts the text column in Y-axis, the bars' labels, and the measure in X-axis, the bars' length:
Step 3: Check the Chart
The chart has a title, Total amount, and a subtitle, by Category, and the bars are sorted from the largest: Travel, Meals, Office:
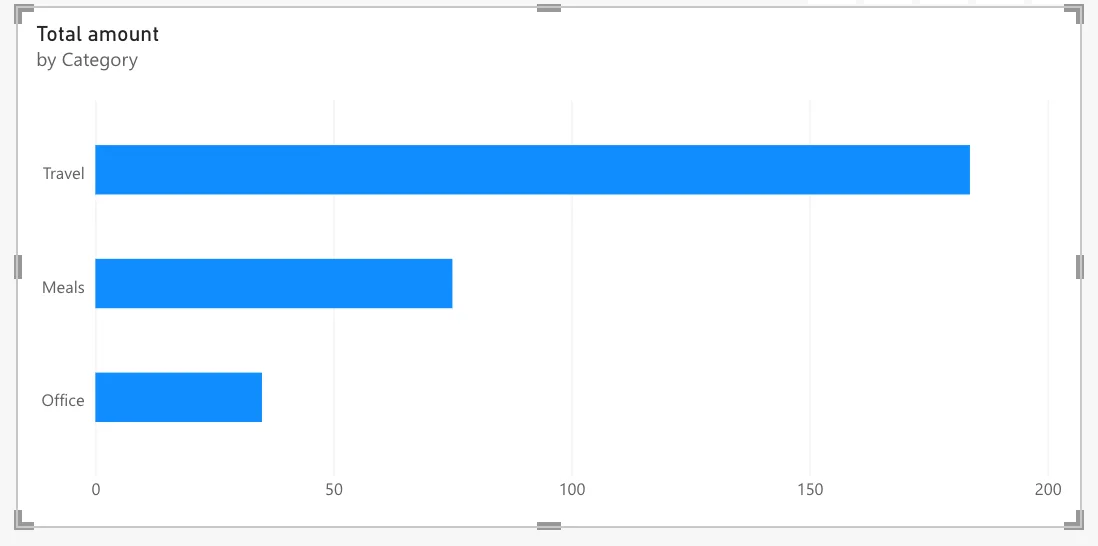
Microsoft's visual defaults article explains the title and subtitle: in the Fluent 2 theme, titles and subtitles are on by default. To show each bar's value on it, turn on data labels (How to Show Data Labels on a Power BI Chart).
Common Mistakes
| Mistake | What happens | Do this instead |
|---|---|---|
| Ticking the fields with another visual selected | The fields go into that visual | Click an empty part of the page first |
| A column chart for long category names | The names are squeezed under the columns | A bar chart, with names on the left |
| Putting a numeric column in X-axis instead of a measure | Power BI sums it, without the measure's name and format | Use the measure |
Troubleshooting
| Symptom | Likely cause | Fix |
|---|---|---|
| One bar for everything | No field in Y-axis | Add the category column |
| The bars are in A to Z order | The chart is sorted by the category | Sort by the measure in the visual's More options (...) |
| A (Blank) bar | Rows with no category | Fill the values at the source |
FAQ
What's the difference between a bar and a column chart?
Bars run across; columns stand up. Microsoft's column chart article covers the vertical version.
Does the chart follow slicers?
Yes. A Category slicer on the page leaves only the selected bars (How to Add a Slicer to a Power BI Report).
Conclusion
Select Clustered bar chart, tick a category and a measure: the category goes to Y-axis, the measure to X-axis, and the bars sort from the largest. The example showed Total amount by Category.
