Fixed: Power BI Table Shows Year, Quarter, Month and Day Instead of the Date

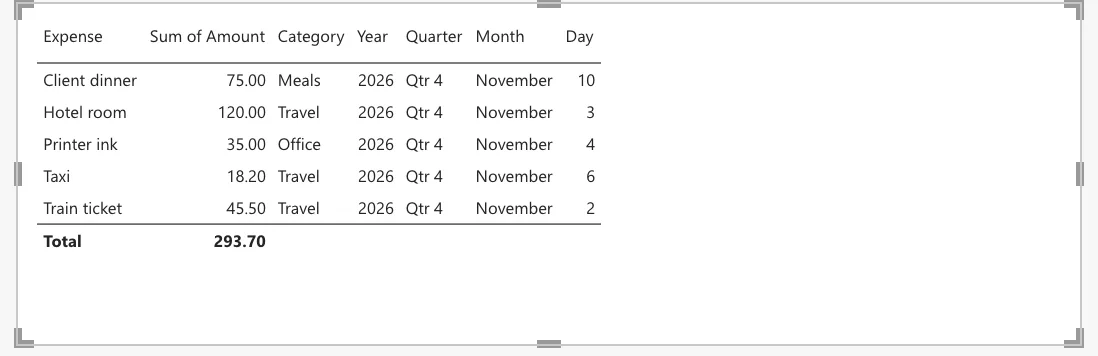
I ticked a date column into a Power BI table and got four columns instead of one: Year, Quarter, Month and Day. Power BI had added the column's automatic date hierarchy. The field's menu in the visual's well switches it to the date itself.
What I Was Doing
I was adding a table visual to a report of expense claims, with the columns Expense, Amount, Category and ExpenseDate (How to Add a Table to a Power BI Report). ExpenseDate is a date column of the Expenses table, typed as Date in Power Query.
What I Expected
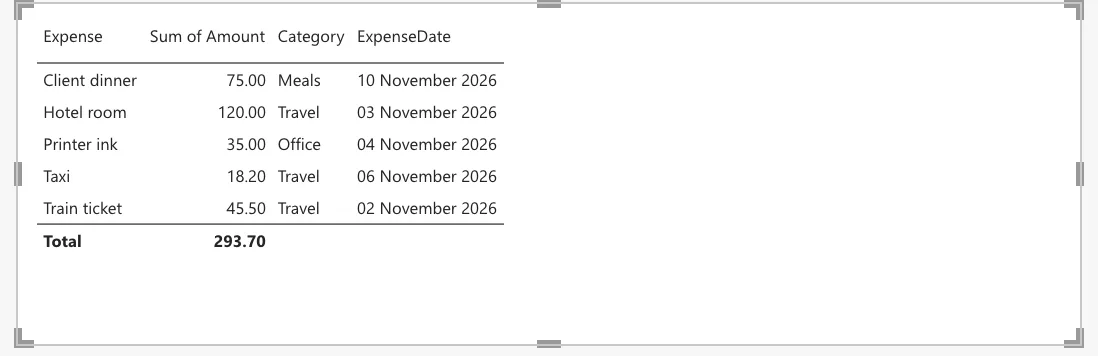
One ExpenseDate column with each claim's date.
What I Got
Four columns, Year, Quarter, Month and Day:
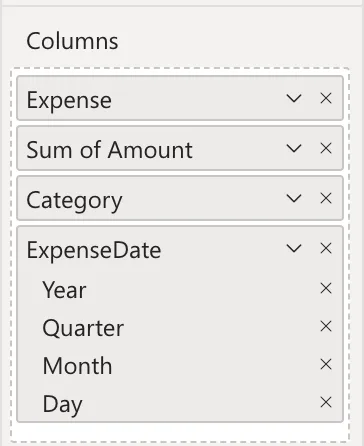
The Columns well showed ExpenseDate with four levels under it:
What I Checked
Microsoft's Auto date/time in Power BI Desktop explains it. With auto date/time on, Power BI creates a hidden table for each date column, with a single hierarchy that is named Date Hierarchy and consists of four levels: Year, Quarter, Month, and Day. In a visual, the date column then comes in as that hierarchy.
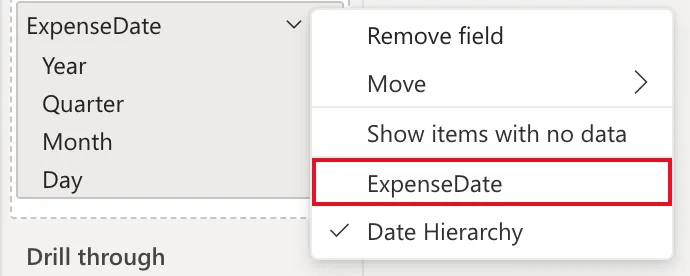
The same article gives the way back: report authors can toggle between using the hierarchy or the date column, by selecting the field's down-arrow in the well and choosing in its menu.
Why It Happens
The model has auto date/time on, so ExpenseDate has a date hierarchy, and a visual uses the hierarchy by default. A table shows each level of the hierarchy as a column.
The Fix
In the Columns well, select the arrow next to ExpenseDate. The menu has two choices at the bottom, ExpenseDate and Date Hierarchy, which is ticked. Select ExpenseDate:
After the Fix
The table has one ExpenseDate column with each claim's date:
Common Mistakes
| Mistake | What happens | Do this instead |
|---|---|---|
| Leaving the hierarchy in a table of records | Four columns instead of one date | Switch the field to the date column |
| Turning auto date/time off to fix one visual | The article warns it removes the auto date/time tables, so visuals that use them break | Switch this one field |
| Converting the date to text in Power Query | Dates sort as text | Keep the date, switch the field |
Troubleshooting
| Symptom | Likely cause | Fix |
|---|---|---|
| Year, Quarter, Month and Day in a table | The field uses its Date Hierarchy | Choose the date in the field's menu |
| A chart axis drills by year | The same hierarchy | Choose the date column, or use the levels on purpose |
| No Date Hierarchy in the menu | The column has no hierarchy | Nothing to switch |
FAQ
When is the hierarchy useful?
In charts, where readers drill from years to months to days. In a table of records, the date itself is usually what you want.
Does switching change the model?
No. It changes only how this visual uses the field.
Conclusion
A date column came into a table as its auto date/time hierarchy: Year, Quarter, Month and Day. In the well, the field's menu switches between Date Hierarchy and the date column; choosing ExpenseDate gave one column of dates.
