Fixed: Power BI Data Labels Show 45 Instead of 44.50

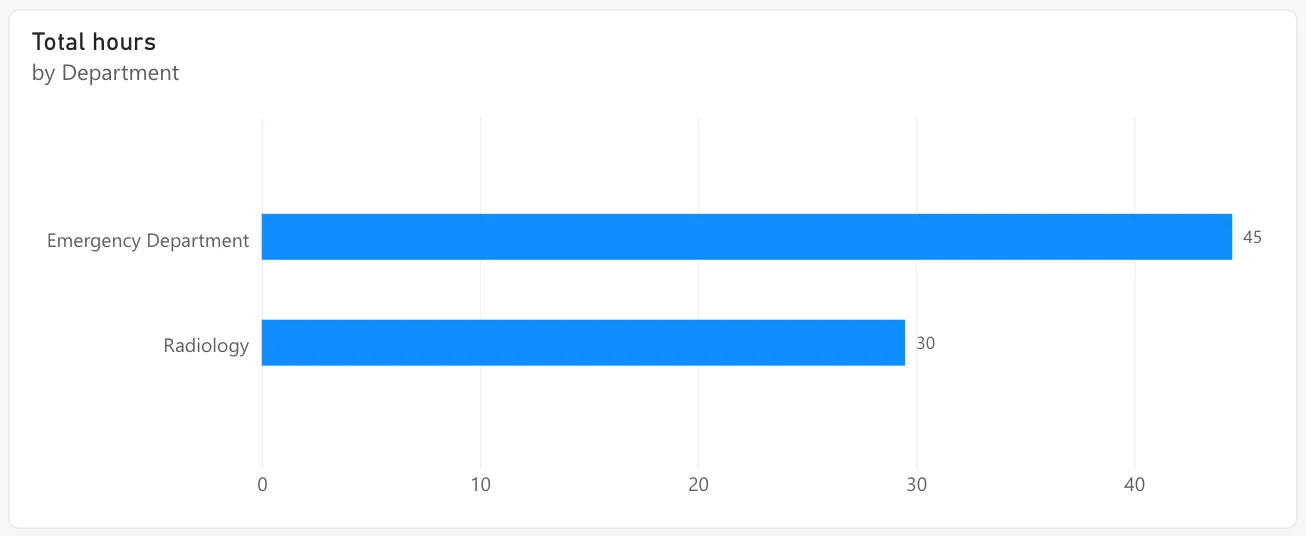
A Power BI bar chart labelled one department's 44.50 overtime hours as 45, and another's 29.50 as 30. The numbers were right underneath: the labels were rounding. The measure's format was General, which lets each visual choose its decimals. Setting the measure to Decimal number with two decimal places made the labels read 44.50 and 29.50.
What I Was Doing
I was building the report of an overtime app's Power BI model (Build an Overtime Timesheet App in Power Apps — Part 15: Build the Power BI Overtime Report). Its Total hours measure is SUM(OvertimeEntries[Hours]) (How to Add Up a Column in Power BI with SUM), and a bar chart shows it by department with data labels on (How to Show Data Labels on a Power BI Chart).
What I Expected
Labels with the hours as they are: 44.50 for the Emergency Department and 29.50 for Radiology.
What I Got
45 and 30:
The chart of hours by person, with the same measure, labelled one person's hours 24.5, with one decimal.
What I Checked
The data. The department totals were 44.50 and 29.50, and the card on the same page showed their sum with two decimals, 74.00.
The measure's format. In the model, the Total hours measure's Formatting showed Format General, the default for a new measure. General sets no number of decimals, so each visual picked its own: none on one chart, one on the other.
Why It Happens
With the General format, a chart's data labels choose how many decimals to show by themselves, and on this chart they chose none, so 44.50 rounded to 45. Microsoft's documentation doesn't describe how a label picks its decimals for General; the fix is to stop leaving it to the label.
The Fix
Format the measure in the model, so every visual uses the same format (How to Show a Measure with Two Decimal Places in Power BI):
- Open the semantic model in Editing mode and select the Total hours measure.
- In Properties > Formatting, change Format to Decimal number.
- Check Decimal places is 2.
After the Fix
The chart labels read 44.50 and 29.50:
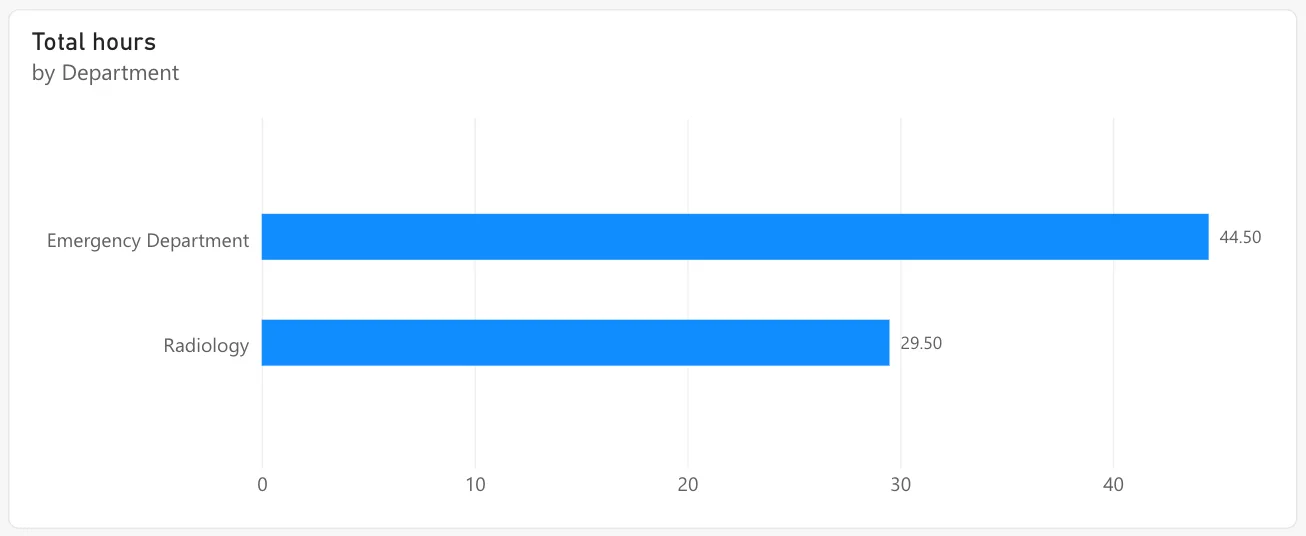
To capture the "before" picture above, I set the format back to General for a moment, which brought 45 and 30 back, then set Decimal number again.
Common Mistakes
| Mistake | What happens | Do this instead |
|---|---|---|
| Setting decimals on each chart's labels | The next visual or report rounds again | Format the measure in the model |
| Trusting a label without checking a total | A rounded value looks like the real one | Compare with a table or card |
| Rounding in the measure with ROUND | The model's numbers change, not just the display | Format, don't round |
Troubleshooting
| Symptom | Likely cause | Fix |
|---|---|---|
| Labels in whole numbers, a card with decimals | The measure's format is General | Decimal number, 2 places |
| Different visuals show different decimals | Each visual chooses under General | Format the measure |
| One visual still differs after formatting | That visual overrides the format in its own settings | Reset its value format |
FAQ
Is the total wrong?
No. Only the label's display rounds; the measure's value is 44.50.
Should hours use Decimal number?
For decimal hours, yes: Decimal number with two places shows quarter hours as .25 and .75.
Conclusion
Data labels showed 45 for 44.50 because the measure's format was General, which leaves the decimals to each visual. Decimal number with 2 decimal places on the measure made every visual show 44.50.
