Fixed: "No charts in this section" on the MLflow System Metrics Tab

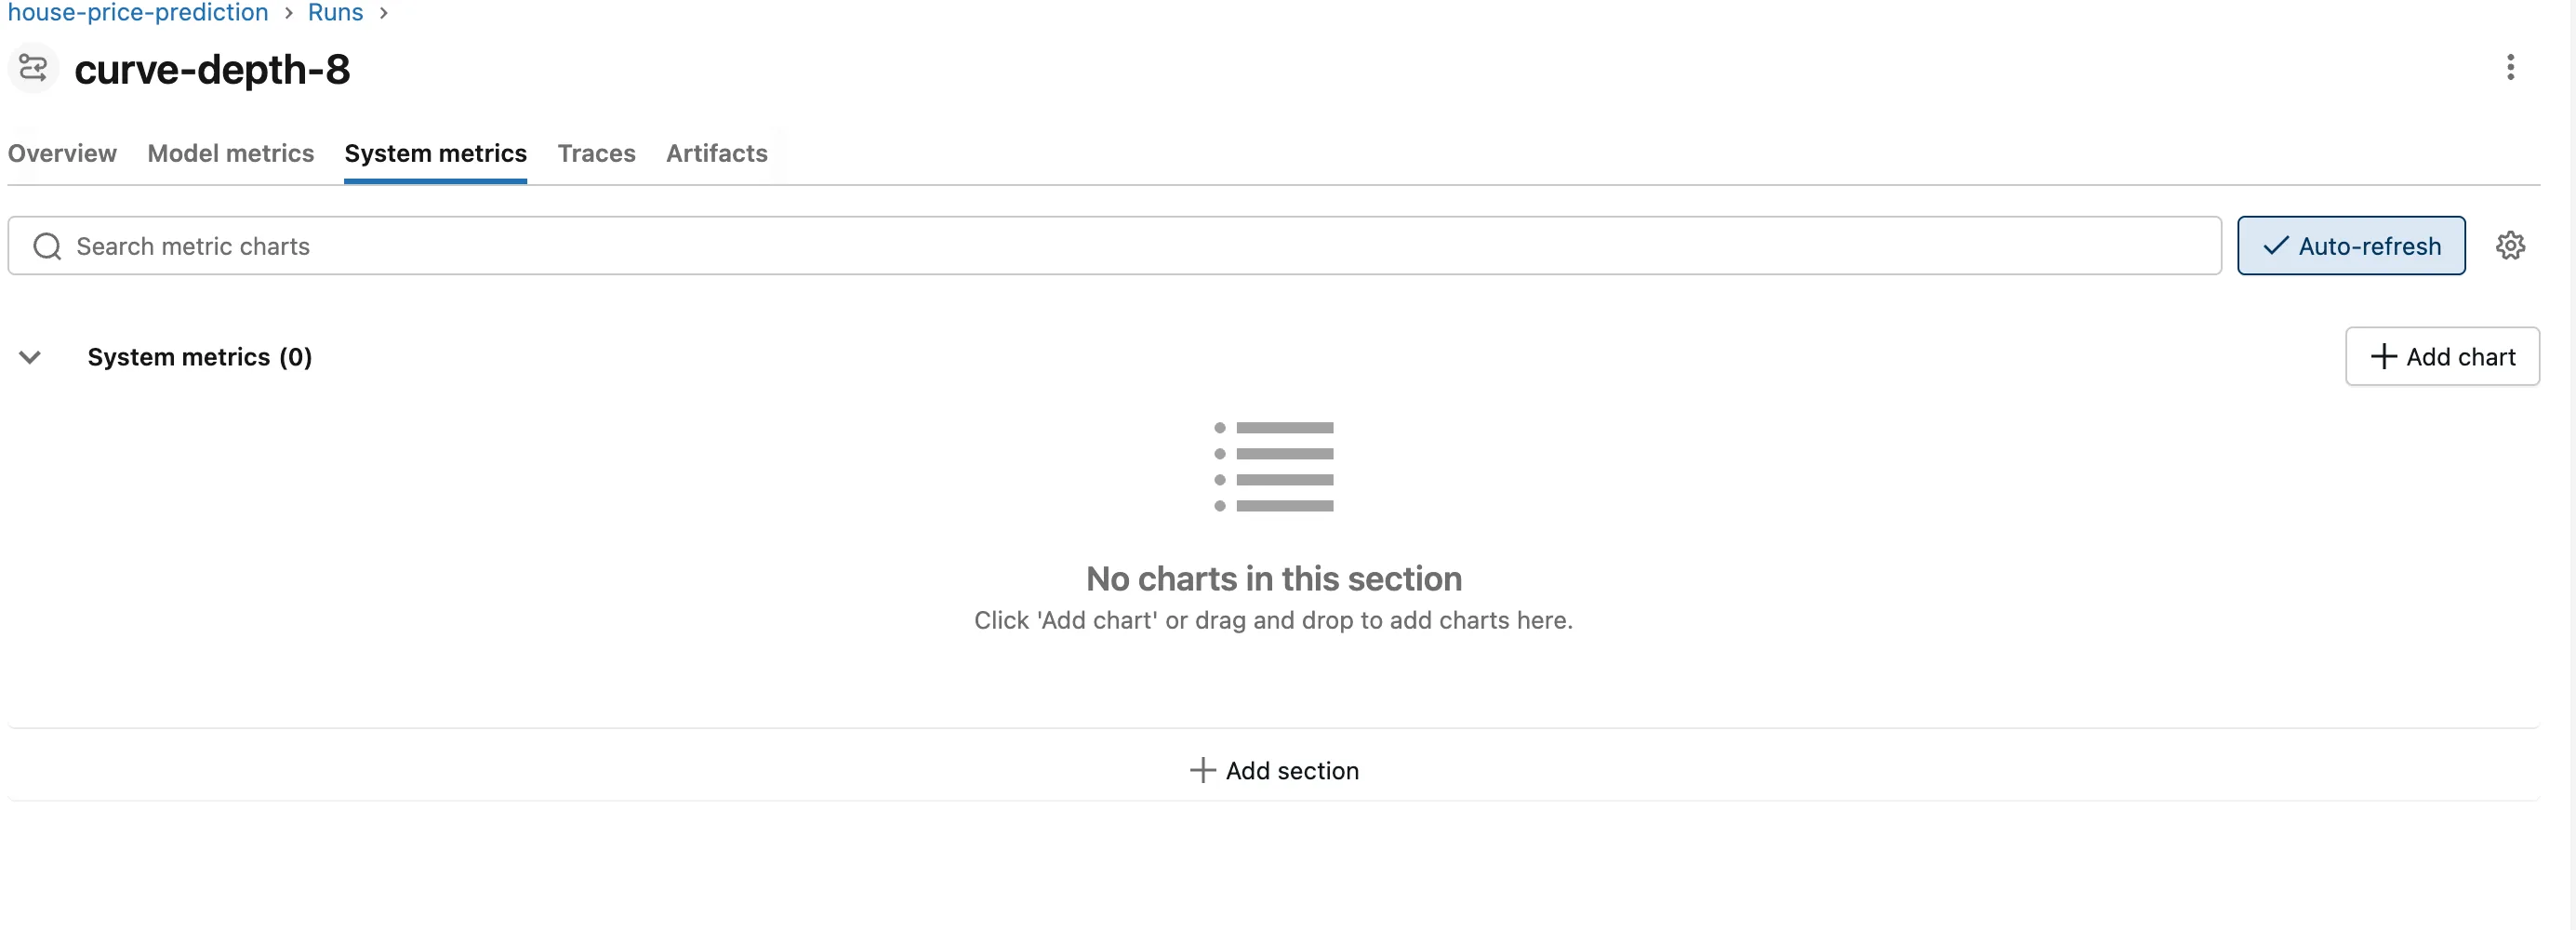
The System metrics tab of a short MLflow run said System metrics (0) and "No charts in this section", although system metrics were turned on and longer runs had their charts. MLflow logs a sample only after waiting one sampling interval and finding the run still going, so a run that ends sooner records nothing. Sample more often than your shortest run lasts.
What I Was Doing
I was building Part 2 of the MLflow series, with MLflow 3.18.0 and psutil 7.2.2 on a Mac. The project's training command starts each run with log_system_metrics=True and samples every second, through mlflow.set_system_metrics_sampling_interval(). I trained three random forests; the third one limits its trees to a depth of 8:
uv run train --max-depth 8 --run-name curve-depth-8
2026/11/18 10:49:56 INFO house_price_prediction: Loading the California Housing data
2026/11/18 10:49:56 INFO mlflow.system_metrics.system_metrics_monitor: Skip logging GPU metrics. Set logger level to DEBUG for more details.
2026/11/18 10:49:56 INFO mlflow.system_metrics.system_metrics_monitor: Started monitoring system metrics.
2026/11/18 10:49:56 INFO house_price_prediction: Training on 13209 rows, scoring on 3303 validation rows
2026/11/18 10:49:56 INFO house_price_prediction:   10 trees: validation RMSE 0.5939
2026/11/18 10:49:56 INFO house_price_prediction:   20 trees: validation RMSE 0.5922
2026/11/18 10:49:56 INFO house_price_prediction:   30 trees: validation RMSE 0.5888
2026/11/18 10:49:56 INFO house_price_prediction:   40 trees: validation RMSE 0.5875
2026/11/18 10:49:56 INFO house_price_prediction:   50 trees: validation RMSE 0.5875
2026/11/18 10:49:56 INFO house_price_prediction:   60 trees: validation RMSE 0.5867
2026/11/18 10:49:56 INFO house_price_prediction:   70 trees: validation RMSE 0.5872
2026/11/18 10:49:56 INFO house_price_prediction:   80 trees: validation RMSE 0.5862
2026/11/18 10:49:57 INFO house_price_prediction:   90 trees: validation RMSE 0.5861
2026/11/18 10:49:57 INFO house_price_prediction:  100 trees: validation RMSE 0.5857
2026/11/18 10:49:57 INFO house_price_prediction: Run curve-depth-8: MAE 0.403, RMSE 0.586, R2 0.738
🏃 View run curve-depth-8 at: http://127.0.0.1:8080/#/experiments/1/runs/60a6a374e9724a86bd4a3b401de03142
🧪 View experiment at: http://127.0.0.1:8080/#/experiments/1
2026/11/18 10:49:57 INFO mlflow.system_metrics.system_metrics_monitor: Stopping system metrics monitoring...
2026/11/18 10:49:57 INFO mlflow.system_metrics.system_metrics_monitor: Successfully terminated system metrics monitoring!
What I Expected
The run's System metrics tab with eight charts, one each for CPU, memory, disk and network use, like the two runs before it.
What I Got
System metrics (0)
No charts in this section
Click 'Add chart' or drag and drop to add charts here.
What I Checked
Was system metrics logging on? Yes. The output shows Started monitoring system metrics. when the run began and Successfully terminated system metrics monitoring! when it ended, with no warning in between.
How many samples did each run log? This script reads each run's length and the points of its CPU metric, with get_metric_history. It takes the experiment's name and then the names of the runs to check. Create count_system_samples.py in any project that has MLflow installed:
import sys

import mlflow
from mlflow import MlflowClient

mlflow.set_tracking_uri("http://127.0.0.1:8080")
client = MlflowClient()
experiment = client.get_experiment_by_name(sys.argv[1])

for name in sys.argv[2:]:
    run = client.search_runs(
        [experiment.experiment_id], filter_string=f"attributes.run_name = '{name}'"
    )[0]
    seconds = (run.info.end_time - run.info.start_time) / 1000
    samples = client.get_metric_history(run.info.run_id, "system/cpu_utilization_percentage")
    print(f"{name}: ran for {seconds:.1f} s, {len(samples)} CPU samples logged")
uv run python count_system_samples.py house-price-prediction curve-100-trees curve-300-trees curve-depth-8
curve-100-trees: ran for 1.5 s, 1 CPU samples logged
curve-300-trees: ran for 3.7 s, 3 CPU samples logged
curve-depth-8: ran for 1.0 s, 0 CPU samples logged
The pattern is plain: sampling every second, a run of 3.7 seconds logged 3 samples, a run of 1.5 seconds logged 1, and the run of 1.0 second logged none.
What does the documentation say? MLflow's System Metrics guide says: "By default, system metrics are sampled every 10 seconds and are directly logged after sampling." It doesn't say what happens to a run that ends before a sample is logged.
What does the monitor do? In MLflow 3.18.0, the loop that samples the computer is SystemMetricsMonitor.monitor, in mlflow/system_metrics/system_metrics_monitor.py:
while not self._shutdown_event.is_set():
    for sample_idx in range(self.samples_before_logging):
        self.collect_metrics()
        self._shutdown_event.wait(self.sampling_interval)
        run = MlflowClient(self._tracking_uri).get_run(self._run_id)
        if run.info.status != "RUNNING" or self._shutdown_event.is_set():
            return
    metrics = self.aggregate_metrics()
    self.publish_metrics(metrics)
It takes a sample, waits one interval, and asks the tracking server whether the run is still running. Only then does it log the sample. If the run has ended, it returns, and the sample it was holding is never logged.
Why It Happens
Each logged sample costs one full interval of waiting. The curve-depth-8 run took its first sample when it started and ended before the one-second wait was over, so the monitor stopped without logging anything. The 1.5-second run lived through one wait, so it logged one sample, and the 3.7-second run through three.
So a run records a sample only while it's still going one interval after the sample was taken. A run shorter than one interval records no system metrics at all, and its tab shows "No charts in this section". With MLflow's default of 10 seconds, that's any run shorter than 10 seconds.
When samples are averaged with set_system_metrics_samples_before_logging, the window is longer still: the documentation calls it "the product of" the interval and the number of samples.
The Fix
Sample more often than your shortest run lasts. Call mlflow.set_system_metrics_sampling_interval() before mlflow.start_run(), here with a fifth of a second:
mlflow.set_system_metrics_sampling_interval(0.2)
The interval doesn't have to be a whole number. MLflow's guide describes the matching environment variable, MLFLOW_SYSTEM_METRICS_SAMPLING_INTERVAL, as "an integer representing the logging frequency in seconds", but MLflow 3.18.0 reads it as a decimal number: mlflow/environment_variables.py defines it with the type float, and 0.2 worked. Don't go below 0.1: psutil, which MLflow uses to read CPU use, recommends "at least 0.1 seconds between calls" for accuracy.
In my project, the interval comes from a setting, HOUSE_PRICES_SYSTEM_METRICS_INTERVAL, which the training command passes to mlflow.set_system_metrics_sampling_interval(). It only accepted whole seconds, from 1 up, so I changed it to a decimal with a minimum of 0.1, in src/house_price_prediction/config.py:
system_metrics_interval: float = Field(
    default=1.0,
    ge=0.1,
    description="Seconds between two system metrics samples. A run records nothing unless it "
    "lasts longer than one interval, so keep this below your shortest run.",
)
Then I trained the same model again, sampling every 0.2 seconds:
- macOS / Linux
- Windows (PowerShell)
HOUSE_PRICES_SYSTEM_METRICS_INTERVAL=0.2 uv run train --max-depth 8 --run-name curve-depth-8-sampled
$env:HOUSE_PRICES_SYSTEM_METRICS_INTERVAL = "0.2"
uv run train --max-depth 8 --run-name curve-depth-8-sampled
Remove-Item Env:HOUSE_PRICES_SYSTEM_METRICS_INTERVAL
Setting MLFLOW_SYSTEM_METRICS_SAMPLING_INTERVAL instead would have changed nothing here: the project calls mlflow.set_system_metrics_sampling_interval() itself, and that call sets the same variable, replacing what you set. When your own code doesn't call it, the MLflow variable works on its own.
After the Fix
2026/11/18 10:58:40 INFO house_price_prediction: Loading the California Housing data
2026/11/18 10:58:40 INFO mlflow.system_metrics.system_metrics_monitor: Skip logging GPU metrics. Set logger level to DEBUG for more details.
2026/11/18 10:58:40 INFO mlflow.system_metrics.system_metrics_monitor: Started monitoring system metrics.
2026/11/18 10:58:40 INFO house_price_prediction: Training on 13209 rows, scoring on 3303 validation rows
2026/11/18 10:58:40 INFO house_price_prediction:   10 trees: validation RMSE 0.5939
2026/11/18 10:58:40 INFO house_price_prediction:   20 trees: validation RMSE 0.5922
2026/11/18 10:58:40 INFO house_price_prediction:   30 trees: validation RMSE 0.5888
2026/11/18 10:58:40 INFO house_price_prediction:   40 trees: validation RMSE 0.5875
2026/11/18 10:58:40 INFO house_price_prediction:   50 trees: validation RMSE 0.5875
2026/11/18 10:58:40 INFO house_price_prediction:   60 trees: validation RMSE 0.5867
2026/11/18 10:58:40 INFO house_price_prediction:   70 trees: validation RMSE 0.5872
2026/11/18 10:58:40 INFO house_price_prediction:   80 trees: validation RMSE 0.5862
2026/11/18 10:58:40 INFO house_price_prediction:   90 trees: validation RMSE 0.5861
2026/11/18 10:58:41 INFO house_price_prediction:  100 trees: validation RMSE 0.5857
2026/11/18 10:58:41 INFO house_price_prediction: Run curve-depth-8-sampled: MAE 0.403, RMSE 0.586, R2 0.738
🏃 View run curve-depth-8-sampled at: http://127.0.0.1:8080/#/experiments/1/runs/a5c92ce28557481999f160318456da7a
🧪 View experiment at: http://127.0.0.1:8080/#/experiments/1
2026/11/18 10:58:41 INFO mlflow.system_metrics.system_metrics_monitor: Stopping system metrics monitoring...
2026/11/18 10:58:41 INFO mlflow.system_metrics.system_metrics_monitor: Successfully terminated system metrics monitoring!
The same model, with the same scores, and this time the samples arrived:
uv run python count_system_samples.py house-price-prediction curve-depth-8-sampled
curve-depth-8-sampled: ran for 1.4 s, 5 CPU samples logged
The run's System metrics tab now has all eight charts:
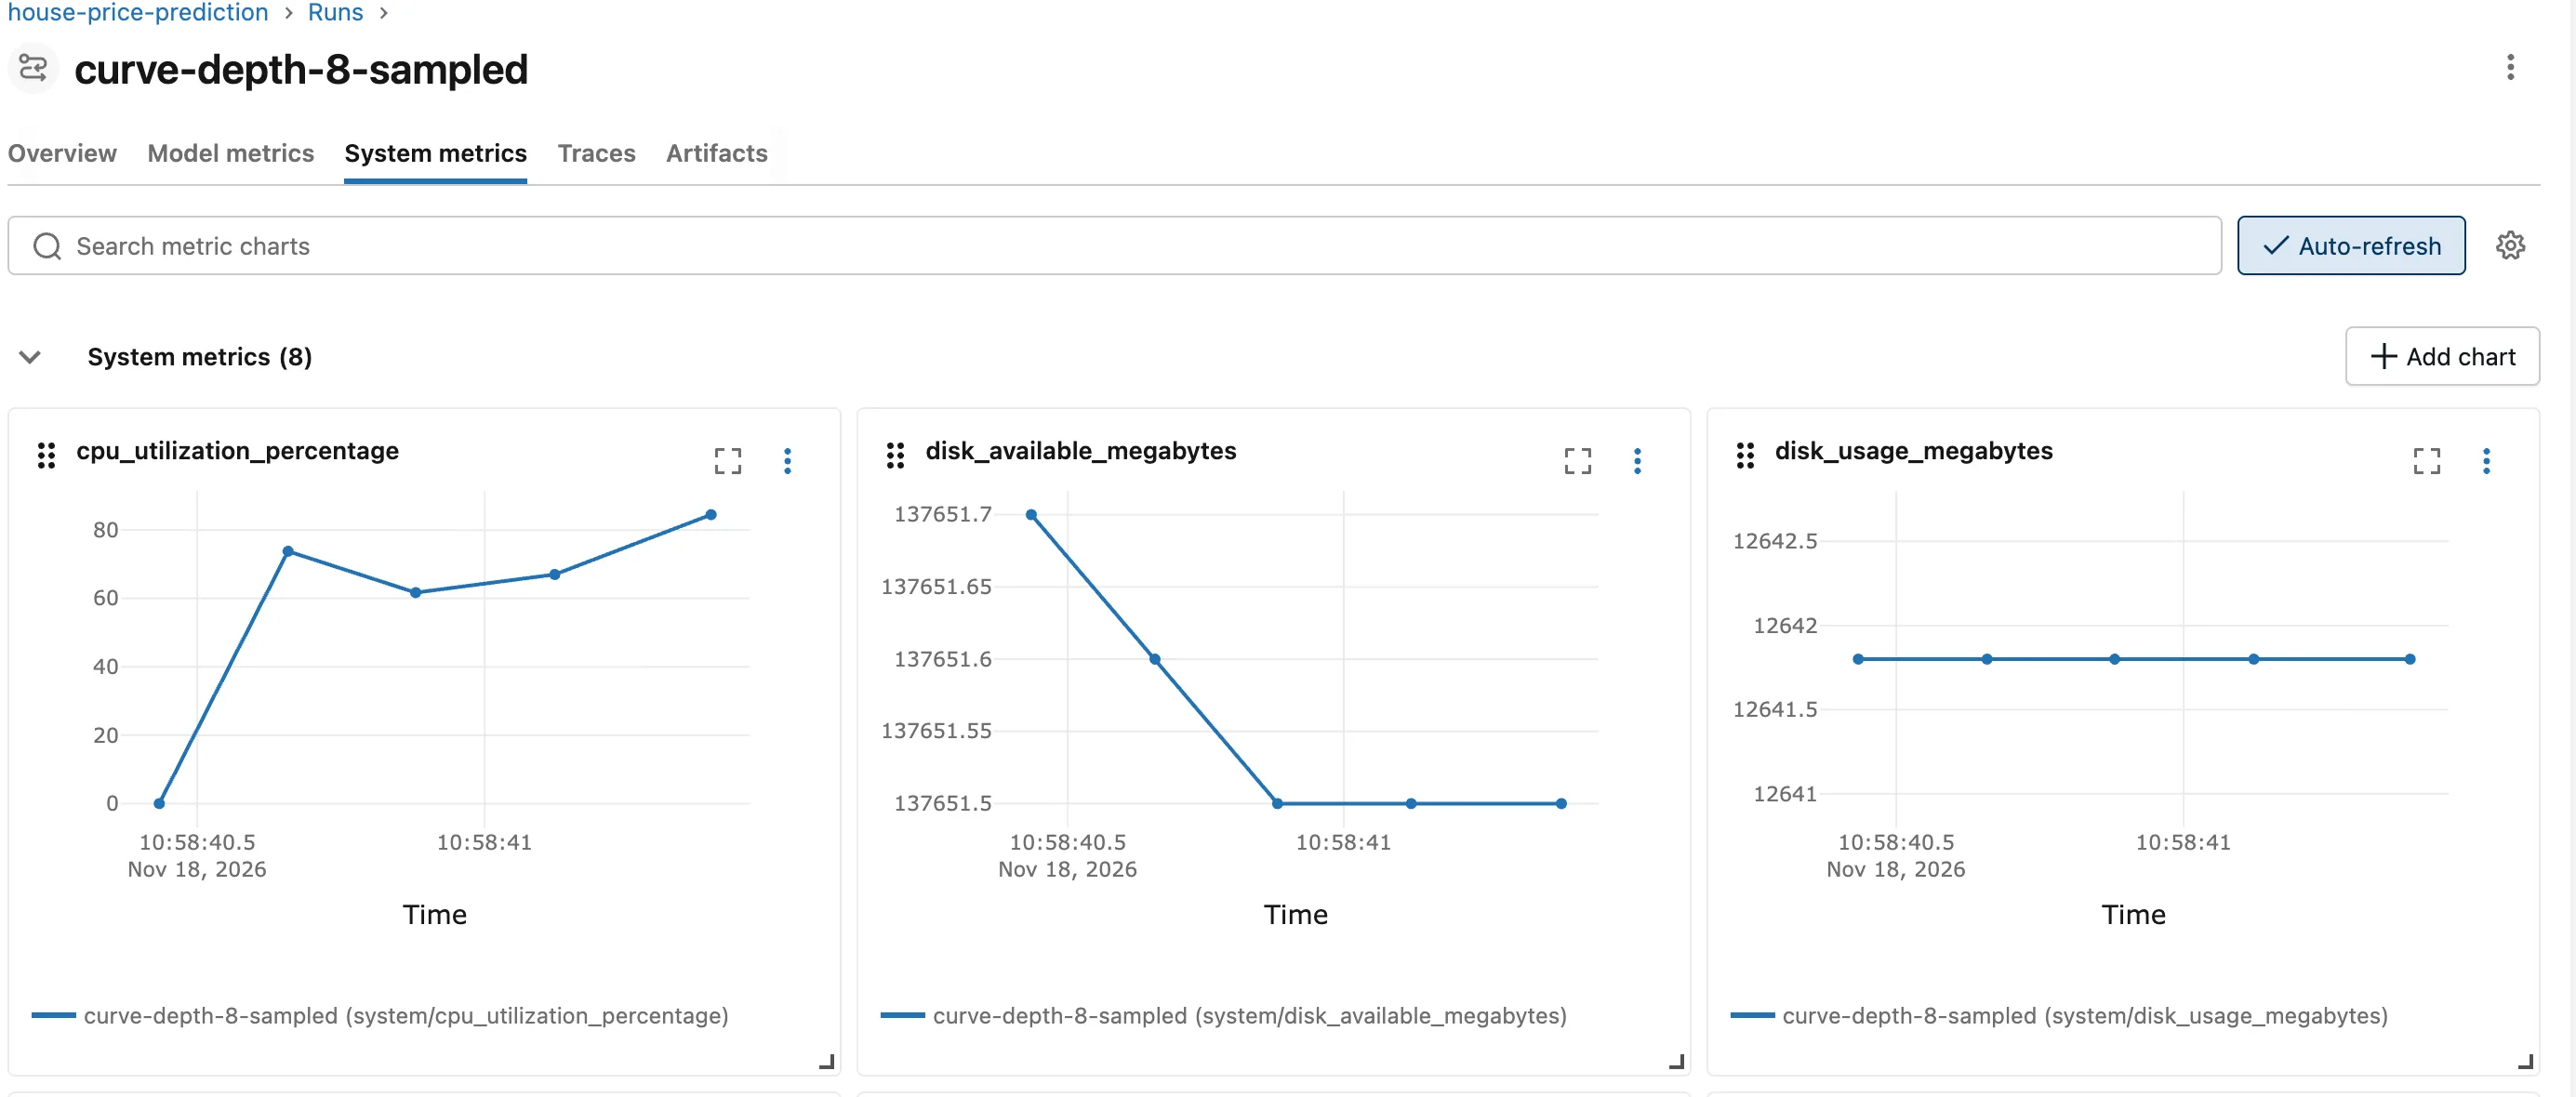
The first CPU sample is 0.0 in every run: psutil's first reading in each new thread is "a meaningless 0.0 value", as How to Turn On System Metrics Logging in MLflow explains.
Common Mistakes
| Mistake | What happens | Do this instead |
|---|---|---|
| Keeping the 10-second default for runs that last seconds | Nothing is logged | Sample more often than your shortest run lasts |
Setting the interval after start_run | The run's monitor already started with the old interval | Set it before start_run |
Setting MLFLOW_SYSTEM_METRICS_SAMPLING_INTERVAL when the code calls set_system_metrics_sampling_interval | The call replaces your value | Change the value the code passes |
| Going below 0.1 seconds | psutil's CPU figures lose accuracy, and the monitor asks the server about the run more often | Stay at 0.1 seconds or more |
Troubleshooting
| Symptom | Likely cause | Fix |
|---|---|---|
| System metrics (0), "No charts in this section" | The run ended within one sampling interval | A shorter interval |
Only one point per chart, CPU at 0.0 | The run lasted between one and two intervals, and the first CPU reading is always 0.0 | A shorter interval |
| No system metrics on any run | System metrics are off, or psutil is missing | How to Turn On System Metrics Logging in MLflow |
FAQ
Does a shorter interval slow training down?
The monitor runs in its own thread, beside the training. Each sample also asks the tracking server whether the run is still going, so a shorter interval means more requests to the server.
Why does the run that lasted 1.5 seconds have only a CPU reading of 0.0?
Its one logged sample was the first one, and the first CPU reading in each run's monitor is always 0.0. Its run lived long enough to log one sample, not two.
Can I get the missing samples back for a finished run?
No. They were never logged, so the tracking server doesn't have them. Train the run again with a shorter interval.
Conclusion
A one-second run sampled every second showed System metrics (0): MLflow 3.18.0 logs a sample only after waiting one interval and finding the run still going, and that run had already ended. Sampling every 0.2 seconds with mlflow.set_system_metrics_sampling_interval(0.2), the same training logged five samples and all eight charts. Keep the interval below the length of your shortest run, and at 0.1 seconds or more.
Additional Resources
- System Metrics — MLflow's guide, including the sampling settings.
- mlflow.set_system_metrics_sampling_interval — the reference for the function.
- psutil.cpu_percent — psutil's advice on the time between CPU readings.
