Fixed: "Data Label Font Reduced" on a Power BI Visual

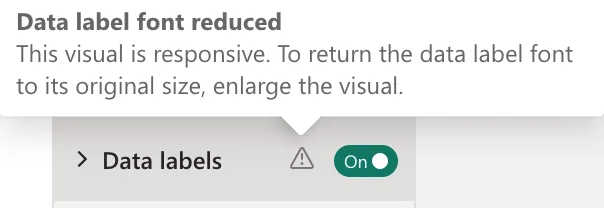
After I turned data labels on, a Power BI bar chart showed warning triangles in its format settings: Data label font reduced, Axis font reduced and Legend font reduced. The tooltip said This visual is responsive. To return the data label font to its original size, enlarge the visual. I had shrunk the report page to 1280 by 720; going back to the default 1920 by 1080, with visuals sized to match, removed the warnings.
What I Was Doing
I was building the report of an overtime app's Power BI model (Build an Overtime Timesheet App in Power Apps — Part 15: Build the Power BI Overtime Report): cards, a month slicer, two bar charts and a table. On the new page, the text looked small to me, so I changed the page size from its default 1920 by 1080 to 1280 by 720 (How to Change the Page Size of a Power BI Report) and placed the visuals on it. Then I turned on data labels on the chart of hours by department (How to Show Data Labels on a Power BI Chart).
What I Expected
Each bar labelled with its value, at the chart's normal font size.
What I Got
The labels appeared, and the chart's Format visual settings showed warning triangles next to Data labels, the axes and the legend. Hovering over the one next to Data labels:
The chart at that moment, with its labels:
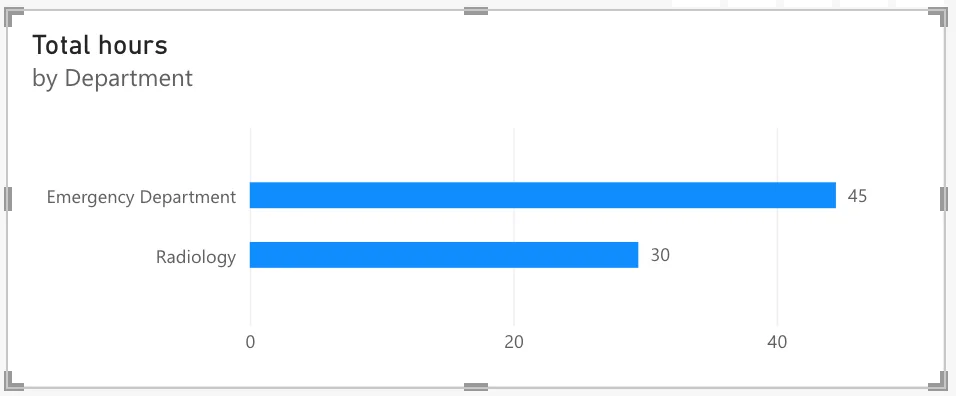
The labels also read 45 and 30 for 44.50 and 29.50 hours, a separate problem (Fixed: Power BI Data Labels Show 45 Instead of 44.50).
What I Checked
What "responsive" means. Microsoft's Optimize visual formatting says many charts are responsive by default: As a visual changes size, Power BI gives priority to the data. Its tip adds: If you don't want the elements on your chart to be affected by the visual's size, toggle off the responsive setting in the visual's settings (General > Properties > Advanced options > Responsive).
The page size. Microsoft's visual defaults article says that with the Fluent 2 theme, new pages default to 1920x1080, giving you more space. On my 1280 by 720 page, every visual was two-thirds of the size it would have had.
Why It Happens
The chart is responsive, so when it's small, Power BI shrinks its fonts to keep the bars readable, and the format pane warns that it did. Shrinking the page made every visual small. In hindsight, the small text I'd seen at 1920 by 1080 came from fitting a large page into the browser window, which the page view does, not from the page size.
The Fix
Make the visuals big enough instead of switching responsiveness off:
- Page size back to the default. With nothing selected, Format page > Canvas settings: 16:9, 1920 x 1080 (Full HD).
- Visuals one and a half times bigger. I selected each visual in the Selection pane and typed its new size and position in Format > General > Properties (How to Set the Exact Size and Position of a Visual in Power BI). The department chart became 930 by 375 pixels.
After the Fix
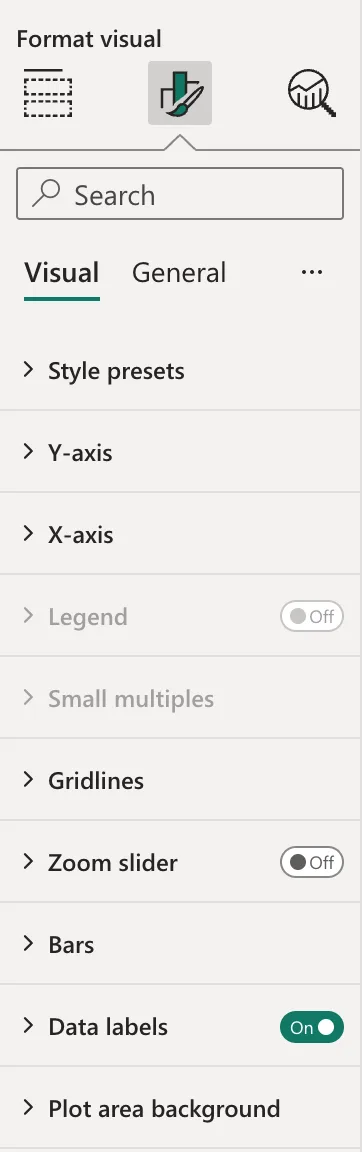
The chart's Format visual settings show Data labels On with no warning, and none on the axes:
Common Mistakes
| Mistake | What happens | Do this instead |
|---|---|---|
| Shrinking the page to make text look bigger | Visuals get smaller and shrink their fonts | Keep 1920 x 1080 and size the visuals |
| Turning Responsive off to silence the warning | The fonts keep their size in a chart that's still small | Make the visual bigger first |
| Ignoring the triangle | Readers get small, hard-to-read labels | Enlarge the visual |
Troubleshooting
| Symptom | Likely cause | Fix |
|---|---|---|
| Data label font reduced | The chart is too small for its labels | Enlarge the visual |
| Axis font reduced | The same | Enlarge the visual |
| The page's text looks small at 1920 x 1080 | The page is fitted into the browser window | Leave the page size; Microsoft's page settings article describes the page views |
FAQ
Should I turn Responsive off?
The article offers it for when you don't want the chart's elements affected by its size. I preferred bigger visuals, which keep the fonts and the room for labels.
Does the warning appear for readers?
The triangles are in the format settings, which only editors see. Readers see the smaller text.
Conclusion
Data label font reduced means a responsive visual shrank its labels because it's small. My page was 1280 by 720; back at the default 1920 by 1080, with visuals sized one and a half times bigger, the warnings went away and the labels kept their size.
Additional Resources
- Optimize visual formatting
- Visual defaults in Power BI reports
- Apply page size and settings in a Power BI report
