Fixed: Column Chart Y-Axis Doesn't Start at Zero in Power Apps

A Power Apps column chart showed 10 and 10.25 hours as a short column next to one three times its height. Its y-axis ran from 9.9 to 10.3, not from zero. Setting the chart's SeriesAxisMin to 0 fixed the scale.
What I Was Doing
I was building the Reports screen of the Overtime Timesheet app: a classic Column chart with each department's approved overtime hours for a month (How to Add a Column Chart in Power Apps). Its Items gives one row per department, with the department's name and its hours:
If(
    IsBlank(locRowsRS),
    Blank(),
    Sort(
        ShowColumns(
            AddColumns(GroupBy(locRowsRS, Department, Rows), Hours, Sum(Rows, Hours)),
            Department,
            Hours
        ),
        Department
    )
)
I'd set GridStyle to GridStyle.All and left Markers on, so each column shows its value, as Microsoft's accessibility guidance for charts suggests. The axis settings were the ones Studio inserted.
What I Expected
Two columns of almost the same height: November had 10 hours in the Emergency Department and 10.25 in Radiology.
What I Got
A payroll user opened the screen, and Radiology's column was about three times as tall as the Emergency Department's. The y-axis ran from 9.9 to 10.3:
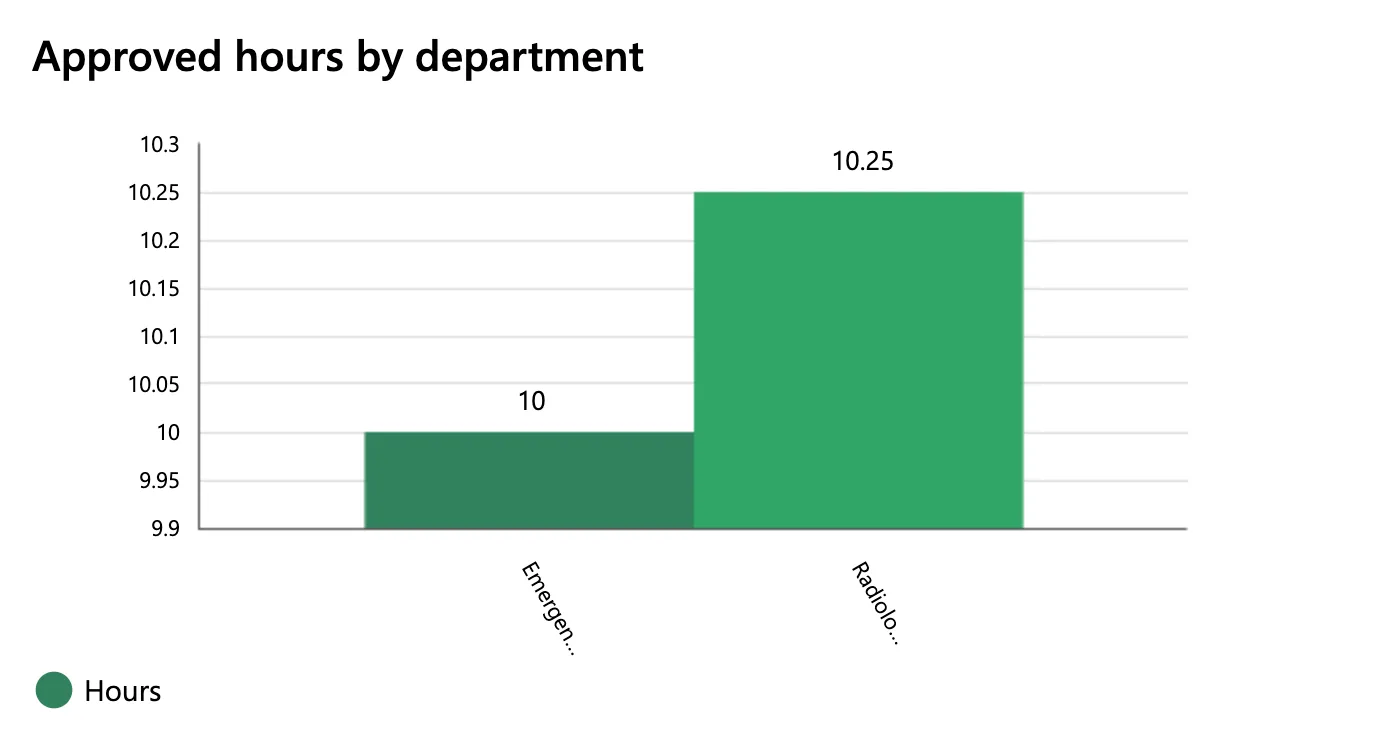
The values above the columns were right; the picture they sat on wasn't. October, with one department at 2 hours, got an axis from 1.985 to 2.015.
What I Checked
The chart's properties. Microsoft's Column chart and Line chart reference lists two properties for the y-axis of a column chart:
- SeriesAxisMin: A number that determines the minimum value of the y-axis for a column chart.
- SeriesAxisMax: The maximum value of the y-axis for a column or line chart.
I hadn't set either: the chart had the values Studio inserted, and SeriesAxisMax was empty. The reference doesn't say how the chart picks its range when you don't set one; on this screen, it drew a narrow range around the values.
What the chart is for. The columns compare departments' totals, and readers compare columns by their heights. A height only shows a quantity when the axis starts at zero, so the minimum has to be 0. Hours can't be negative, so 0 is always the bottom. The top can stay automatic.
Why It Happens
Without a SeriesAxisMin of its own, the chart chose the range of the y-axis itself, and on this screen it chose one just wide enough for the values, 9.9 to 10.3. On that scale, a difference of 0.25 hours filled most of the chart's height.
The Fix
Set the chart's SeriesAxisMin to 0:
0

SeriesAxisMax stays empty, so the top of the axis still follows the largest value. Save and publish the app (How to Publish a Canvas App in Power Apps). People who have the app open get the new version when they open it again (Fixed: Users Still See the Old Version After You Publish a Canvas App in Power Apps).
After the Fix
The same month, for the same payroll user: the axis runs from 0 to 14, and the two columns are almost the same height, as their totals are:
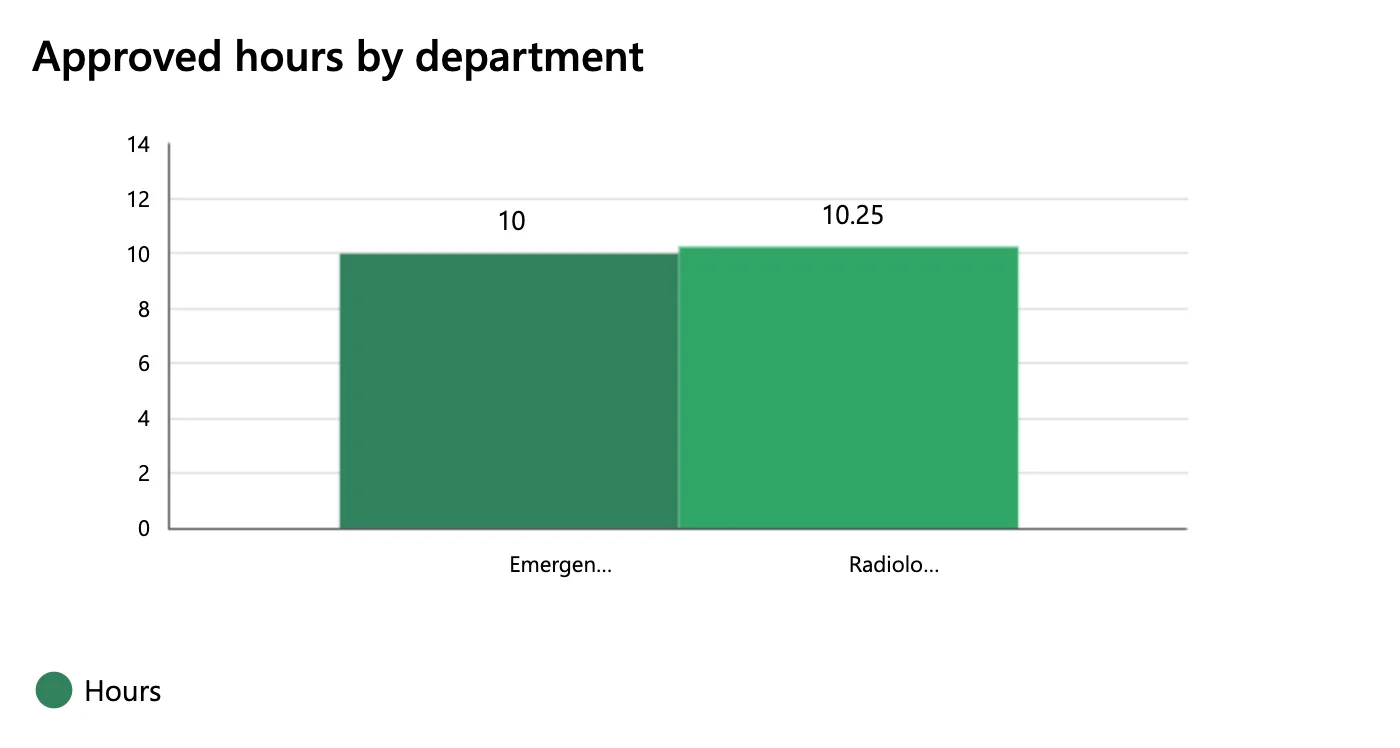
The department names under the columns were still cut short. That's a separate problem: Fixed: Column Chart Cuts Off Labels with an Ellipsis in Power Apps.
Common Mistakes
| Mistake | What happens | Do this instead |
|---|---|---|
| Leaving SeriesAxisMin as inserted | The axis can start just under the smallest value, and small differences look large | 0 for amounts that can't be negative |
| Using YAxisMin on a column chart | It's a Line chart property; the reference says it isn't available for column charts | SeriesAxisMin |
| Turning Markers off | Readers can't see the exact values | Keep Markers true |
Troubleshooting
| Symptom | Likely cause | Fix |
|---|---|---|
| Small differences look huge | The axis doesn't start at zero | SeriesAxisMin 0 |
| The axis still starts above zero | The app open in the browser is the old version | Open the app again a few minutes after publishing |
FAQ
Should the axis always start at zero?
For columns, yes: a column's height is read as its amount. Microsoft's accessibility guidance for charts also suggests showing both axes with GridStyle GridStyle.All, so readers can judge the scale.
Does a Line chart have the same setting?
A line chart uses YAxisMin and YAxisMax instead. The reference lists SeriesAxisMin and SeriesAxisMax for column charts.
Can the minimum be a formula?
Yes, it's a property like any other. For hours, 0 is the right constant.
Conclusion
A column chart in Power Apps can start its y-axis just under the smallest value, which makes small differences look large. Set SeriesAxisMin to 0 for amounts that can't be negative, and leave SeriesAxisMax empty so the top follows the data.
Additional Resources
- Column chart and Line chart controls in Power Apps: SeriesAxisMin, SeriesAxisMax and the accessibility guidelines
- Show data in a line, pie, or bar chart in canvas apps
