Fixed: Column Chart Cuts Off Labels with an Ellipsis in Power Apps

A Power Apps column chart showed Emergency Department as Emergen… and Radiology as Radiolo…. Turning the labels horizontal, with plenty of room beside them, didn't help, and the chart's reference has no setting for how long a label may be. The fix was to keep the chart and list each full name and its total right under it.
What I Was Doing
I was building the Reports screen of the Overtime Timesheet app, with a classic Column chart of each department's approved overtime hours for a month (How to Add a Column Chart in Power Apps). The chart's Items has one row per department, with the department's name first and its hours second, so the names label the columns.
What I Expected
The department names under their columns: Emergency Department and Radiology.
What I Got
Each name was cut after seven letters, with an ellipsis, and turned at an angle:
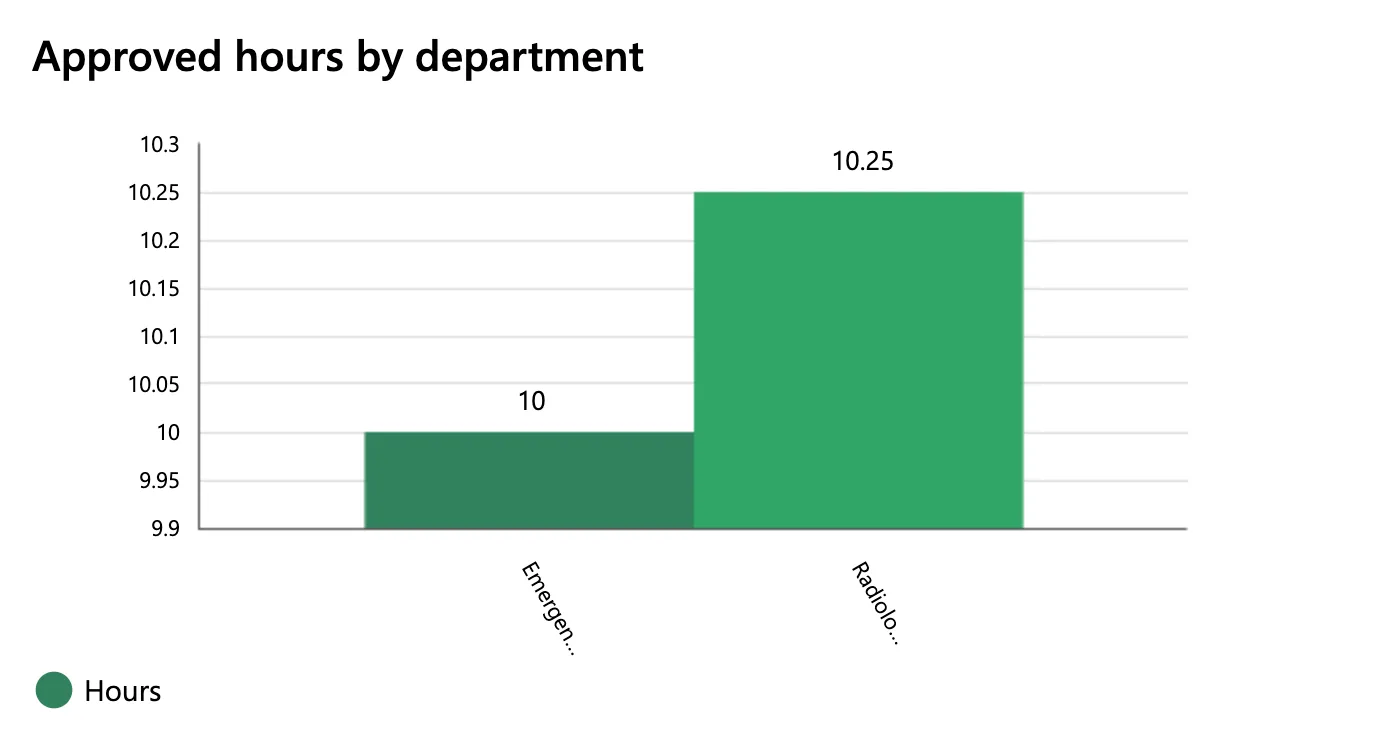
The chart's scale was wrong too: that's Fixed: Column Chart Y-Axis Doesn't Start at Zero in Power Apps, and its fix is in place in the screenshots that follow.
What I Checked
The label angle. Microsoft's Column chart and Line chart reference has one property for these labels: XLabelAngle, the angle of the labels below the x-axis. The chart had Studio's 60 degrees. A slanted label has less room than a level one, so I set it to 0:

The label turned level, and stayed cut. For an approver with one department, the column took half the chart's width, and the name under it still read Emergen…:
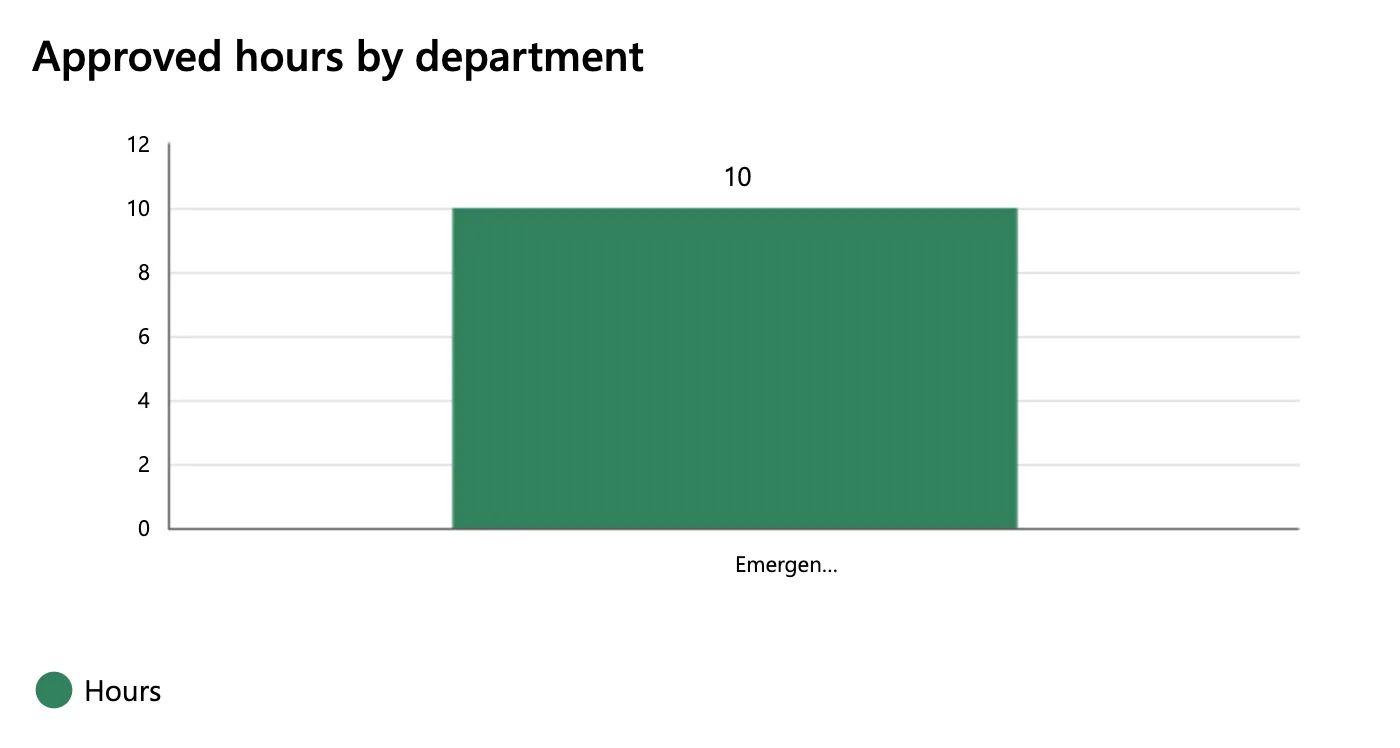
So the room wasn't the reason. Both names were cut after seven letters, wherever they sat.
The rest of the reference. None of the chart's other properties sets how long a label may be: the list has the font, its Size, the colours, the gaps between columns, the axis range and the angles. The reference doesn't mention shortening labels at all. With no documented setting to change, I stopped there instead of trying property after property.
What screen readers get. The reference says chart graphics and Legend are hidden from screen reader users. As an alternative, a tabular form of the data is presented to them. Reading the page's text showed that table with the full names, Emergency Department 10 and Radiology 10.25. So the cut names only affect people looking at the chart.
Why It Happens
The chart shortens its category labels, and nothing in its documented properties changes that. On this screen, both labels ended after seven letters, at 60 degrees and at 0 degrees, with one column or two. Microsoft's reference doesn't describe the behaviour, so this post can't say more about its cause than that.
The Fix
Keep the chart for the picture, and put each department's full name and total in a list right under it. The list uses the same grouping as the chart, so the two always agree.
Insert a Text control under the chart, lblDepartmentTotalsRS, with Size 14, Auto height on so it grows with the number of departments, and AccessibleLabel Self.Text. Its Text writes one line per department, joined with a line break, with Concat:
If(
    IsBlank(locRowsRS),
    "",
    Concat(
        Sort(
            AddColumns(GroupBy(locRowsRS, Department, Rows), Hours, Sum(Rows, Hours)),
            Department
        ),
        $"{Department}: {Text(Hours, "0.00")} hours",
        Char(10)
    )
)
locRowsRS is the screen's table of approved entries; GroupBy and Sum make one row per department with its hours (How to Total Each Group in Power Apps with GroupBy and Sum). The IsBlank check keeps GroupBy from running before the first load (Fixed: "The First Argument to the GroupBy Function Cannot Be Blank" in Power Apps). Its Visible is the chart's, so the list shows only when the chart does.
XLabelAngle stays at 0: level labels are easier to read, even cut.
After the Fix
The names under the columns are still cut, and the full names and totals sit right under the chart:
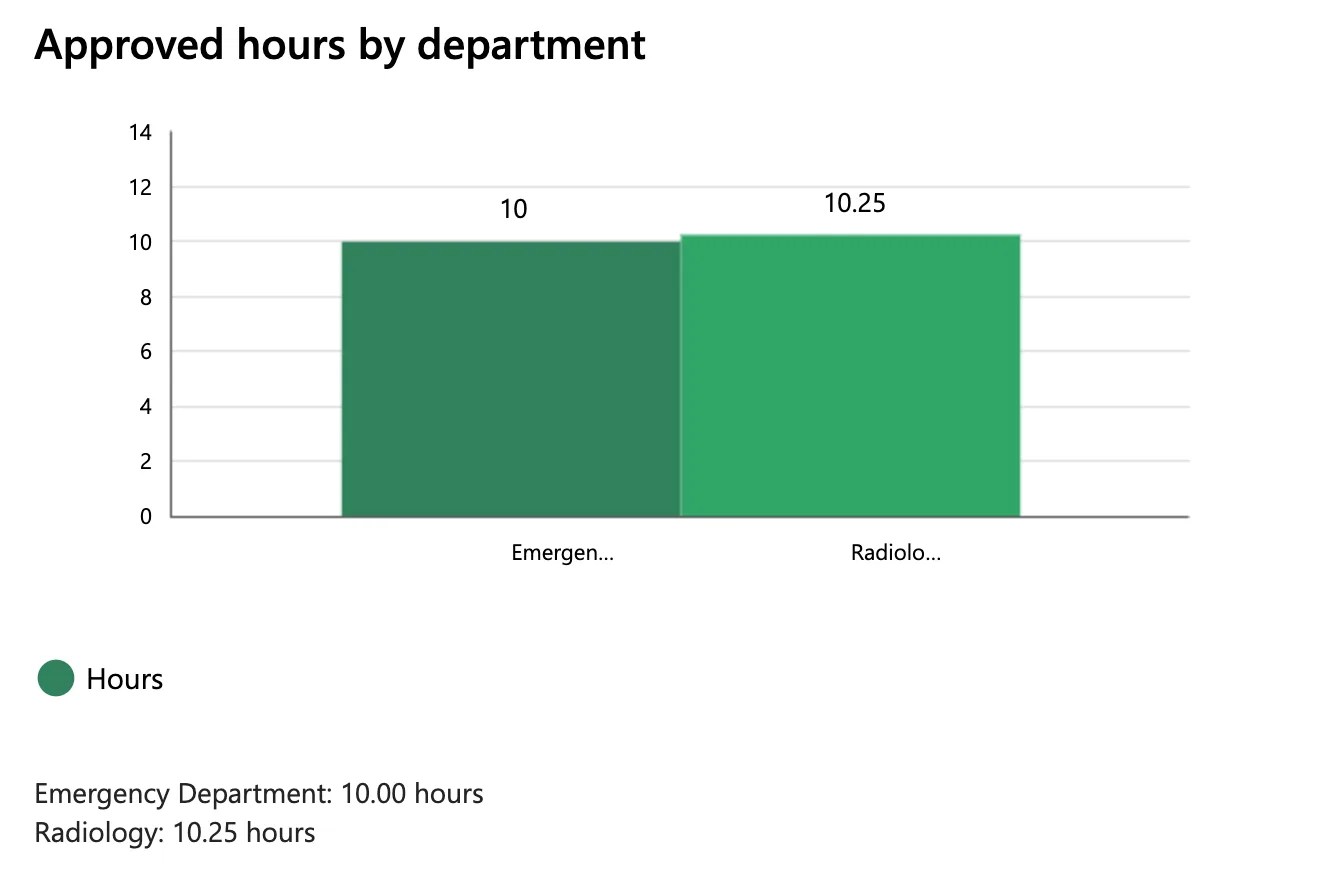
On a phone, the same lines wrap if they need to, because the label's height follows its text.
Common Mistakes
| Mistake | What happens | Do this instead |
|---|---|---|
Expecting XLabelAngle 0 to show whole names | The label turns level and stays cut | Show the full names in text near the chart |
| Shortening the department names in the data | Every other screen and report gets the short names too | Leave the data alone |
| A second GroupBy with different rules for the list | The list and the chart can disagree | The same grouping and sum as the chart's Items |
| Dropping AccessibleLabel on the list | Screen readers get a label without a name | AccessibleLabel Self.Text |
Troubleshooting
| Symptom | Likely cause | Fix |
|---|---|---|
| Labels end in … after a few letters | The chart shortens category labels | A text list of the full names |
| The list shows one long line | Concat's separator isn't a line break | Char(10) |
| The list's last lines are hidden | The label has a fixed height | Auto height on |
| The list shows while the chart is hidden | Different Visible formulas | Give the list the chart's Visible |
FAQ
Does a horizontal bar chart solve this?
Power Apps' classic charts are a column chart, a line chart and a pie chart. Microsoft's Show data in a line, pie, or bar chart uses the Column chart for its bar chart, so there's no separate horizontal one to switch to.
Can I make the chart's font smaller to fit more letters?
The reference doesn't say the label's length depends on the font. On this screen, the names were cut at seven letters whatever the room, so I didn't change the font.
Why not drop the chart?
The chart shows at a glance which department has more overtime; the list gives exact names and totals. Together they cover both, and screen readers get the full names either way.
Conclusion
A Power Apps column chart can cut its category labels short, and its reference has no setting for their length; turning them level doesn't help. Keep the chart, and list each full name and its total under it with Concat, built from the same grouping as the chart.
Additional Resources
- Column chart and Line chart controls in Power Apps: XLabelAngle and the screen reader guidelines
- Concat function
- Char function
